The liquidity advantage of ETFs in stressed markets
- Particularly in a volatile market, it’s important to ensure that your portfolio has adequate liquidity should you need to trade.
- In comparison to mutual funds, ETFs trade intraday and their liquidity is supported by two trading markets—making them especially useful in market stress.
- Liquidity has become a key component of total cost of ownership (TCO) analysis, especially as the number of ETFs continues to grow.
When volatility rises, it puts the spotlight on liquidity—the ability to buy or sell a security quickly, easily, and at a reasonable cost.
Particularly in a volatile market, it’s important to ensure that your portfolio has adequate liquidity should you need to trade. That means reviewing the liquidity profile of your portfolio, as well as the liquidity of individual funds.
Investors choose ETFs
As volatility has increased in recent years, investors have gravitated toward exchange traded funds (ETFs) for their key attributes of transparency and liquidity.
Created in the wake of the market crash of 1987 to allow investors to trade with limited impact on the securities held by the funds, ETFs provide liquidity when investors demand it most. And investors trust liquid ETFs to express their views and reposition portfolios in uncertain markets.
Unlike mutual funds, ETFs trade intraday on stock exchanges at market-determined prices. But what’s really unique about ETFs—and especially relevant in market stress—is that their liquidity is supported by two trading markets.
In the secondary market, where most investors trade, ETF liquidity is provided by ETFs trading on exchange. That’s enhanced by the primary market liquidity of the ETF’s underlying securities, which is sometimes even greater than an ETF’s secondary market liquidity.
Creation and redemption fuel liquidity
These two layers of ETF liquidity stem from how they are created and redeemed. And assessing an ETF’s total liquidity begins with understanding the creation and redemption process.
Creation and redemption happens in the primary market and is facilitated by authorized participants (APs). APs are US-registered, self-clearing broker dealers who regulate the supply of ETF shares in the secondary market.
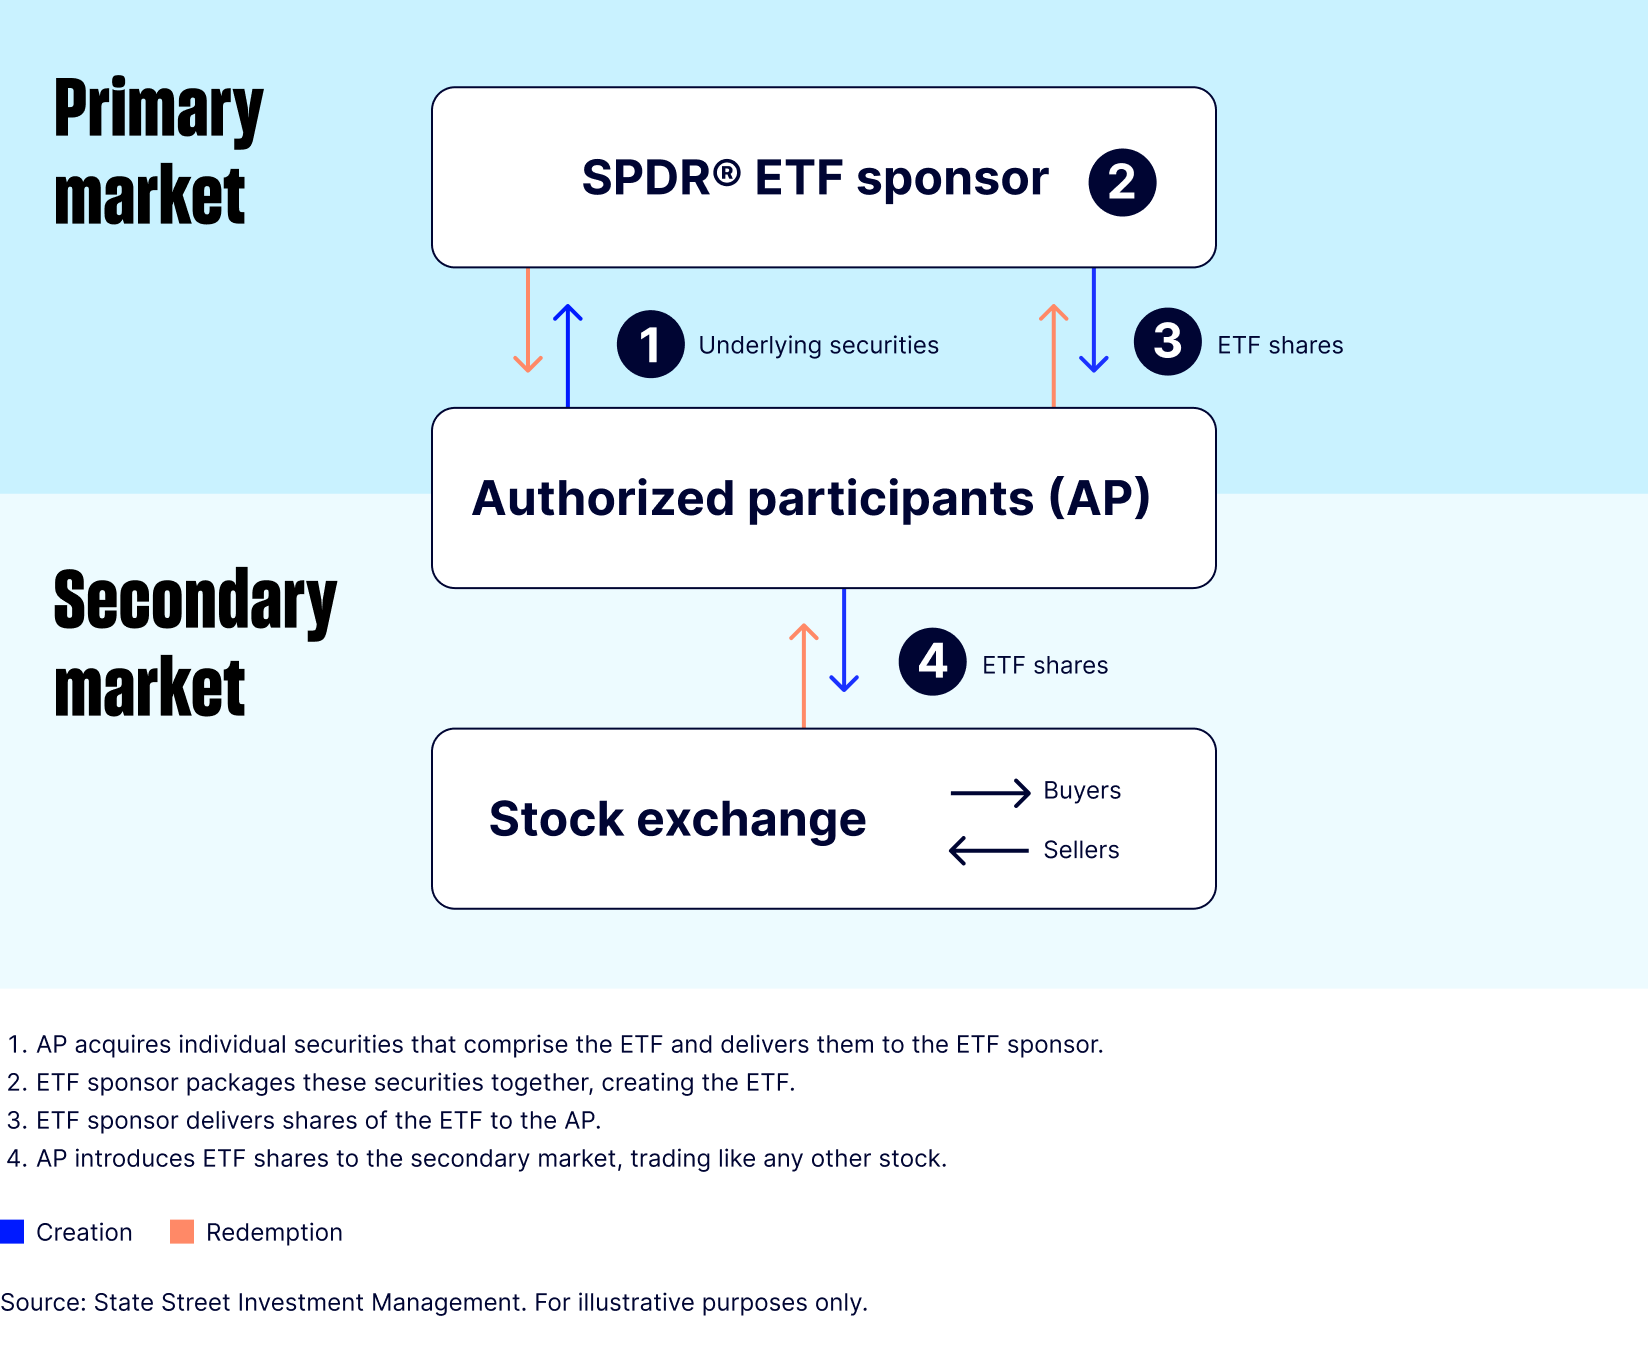
APs create ETF shares in large increments—known as creation units—by assembling the underlying securities of the fund in their appropriate weightings to reach creation unit size, which is typically 50,000 ETF shares. The AP then delivers those securities to the ETF sponsor. In return, the ETF sponsor bundles the securities into the ETF wrapper and delivers the ETF shares to the AP. These newly created ETF shares are then introduced to the secondary market, where they are traded between buyers and sellers through the exchange.
When demand increases more ETF shares can be created, thus allowing the liquidity of an ETF’s underlying securities to enhance the liquidity of the ETF itself.
When demand decreases, APs redeem ETF shares by reversing this process. Large increments of ETF shares—known as redemption units—are collected in the secondary market and then delivered to the ETF sponsor in exchange for the underlying securities in the appropriate weighting equaling that redemption unit (again, typically 50,000 shares).
Because ETFs can be disassembled back into single securities, the ETF’s portfolio manager typically does not need to buy or sell securities, except for rebalancing purposes.
Figure 2: How the creation and redemption process works
Gauging liquidity as markets change
Because an ETF’s assets and trading volume ebb and flow, it’s helpful to focus on at least two years of data when conducting both market-based and fund-specific liquidity analysis. Too short of a time period may not allow for multiple market environments to be analyzed. Too long a period could introduce stale data that may not reflect the current market environment and fund profiles.
To analyze the liquidity risk of your portfolio, evaluate these three main factors:
- Bid-ask spreads: The bid-ask is the cost of transacting in any security (exclusive of brokerage commission costs). The greater the difference between the price a buyer is willing to pay and the price a seller is willing to accept, the greater the liquidity risk. Tighter spreads indicate better liquidity.
- Trading volumes: Thinly traded securities with low trading volumes will be more at risk if markets deteriorate.
- Valuations: Equities that are highly valued compared to their peers and their historical averages are more vulnerable to liquidity risk than stocks with lower valuations.
Each of these measures is impacted when volatility pushes investors to perceived safer areas of the market. With this flight to safety, bid-ask spreads may widen. Robust trading volumes may disappear. Stocks trading above their historical valuations may fall back to their multi-year average or lower. And the underlying liquidity for an asset class may be diminished. However, even with less liquidity, ETFs can function as valuable price discovery tools, providing insights into the market’s view on correct market pricing.
As for evaluating individual ETFs, liquidity has become a key component of total cost of ownership (TCO) analysis, especially as the number of ETFs continues to grow.
Here, secondary trading volume is often the first measure of ETF liquidity. However, investors with larger order sizes can source liquidity not displayed on the screen from liquidity providers. And, remember, ETFs are at least as liquid as their underlying constituents at any given point in time.
Naturally, volatility impacts an ETF’s liquidity profile in both the secondary and primary markets. In particular, stress in the equity and bond markets can lead to wider bid-ask spreads for individual funds.
When volatility hits, market makers are forced to widen their spreads to include a buffer for the additional market volatility. To hedge their risk and facilitate orderly trading, market makers often use an array of tools—underlying securities or correlated proxies, such as index futures or other ETFs. Included in an ETF’s spread, this hedging cost is passed along to investors trading in the secondary market.
The extent that an ETF’s bid-ask spread widens depends largely on the fund’s liquidity profile and perceived risk of the asset class. Typically, these wider bid-ask spreads are temporary.
Look to the liquidity leader
When volatility strikes, it’s common to feel compelled to “do something…anything.” Understanding the liquidity of your portfolio can help you to resist making impulsive trading decisions and to trade efficiently in an increasingly uncertain environment.
If you must trade, don’t use market orders. Also, don’t trade within the first 30 or last 30 minutes of the trading day, when volatility tends to be highest and spreads at their widest.
If you have questions about trading in today’s volatile market, State Street Investment Management’s Execution Strategy and Analytics team can help. Having built relationships with authorized participants, market makers, liquidity providers, execution trading desks/platforms and stock exchanges, we play an active role in supporting competitive markets and maintaining the State Street ETF liquidity ecosystem.
Our vast insight into primary and secondary market activity—as well as our access to numerous proprietary pre-trade liquidity analytics tools—can help you to evaluate execution strategies and meet your objectives, even in a volatile market.