Creating a Custom LDI Benchmark Through Cash Flow Analysis
How State Street helped a corporate plan minimize tracking error volatility by replacing an off-the-shelf benchmark with a custom index.
For corporate plan sponsors, choosing a standard fixed income benchmark is a common strategy for their liability-hedging investments. An off-the-shelf index is a relatively easy and low-cost solution to implement, and long government or corporate bonds can provide an approximation of a plan’s liability profile.
However, standard benchmarks by definition can’t precisely match the unique characteristics of any plan’s liabilities. That was the problem facing a US-based corporate plan sponsor that was using the Bloomberg Long Government/Credit Index as its benchmark. The company understood that this imprecise solution was suboptimal, particularly as the plan’s fixed income assets grew alongside its improved funded status.
The company asked State Street Global Advisors to create a better LDI benchmark. State Street performed a detailed analysis to design a custom index that closely matched the plan’s actual liability characteristics, helping improve returns and minimize funded ratio volatility.
Conducting an Efficient-Frontier Analysis
State Street’s LDI Solutions Team began its analysis by discounting the plan’s actual cash flows over the coming decades to ascertain the plan’s unique liability profile, including duration, yield, and key rates. The team also considered important plan sponsor constraints, such as a preference for liquid, low-cost investments over complex instruments such as derivatives.
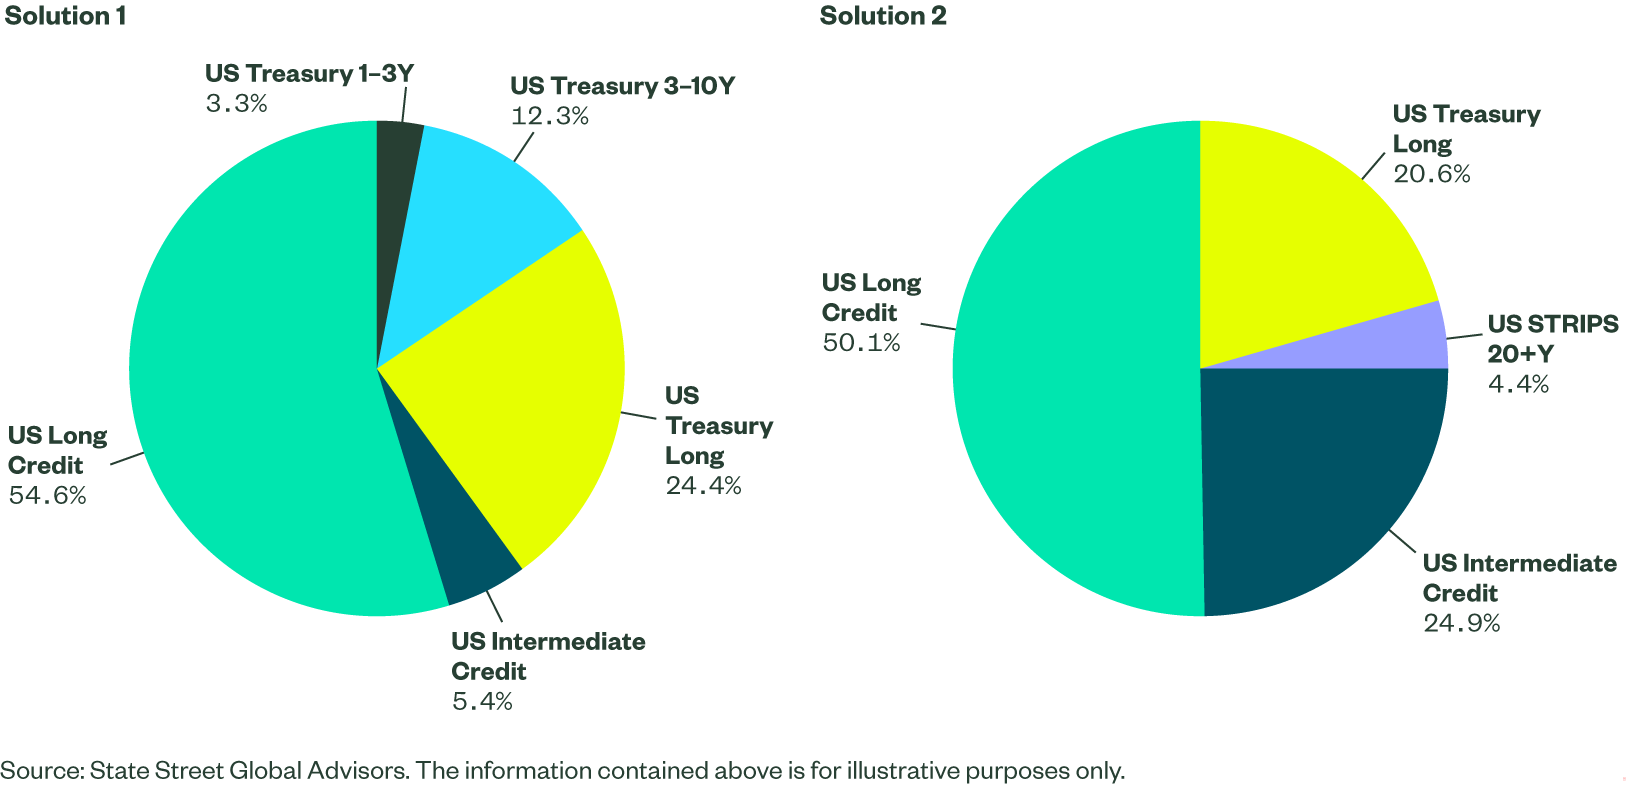
Next, the team used its proprietary optimizer to analyze a range of mixes, ultimately identifying three potential custom indexes that accounted for those constraints and closely matched the key characteristics of the plan’s liabilities. Each custom index was composed of exposures that can be implemented through State Street’s LDI Building Blocks, a set of 17 strategies representing a full range of interest rate and credit exposures, all available in liquid, low-cost commingled structures.
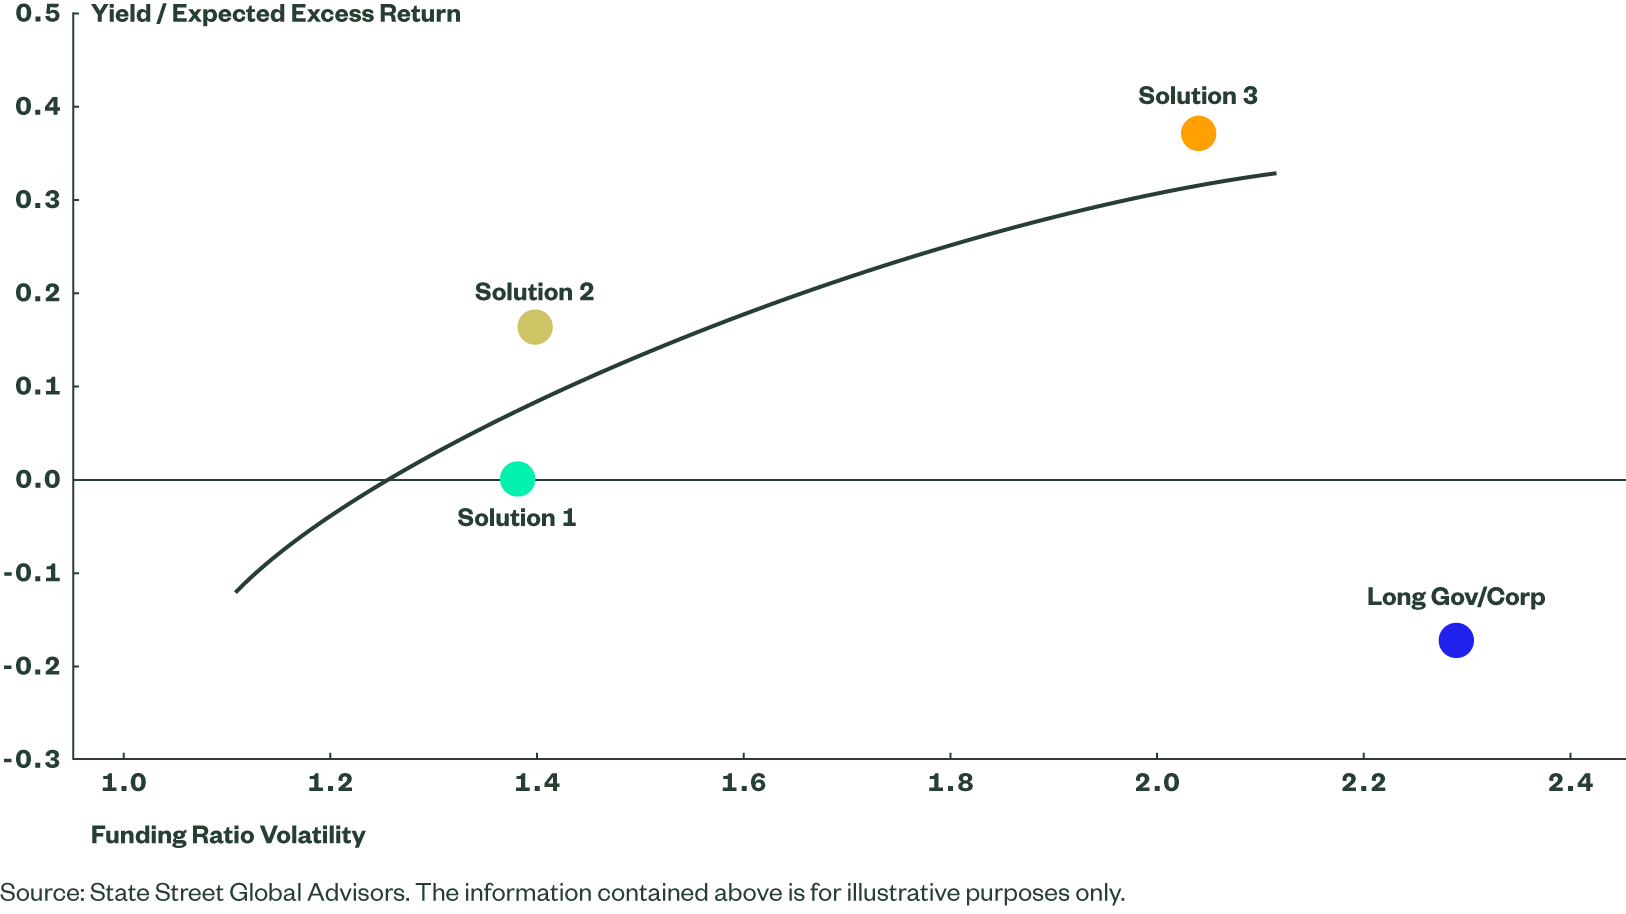
To illustrate the difference between these custom indexes, the team performed an efficient-frontier analysis to examine each index solution’s potential impact on funded ratio volatility and yield. This analysis provides a straightforward comparison of each solution’s risk-reducing benefits — via lower funded ratio volatility — alongside its yield. The team included the Long Gov/Corp on the efficient frontier for comparison purposes.
Figure1: Tracking Error vs. Return

As illustrated, Solution 1 offered the lowest funded ratio volatility but came with a significantly lower yield. Solution 2 had marginally higher funded ratio volatility (1.40% vs. 1.38%) but with meaningfully higher yield. Solution 3 offered even higher yield but came with higher funded ratio volatility (2.04%). Importantly, all three solutions closely mirrored the liability’s key rate and credit risk characteristics, and met the sponsor’s desire for simple, efficient implementation. What’s more, all three would significantly reduce the 2.3% funded ratio volatility offered by the off-the-shelf benchmark. Fixed income investors can choose from a spectrum of style options, from indexed strategies to unconstrained approaches. Active strategies occupy a middle ground: They offer the potential for excess returns over indexing but tend to produce less tracking error than unconstrained strategies.
Reducing Tracking Risk and Enabling Ongoing Optimization
Based on this analysis, the company chose Solution 2 as the ideal benchmark. The 2-basis point increase in funded ratio volatility was, in their view, more than offset by the yield improvement over Solution 1. While Solution 3 offered the highest yield, the company did not believe the increase was enough to offset the higher funded ratio volatility.
Figure 2: A Comparision of Solutions

Based on this analysis, the sponsor then implemented a liquid, efficient portfolio to match Solution 2, using State Street’s LDI building block funds.
Compared to the prior standard index, the custom solution reduced funded ratio volatility by nearly 40% — while offering 33 basis points of incremental yield.
The custom solution also provided the company with a better tool for maintaining its de-risking glidepath. As the liability evolves and market conditions shift, the plan’s liability characteristics can drift away from that ideal benchmark. But through annual cash flow analysis and periodic rebalancing, the company can continually optimize its asset mix to match its liability profile.
This combination of a custom benchmark, a robust set of liquid, efficient building block funds, and a process for regular adjustments provides a more efficient and precise method for pursuing the plan sponsor’s primary goal: maintaining a simple, liquid LDI solution that minimizes funded ratio volatility.
Contact your relationship manager to discuss how liability analysis and custom index design might help to meet your plan's LDI objectives.
More on Defined Benefit