SPY liquidity: Flexibility to navigate any market
- State Street® SPDR® S&P® 500 ETF Trust (SPY) is the most liquid ETF based on several observable metrics including average daily value (ADV) traded, short interest, and options open interest.1
- SPY’s overall robust liquidity profile provides cost benefits relative to its competitors, regardless of execution strategy implemented.
- Traders seeking a high degree of implementation flexibility—and a cost-efficient tool for different market environments—may want to look more closely at SPY.
The State Street® SPDR S&P 500 ETF Trust (SPY), the most liquid ETF based on average daily value (ADV) traded,1,2 has averaged $39.8B in notional average value traded per day during the first half of 2024 — that represents more than 82% of all S&P 500 ETF trading.3
SPY’s higher secondary volume is driven by a diverse ecosystem of users, as evidenced by the fact that SPY accounts for 88.9% of all S&P 500 ETF notional short interest and 99.2% of all S&P 500 ETF options open interest as of June 30, 2025.4
We are often asked the question—how does SPY’s higher trading volume distinguish it from other S&P 500 ETFs? Secondary market trading is an essential layer of ETF liquidity (Figure 1). And, SPY’s secondary market depth enables a wider range of execution strategy options and offers implicit transaction cost benefits across those execution strategies.
Figure 1: ETF trading ecosystem
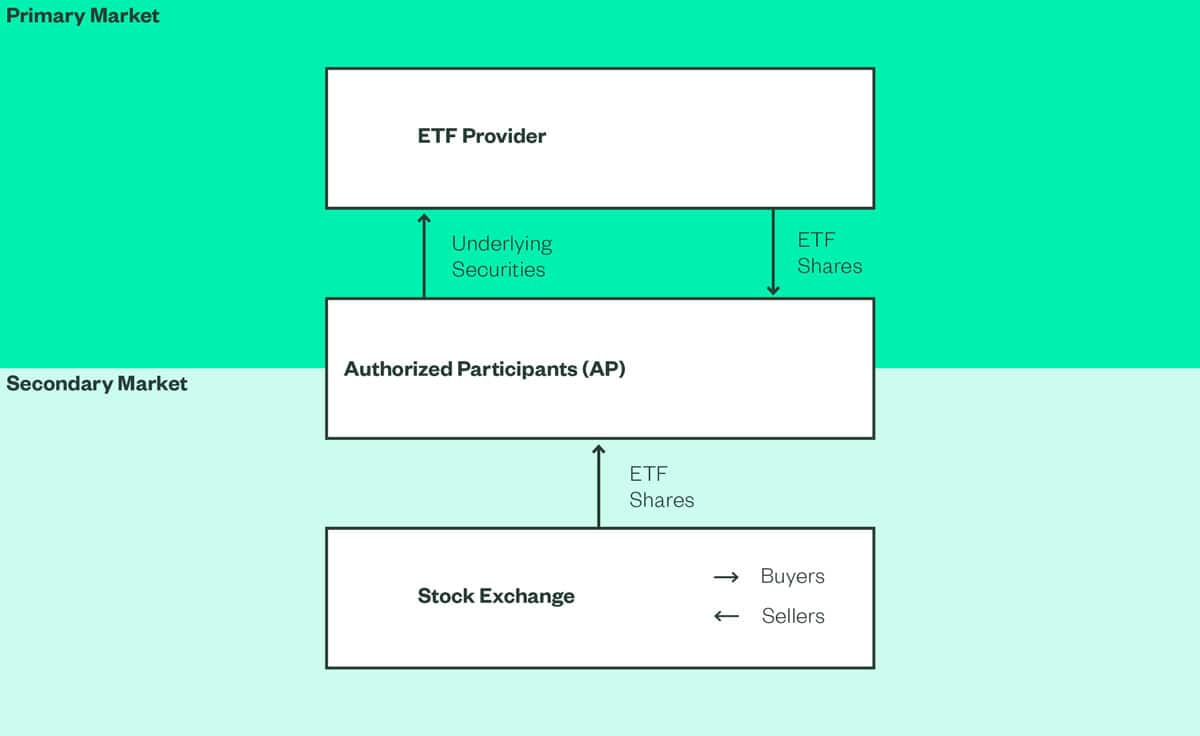
Source: SPDR Execution Strategy and Analytics team. The information contained above is for illustrative purposes only.
Secondary market trading: SPY versus competitor S&P 500 ETFs
Compared to SPY, the year-to-date (YTD) average bid-ask spread of competitor S&P 500 ETFs5 is more than two times SPY’s bid-ask spread, with higher relative volatility.6 These differences in competitor products—wider spreads and higher relative volatility—tend to be more pronounced in times of market stress. A pre-trade cost estimate analysis comparing SPY execution costs with those of SPY’s two largest competitor ETFs illustrates this (Figure 2).7
Figure 2: SPY execution costs lower than S&P 500 ETF competitors⁸
| Costs in basis points (bps) | State Street® SPDR® S&P 500® ETF Trust (SPY) | iShares Core S&P 500 ETF (IVV) | Vanguard 500 Index Fund ETF (VOO) |
|---|---|---|---|
| +Spread cost from NBBO-mid | 0.04 | 0.13 | 0.11 |
| +Market impact cost | 0.26 | 0.28 | 0.28 |
| Estimated cost | 0.30 | 0.41 | 0.39 |
Source: SPDR Execution Strategy and Analytics team, Virtu/ITG, Bloomberg as of June 30, 2025, VWAP 12:00-12:30pm
The funds presented herein have different investment objectives, costs and expenses. Each fund is managed by a different investment firm, and the performance of each fund will necessarily depend on the ability of their respective managers to select portfolio investments. These differences, among others, may result in significant disparity in the funds' portfolio assets and performance. For further information on the funds, please review their respective prospectuses. |
Using the SPDR ETF pre-trade tool powered by Virtu, we estimated execution costs for a $25M notional order using a volume-weighted average price (VWAP) electronic trading strategy over 30 minutes (12-12:30pm). SPY’s two largest competitors exhibit significantly higher estimated market impact costs, as the order size represents a higher percentage of trading over the cost analysis period.
As a point of reference, the expected execution cost to trade the underlying S&P 500 constituents using the same pre-trade parameters was 3.08 bps, making SPY the only S&P 500 ETF to show price improvement relative to the basket in the below analysis.
Risk trades for large or higher urgency orders
For larger order sizes or those of higher urgency, investors may want to consider a risk, or “block” trade. Offering immediate execution at a single price, with a risk trade the liquidity provider takes on the risk of managing their resulting position. Because liquidity providers will often compete for the trade, by aggregating multiple quotes across liquidity providers, risk trading allows for a clear measure of best price execution.
Comparing all S&P 500 ETF block trades in the first half of 2024 over $10M notional relative to total traded value over the same period, we see that blocks for all other S&P 500 ETFs represent a significantly higher percentage of total traded value than does SPY.
This is likely due to limitations on secondary trading for some S&P 500 ETFs, as well as the depth of the broader S&P 500 ecosystem supporting competitive pricing for risk trades.
In addition to providing tighter spreads and lower market impact costs for retail investors executing electronically on the secondary market, SPY’s depth of liquidity across market makers means institutional-sized orders can be executed as a risk trade with minimal market impact. SPY’s overall robust liquidity profile provides cost benefits relative to its competitors, regardless of execution strategy implemented.
Figure 3: SPY offers more execution options, same quality execution
| Blocks over $10M | Total traded value | Blocks as % of total trading | |
|---|---|---|---|
| State Street® SPDR® S&P 500® ETF Trust (SPY) | $24,540,315,090 | $4,856,468,730,000 | 0.51% |
| iShares Core S&P 500 ETF (IVV) | $27,202,229,912 | $482,661,906,000 | 5.6% |
| Vanguard 500 Index Fund ETF (VOO) | $29,208,516,945 | $478,791,370,000 | 6.1% |
Source: SPDR Execution Strategy and Analytics team; Virtu/ITG as of June 30, 2025. All reported block trades for S&P 500 ETFs from January 2, 2025–June 30, 2025 over $10M notionally. Excludes auction and after-market trades. |

What else can you do with SPY?
The possibilities are nearly endless when you invest in the world’s most traded ETF.9
SPY: The S&P 500 ETF for execution flexibility
Looking at transaction costs for various trading execution strategies across all S&P 500 ETFs over $200B AUM, we see that SPY, as a result of its higher trading volume, can potentially deliver transaction cost benefits above other S&P 500 ETFs.10 And these benefits may be more pronounced during periods of market stress.
As a result, traders seeking a high degree of implementation flexibility—and a cost-efficient tool for navigating different market environments—may want to look more closely at SPY.