Insights
The Fed forays into ETFs
18 May 2020
This past week has seen the US Federal Reserve (Fed) commence purchases of US corporate bond ETFs. At present there is little visibility around what has been bought or, indeed, what is even on the list of potential purchases. The Fed has been vague, suggesting its Secondary Market Corporate Credit Facility (SMCCF) ‘may purchase US-listed ETFs whose investment objective is to provide broad exposure to the market for US corporate bonds.’ The market notice then goes on to say that the preponderance of holdings will be in investment grade (IG) ETFs with the remainder in high yield.
It is rational to assume that the Fed will follow similar guidelines to those issued for the corporate bond purchases, namely that they will only buy bonds out to 5 years. As a result, we continue to view the short end of the IG credit curve as the sweet spot for investors both because Fed buying provides protection and because duration risk is low.
At the same time, the yield pick-up versus government bonds is meaningful at around 150bp for the Bloomberg Barclays 0-3 Year US Corporate Index. With Fed Chairman Powell suggesting little appetite to take the funds rate negative, it is going to be hard for government bonds to post strongly positive returns; as such, a strategy of harvesting the higher corporate yields makes sense.
Spreading the goodwill
There is also a case for being constructive on IG bonds beyond 5 years, in our opinion. Is The investment case is based on the following points:
- The Fed acknowledges that it is not always possible to follow the same restrictive path as the one for credit. When purchasing ETFs, ‘In some cases, the holdings of ETFs may include underlying bonds that have a remaining maturity longer than 5 years at the time of purchase.’
- A more serious challenge may be finding a sufficient value of short duration ETFs to purchase. The amount of buying could be substantial with the combined size of both the primary and secondary market CCFs up to $750 billion once leverage is accounted for. At the same time the Fed has restricted itself to buying only up to 20% of an ETF’s outstanding shares. The total value of US IG corporate ETFs listed in the US is $153 billion 1, which implies a purchase potential of just over $30 billion, of which an even smaller proportion will be sufficiently maturity-constrained to suit the Fed. So, barring large creations, it is going to be a struggle to focus buying solely on short duration ETFs. With the window for buying only open until 30 September 2020, this may ultimately push the Fed to purchase some of the broader indices.
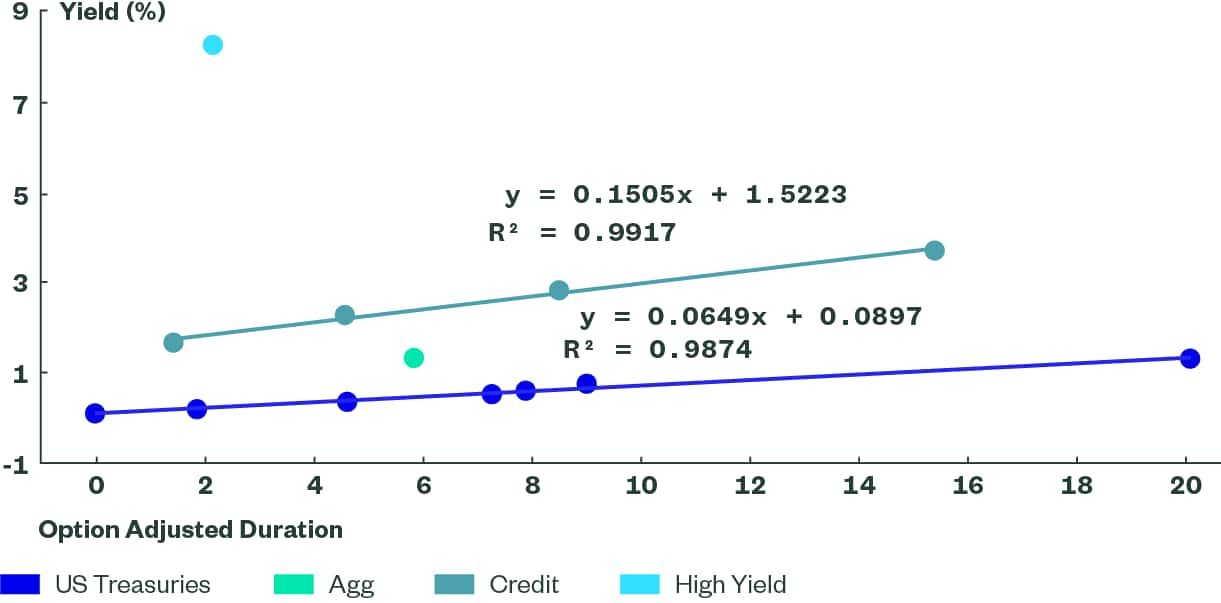
- Investors displaced from the front end are likely to extend out along the curve. The credit curve is steep relative to the Treasury curve (Figure 1), with the option-adjusted spreads clearly wider at the long end.
Figure 1: Risk-Reward Trade-Off

Source: State Street Global Advisors, Bloomberg Finance L.P., as of 14 May 2020.
Steep curves
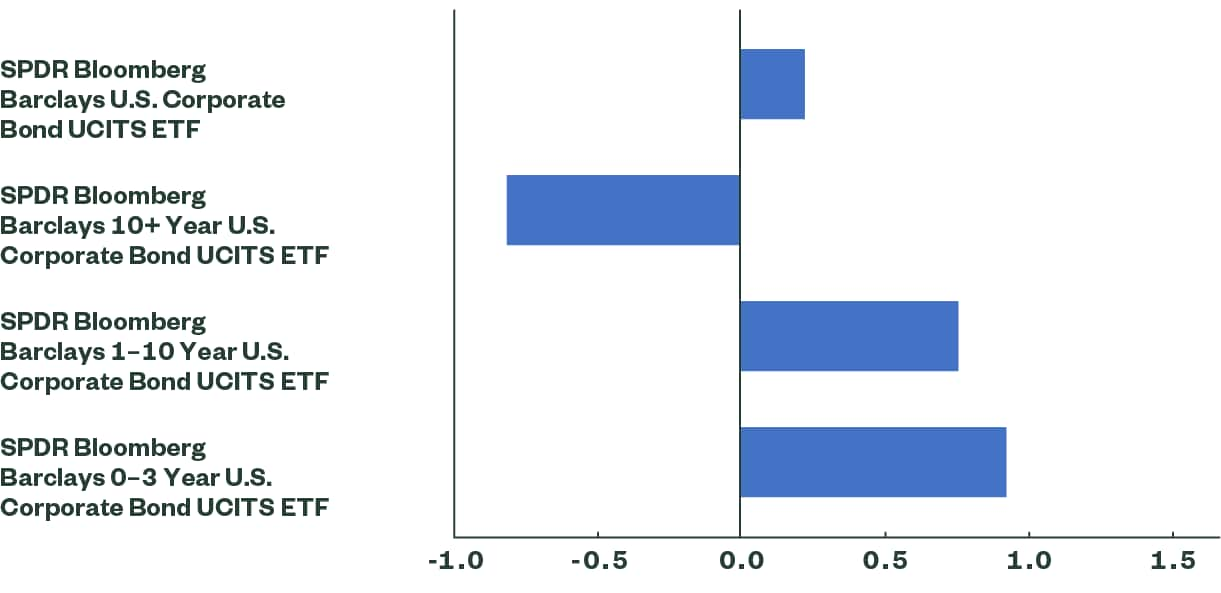
A large part of the steepness relates to the fact that the Fed is not expected to buy long-dated bonds. Figure 2 shows the market’s interpretation of the Fed’s plan quite clearly, with the Bloomberg Barclays 0-3 Year Index posting the strongest returns year to date while the 10+ year index is the only one in negative territory.
This poor performance has created some value in the long end. With a yield to worst of over 3.60%, the Bloomberg Barclays 10+ Year US Corporate Bond Index is getting up towards yields seen on emerging market debt funds. The spread in the yield to worst between the 10+ year index and the Bloomberg Barclays 1-10 Year US Corporate Bond Index is at close to its widest levels since late 2017. So the curve is steep and may attract buyers looking to reduce outright exposure to risk assets like equities, high yield and emerging markets.
Figure 2: Total Returns YTD (%)

Source: State Street Global Advisors, Bloomberg Finance L.P., as of 14 May 2020.Past performance is not a reliable indicator of future performance. Performance quoted represents past performance, which is no guarantee of future results. Investment return and principal value will fluctuate, so you may have a gain or loss when shares are sold. Current performance may be higher or lower than that quoted. All results are historical and assume the reinvestment of dividends and capital gains. Visit www.ssga.com for most recent month-end performance. Index returns are unmanaged and do not reflect the deduction of any fees or expenses.
How to play this theme
SPDR offers various ETFs through which investors can access these themes. To learn more about these funds, and to view full performance histories, please follow the links below:
SPDR Bloomberg Barclays 0-3 Year U.S. Corporate Bond UCITS ETF
SPDR Bloomberg Barclays 10+ Year U.S. Corporate Bond UCITS ETF
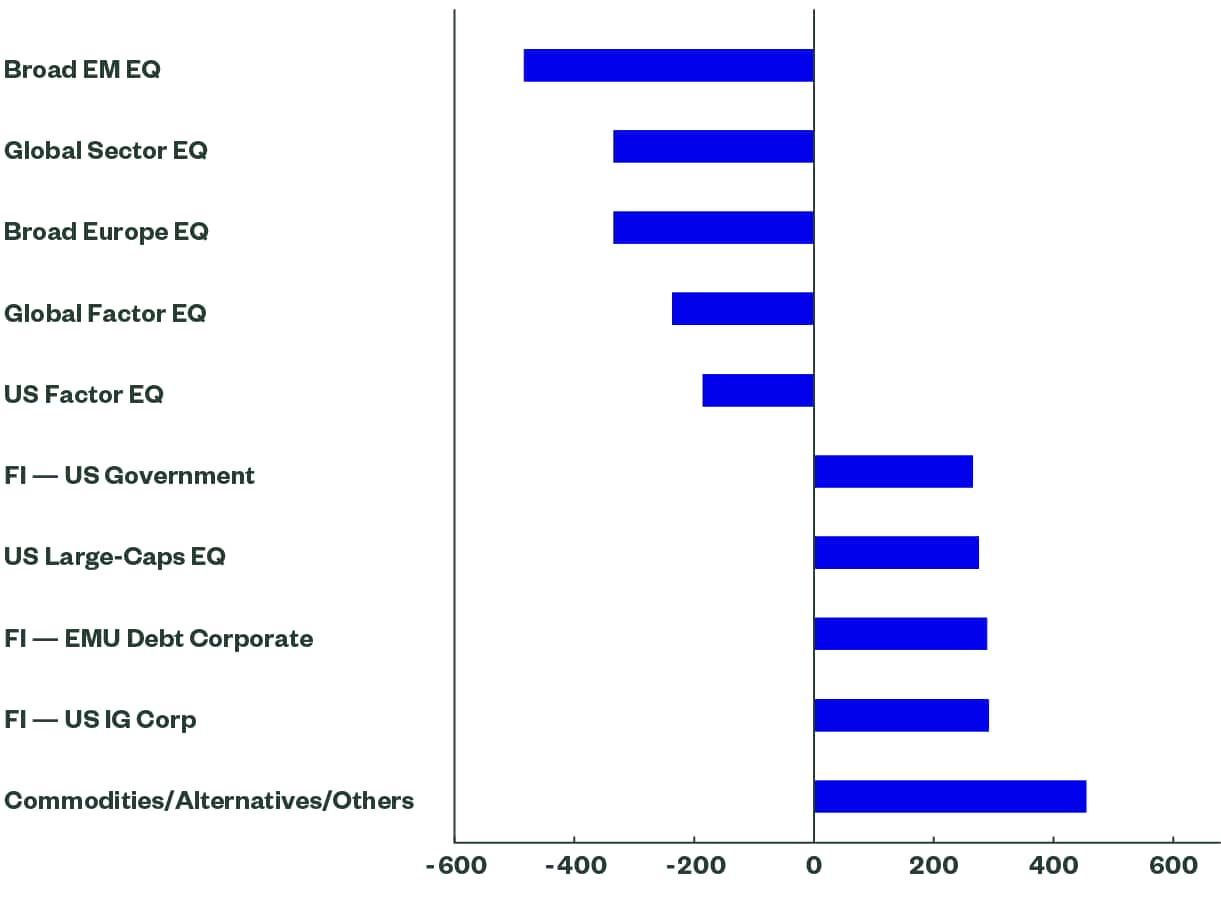
European-Domiciled ETP Segment Flows (Top/Bottom 5, $mn)

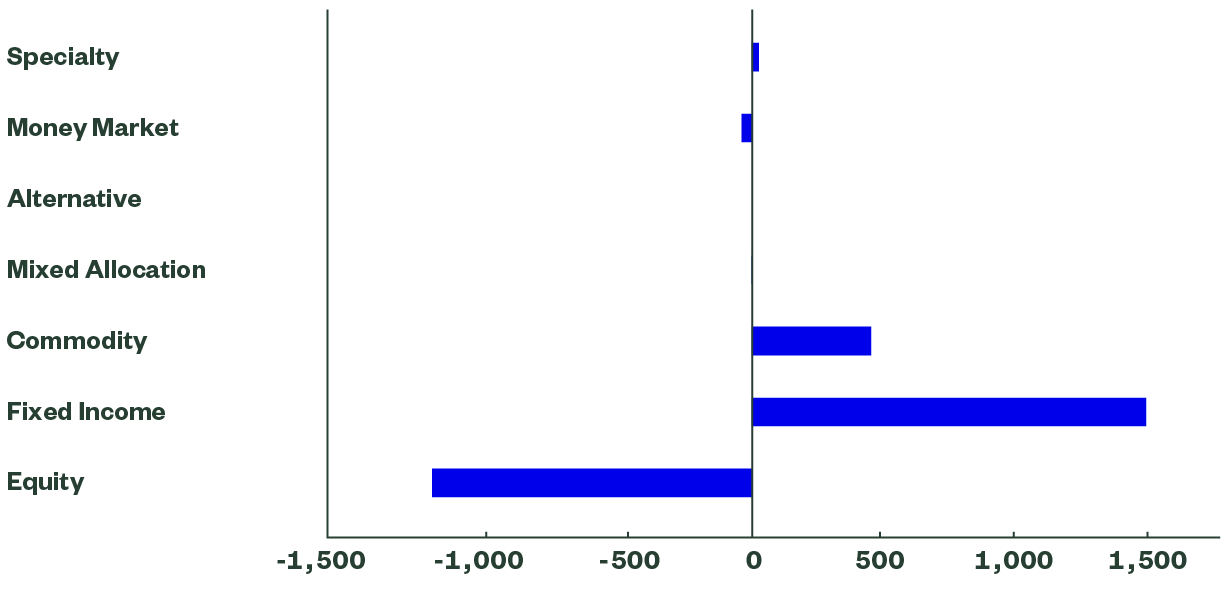
European-Domiciled ETP Asset Category Flows ($mn)

Sources: Bloomberg Finance L.P., for the period 7 -15 May 2020. Flows are as of date indicated and should not be relied upon as current thereafter
Get in touch
Contact us for more information