Rising yields reshape markets
Since the start of May, yields have moved sharply higher, driven primarily by a rise in real yields. The shift reflects resilient growth data alongside a meaningful repricing of the Fed policy path. Markets have moved from assigning some probability to rate cuts to fully pricing in hikes, as data across CPI, PPI, JOLTS, and payrolls has come in stronger than expected. For a deeper dive, our fixed income team outlines a scenario-based view on where yields may head next.
Weekly highlights
Source: FactSet. Data as of 5/25/2026 (ERP) and 5/27/2026 (Stock Bond Correlation, 10Y UST Yield). ERP reflects the gap between S&P 500 earnings yield and 10-year Treasury yield; correlation based on trailing 12-month daily returns.
Markets rebound as rates rise
Despite rising real yields, US equity markets have recovered meaningfully after a shaky first quarter, even as geopolitical risks, including ongoing conflict in the Middle East, persist. Beneath the surface, however, leadership has shifted notably. The first quarter was characterized by outperformance in value, cyclicals, and small caps, but the second quarter has marked a clear rotation back toward growth and large caps. Across sectors, this shift has been pronounced. Information Technology moved from one of the worst-performing sectors at the end of Q1 to an outperformer quarter-to-date, while Energy has experienced the opposite pattern with the weakest returns in Q2.
Interestingly, valuations have evolved in a somewhat counterintuitive way. While the S&P 500 has delivered roughly 10% total return year to date, the forward P/E multiple has declined modestly from 22x at the start of the year to around 21.1x. This highlights a key dynamic: earnings have strengthened more rapidly than prices, allowing valuations to compress even as markets have advanced.
Looking across sectors, valuations remain elevated in a few key areas. Using z-scores of forward P/E relative to the past five years, only a handful of sectors screen as expensive, including Industrials, Consumer Staples, and Communication Services, while most sectors sit in a more neutral range. Notably, Information Technology now screens as the most inexpensive on this basis (admittedly, this highlights how expensive IT has been over this period). Today valuations appear supported by fundamentals, suggesting that equities are elevated but not broadly stretched across the market.
As the US 10-year yield holds near 4.5%, a level historically associated with tighter financial conditions, rates globally are trending higher, in part, due to rising oil prices feeding into inflation expectations. To date, Bunds, OATs and GILTS have all experienced significant parallel moves higher. In the US, the recent increase in real yields points to a market narrative driven more by resilient growth than by inflation alone, reinforcing confidence in the underlying economic backdrop.
Within fixed income, higher rates have created a headwind for duration, with the broad US Treasury index posting negative returns of -0.26% year-to-date. At the same time, performance dispersion within fixed income has been notable. Investment-grade credit has held up better than Treasuries, while high yield and TIPS have both delivered positive returns year-to-date. Within credit, lower-quality segments have outperformed, with BBB-rated bonds leading within investment grade and CCC-rated bonds outperforming within high yield. This reflects a continuation of the carry-driven environment, where income and risk-taking have been rewarded.
Despite elevated bond market volatility, credit spreads have remained remarkably contained and are currently near their year-to-date tights. Even as rates have fluctuated, spreads have not meaningfully widened over the past two months. This reflects a combination of resilient corporate fundamentals, strong investor demand for yield, and supportive technicals. In this environment, credit markets are being driven less by macro volatility and more by income demand and positioning, leaving spreads relatively insulated from movements in rates.
From a valuation perspective, fixed income remains compelling on an all-in yield basis, with yields hovering near levels seen this time last year. Interestingly, the shape of the yield curve, particularly at the long end, looks similar to where it stood a year ago during the “Liberation Day” fallout, when markets were grappling with a Fed on hold, sticky inflation, resilient growth, and ominous fiscal concerns. While today’s backdrop includes additional geopolitical risks, the core macro narrative remains largely unchanged. Over the past month, yields have shifted modestly higher across the curve, with the largest moves concentrated in the 2-7 year segment, or the belly.
US treasury yield curve
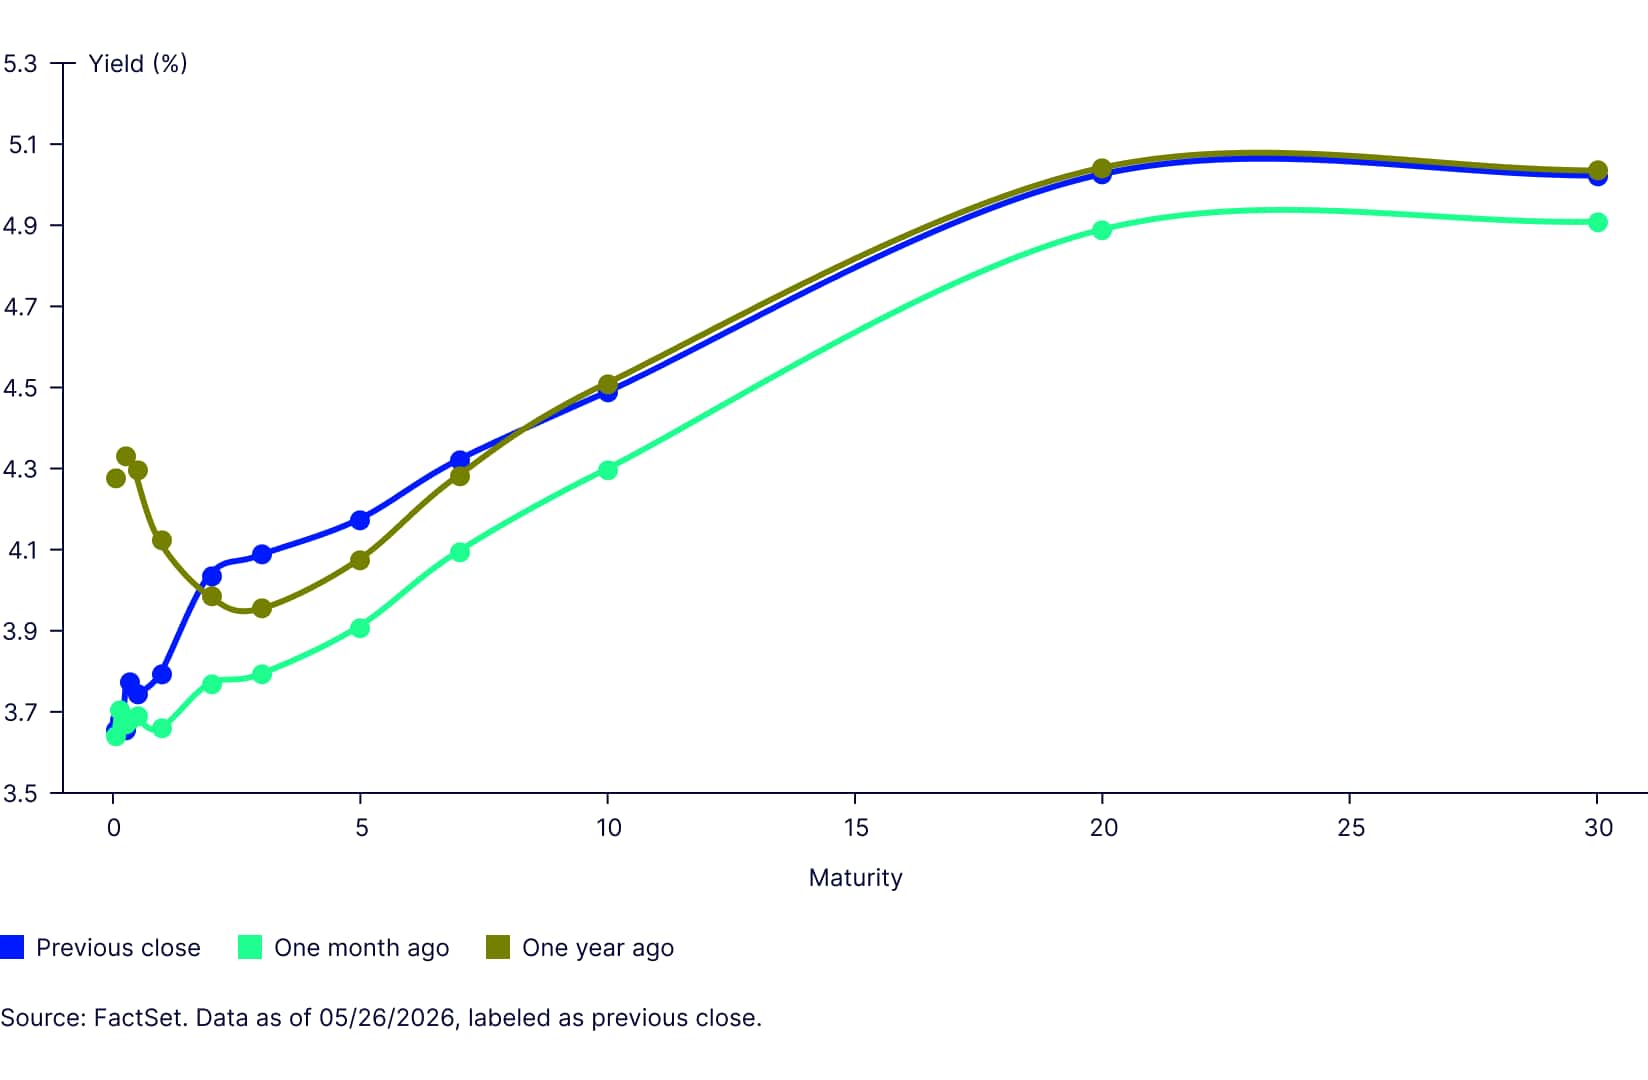
Positioning becomes increasingly important as yields rise but spreads remain contained; fixed income is becoming more attractive given higher starting yields. Though yields can continue to drift higher! In this environment, inflation protection through TIPS appears particularly compelling, while credit looks relatively rich with limited room for further spread compression.
More broadly, rising yields and persistent inflation pressures have important implications for asset allocation. Higher Treasury yields increase competition with equities, compressing the equity risk premium as bond yields approach earnings yields. At the same time, the stock-bond correlation remains in positive territory at 0.25 (based on daily total returns of the S&P 500 and Bloomberg US Aggregate Index over the trailing 12 months) reducing diversification benefits and reinforcing the case for inflation-sensitive assets, including real assets, within portfolios.
Overall, the market remains supported by solid fundamentals, but the balance of risks is shifting. Higher real yields, tighter risk premia, and evolving leadership point to a more selective environment, where earnings, carry, and positioning matter more than broad market direction.

Go beyond the headlines...
Skimmed the summary? Dive deeper with the full PDF—your go-to for weekly market insights and analysis.