
Who really sets the price in Asian markets?
Asia has built a strong domestic investor base that supports local markets, yet global capital, US rates, and the AI cycle continue to shape pricing and returns.
Asia's financial markets have become much deeper, but not necessarily more self-contained. Despite the growth of domestic savings and institutional investor bases, roughly four-fifths of Asia-Pacific cross-border portfolio assets remain invested outside the region across debt and equity (IMF CPIS, aggregated by ADB, Asian Economic Integration Report 2025). That helps explain an increasingly important distinction: Asian institutions now fund most of the region's local-currency bond market, but foreign investors still dominate the marginal trade that clears it. If domestic capital sets the floor and global capital sets the price, what sets the return?
Weekly highlights
Source: ADB AsianBondsOnline / Asia Bond Monitor. As of 3/31/26.
Source: NSE, Association of Mutual Funds in India (AMFI), State Street Investment Management. As of 12/31/2025.
Source: IMF CPIS, aggregated by ADB, Asian Economic Integration Report 2025. Data as of 12/31/2024.
For three decades, the standard way to understand Asian markets was to watch foreign flows. Inflows lifted currencies and asset prices; reversals threatened both. That framework, forged in the Asian Financial Crisis, is now incomplete. Asia has built a genuine domestic investor base, and in fixed income that base does most of the funding. What it does not yet do is clear the market.
Bonds: ownership has moved, pricing power has not
The clearest evidence sits in local-currency debt. Emerging East Asia had less than USD 1 trillion of local-currency bonds outstanding in 2000. By the first quarter of 2026, the market had reached USD 31.5 trillion, with 93.9% of issuance during the quarter denominated in local currency (ADB AsianBondsOnline / Asia Bond Monitor, as of 3/31/26). Banks hold roughly 34.6% of the regional market and insurers and pension funds a further 29.4%, while foreign investors hold about 10.8%. Governments and corporates increasingly borrow in the currency in which they collect taxes and earn revenue, and a resident institutional base provides a standing bid.
Here is the mechanism that is worth noting. Domestic institutions buy to match liabilities and tend to hold. Foreign investors buy and sell to express a view. Because the marginal trade clears the market, the smaller and more mobile pool determines where yields settle over any given month, even where it owns only a tenth of the stock. Ownership therefore tells you who absorbs a shock; turnover tells you who prices it. The two have separated, and every section below is an application of that distinction.
The consequence is shock absorption, not immunity: a price adjustment need not become a refinancing crisis, a distinction largely unavailable to Asian markets in 1997.
Equities: a domestic bid changes the drawdown, not the driver
India is the most instructive case. Cumulative net domestic institutional inflows into Indian equities reached roughly USD 252 billion by 2025, against roughly USD 73 billion from foreign portfolio investors, and domestic institutional ownership now exceeds foreign institutional ownership for the first time since tracking began in 2009 (NSE, AMFI, State Street Investment Management, as of 2025). The engine is the financialization of household savings through systematic investment plans, which have compounded at about 24% annually since 2020 and now run above USD 3 billion a month1 — equivalent to roughly 2.5% of free-float market capitalization a year2.
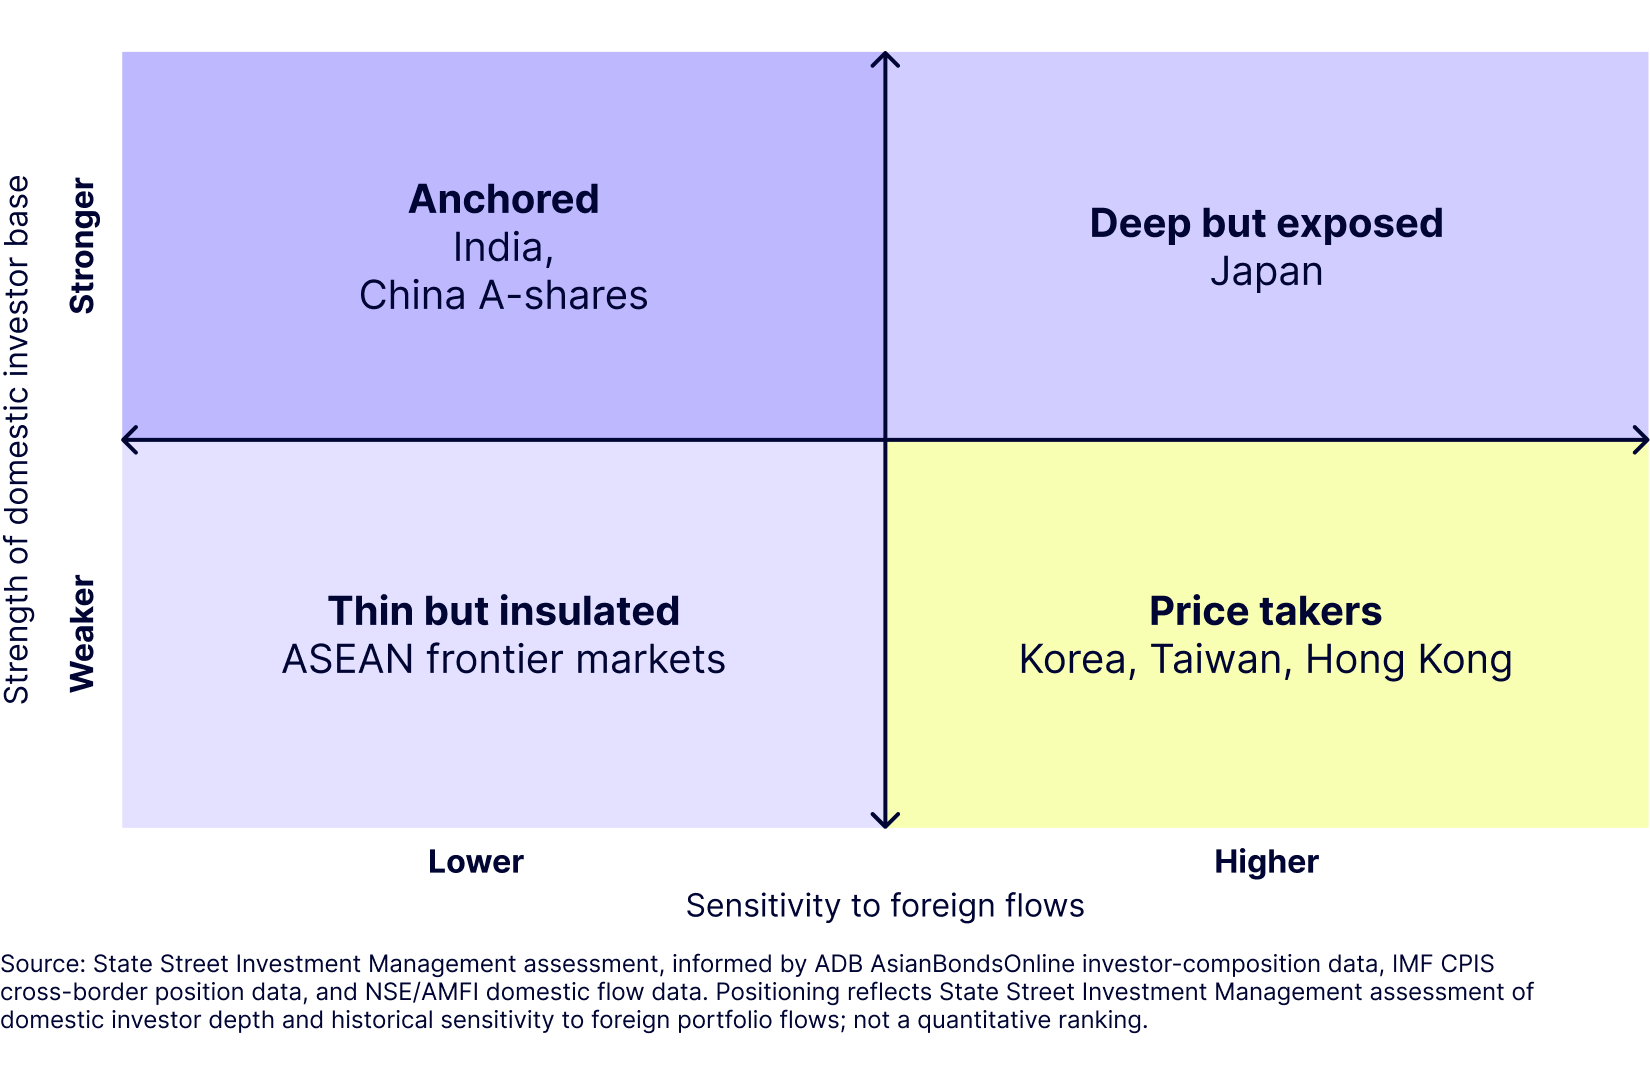
That flow has repeatedly cushioned the market through foreign selling episodes. What it has not done is decouple Indian valuations from global discount rates. A reliable domestic bid changes the shape of drawdowns — shallower troughs and faster absorption — more than it changes their trigger. Korea and Taiwan sit at the opposite end: concentrated global semiconductor exposure means foreign positioning dominates price action irrespective of the depth of local savings.
Regional integration: deeper, not closed
Depth has not produced a closed regional capital pool. As seen in the Chart of the Week, in 2024, only 21.5% of Asia-Pacific cross-border equity assets and 22.2% of debt assets were invested within the region; roughly four-fifths remained outside it. On the liability side, intraregional shares were 22% for equity and 31% for debt (IMF CPIS via ADB, as of 2024).
Large savings pools eventually need a wider opportunity set than any single domestic market can provide. Japan has demonstrated this for decades, and Korea and Taiwan now face the same pressure as pensions and insurers build overseas portfolios. Asia is becoming both more capable of financing itself and a larger supplier of capital to the rest of the world.
The dollar is the bridge between the two. More than 80% of ASEAN+3 trade invoicing remains dollar-denominated3, and the dollar was on one side of 89.2% of global foreign-exchange transactions in April 20254. The old sequence ran from foreign-currency funding withdrawal to refinancing pressure and balance-sheet stress. The new one runs from higher US rates to a stronger dollar, weaker Asian currencies, portfolio repricing and domestic absorption — painful for unhedged holders, but not disabling for the financing system.Ownership depth and flow sensitivity together produce four distinct market types rather than one regional trade.
Domestic anchors vs foreign sensitivity
What actually drives returns from here
Market structure explains volatility and absorption. It does not explain return. On that question, the honest reading of 2026 so far is that Asian equity performance has been an AI story far more than a domestic-flow story, and the two should not be confused.
The Q1 2026 dispersion makes the point. Korea returned 23.9% and Taiwan 11.0% in local-currency terms on AI hardware demand, while China fell 8.5% and Indonesia 19.2% (MSCI, FactSet via State Street Investment Management APAC Market Outlook, as of Q1 2026). That is not a regional beta; it is one global capital expenditure cycle expressing itself through the two markets most exposed to it. Asia produces around 72% of the world’s semiconductors and roughly 95% of the most advanced chips used in AI accelerators, and US hyperscalers are projected to spend USD 697 billion in 2026 and USD 873 billion in 20275. Asia is being paid for someone else’s capital cycle. Three questions follow.
- Does AI earnings leadership broaden, or narrow further? The return contribution so far sits in the hardware layer. Broadening depends on AI reaching the earnings of Asian industrials, financials and consumer names rather than only chip and equipment revenues. Until it does, Asian equity returns remain a leveraged expression of global AI capital spending, with the drawdown risk that implies.
- Does the productivity dividend reach shareholders? There are two ways to be exposed to AI, and they pay differently. Building it — selling chips, equipment and servers — is revenue growth, and it is the story above. Using it is a margin story: deploying AI inside existing operations through yield optimization, defect detection and predictive maintenance lowers unit costs without adding revenue. This second channel is how Asian industrials, autos and logistics names, rather than the chipmakers, could participate in the cycle. The capability appears to be there; Korea already runs above 1,000 robots per 10,000 manufacturing employees, roughly five times the global average, which suggests a corporate base willing to automate when the economics justify it (International Federation of Robotics). But two things must still go right. The gain must spread beyond sector leaders to the mid-tier suppliers that make up most of the regional index. And it must be retained rather than competed away, because in commoditized industries efficiency savings pass to customers as lower prices rather than to shareholders as margin. The evidence to watch is therefore reported margin expansion outside the technology hardware complex, not adoption announcements.
- Do demographics become a return driver rather than a discount? The 65-and-over share of population is close to 29% in Japan, around 17% in Korea and about 15% in China, against roughly 7% in India (UN World Population Prospects 2024 Report). Ageing markets are deploying automation against labor scarcity, which is a margin story; younger markets face an absorption question instead. Demographics will increasingly separate the markets that convert AI into earnings from those that convert it into friction.
Valuation gives this some room: Asian technology continues to trade at a price-to-earnings discount to US peers, offering the same capital cycle at a lower entry multiple. That is a different proposition from arguing Asia has decoupled.
Portfolio implications
The same market structure implies different actions depending on where an investor sits. Global allocators are usually the marginal price-setter; Asian asset owners are usually the anchor.
| For global investors | For Asian asset owners |
| Separate the duration view from the currency view. Asian local-currency debt is two trades, not one. Local duration reflects domestic inflation, central-bank policy and the strength of the resident buyer base. The currency reflects the dollar cycle and global liquidity. A market can offer attractive local duration while its currency remains vulnerable. | Diversify currency as deliberately as asset class. A portfolio can look diversified by asset class while becoming more concentrated in US duration, US technology and dollar funding. Hedge ratio, hedge tenor and the liquidity needed to maintain the hedge belong in strategic asset allocation, not in implementation. |
| Distinguish flow-driven repricing from funding deterioration. When a global shock moves Asian currencies, yields and equity valuations together, ask whether funding capacity and cash-flow expectations have weakened by the same amount. Frequently they have not, and the domestic bid that absorbs foreign selling is what creates the entry point. | Use deeper local markets for liability matching. Regional local-currency depth offers more ways to match domestic liabilities and diversify duration without automatically importing dollar risk — particularly relevant for savings-rich markets such as Japan, Korea and Taiwan. |
| Size the AI exposure deliberately. An Asia allocation built on Korea and Taiwan is a position on global AI capital spending, not on regional diversification. Know which of the two you are buying, and check it against the technology exposure already held elsewhere. | Watch the domestic earnings base, not only the domestic bid. A resident investor base cushions drawdowns but does not generate returns. The markets that reward patient domestic capital will be those where productivity gains and demographic positioning show up in earnings. |
Local fundamentals, global discount rates
Funding is increasingly domestic. Earnings are increasingly country specific. Discount rates remain global, and for now so does the dominant return driver. Gaps open between market price and domestic conditions precisely because these move at different speeds — and those gaps, rather than the ownership statistics themselves, are where the opportunity sits.
Asia may be becoming more valuable to global portfolios exactly because it is becoming less dependent on global capital — but not yet less dependent on the global cycle.
Source: Asian Development Bank (ADB), AsianBondsOnline and Asia Bond Monitor, Asian Development Bank, Asian Economic Integration Report 2025, International Monetary Fund (IMF) Coordinated Portfolio Investment Survey (CPIS), Bank for International Settlements (BIS) Triennial Central Bank Survey, National Stock Exchange of India (NSE) and Association of Mutual Funds in India (AMFI), MSCI, FactSet and Bloomberg via State Street Investment Management APAC Market Outlook, J.P. Morgan, AI tailwinds driving growth in Asia's tech sector, International Federation of Robotics, United Nations World Population Prospects 2024 via Macrobond. Data as cited; 3/31/26 unless otherwise stated.

Go beyond the headlines...
Skimmed the summary? Dive deeper with the full PDF—your go-to for weekly market insights and analysis.