What portfolio analysis of 2025 reveals about investor behavior
2025 delivered a volatile yet ultimately resilient market backdrop. Read 7 key insights on how investors allocated assets in 2025 to help guide your allocations in 2026.
Welcome to our annual look‑back at how clients allocated their portfolios. 2025 was a year that tested investor conviction but ultimately rewarded resilience. Entering the year, expectations were subdued amid renewed trade tensions, persistent geopolitical uncertainty, and lingering concerns about inflation and growth. While political and policy developments triggered bouts of volatility along the way, they proved less defining than anticipated.
Inflation continued to ease, albeit unevenly, keeping central banks cautious for much of the year. The Federal Reserve maintained a restrictive policy stance longer than expected, with the timing and pace of eventual rate cuts shifting throughout 2025. Against this backdrop, markets were increasingly driven by fundamentals such as earnings durability, fiscal support, and a gradual broadening of equity leadership beyond the United States. Despite a choppier path, global equities delivered another strong year, and diversified portfolios benefited from positive returns across most major asset classes.
To understand how investors navigated this environment, the State Street Investment Management Americas ETF Research Team analyzed more than 1,000 client portfolios across 2023, 2024, and 2025. Using our Portfolio Insights Analysis, we compared portfolio allocations over time and against strategic benchmarks, evaluating exposures across asset classes, security types, sectors, and duration to identify meaningful shifts in positioning and areas where risk may have quietly accumulated.
So, how did our clients adjust their allocations in 2025? We share seven observations from last year’s portfolio decisions that can help inform allocation choices as investors look ahead.
1. Balanced portfolios held steady, but risk appetite rose
In 2025, investor portfolios largely remained anchored to a moderate asset allocation, broadly consistent with the traditional 60/40 framework. More than half of the analyzed portfolios continued to allocate at least 60% of assets to equities, underscoring the durability of balanced portfolio construction even after a volatile multi‑year macro backdrop.
That said, portfolio composition evolved meaningfully beneath the surface. Following three consecutive years of above‑average equity returns, investors continued to tilt portfolios toward risk assets. Allocations to equity mandates rose by 5.5% compared with 2023, while exposures to fixed income and other assets declined by 4.4% and 1.2%, respectively (Figure 1).
Our take
While headline allocations suggest stability, 2025 marked a clear continuation of the re‑risking trend observed over the past two years. Investors maintained balanced portfolio structures but used tactical adjustments to express greater confidence in equities, primarily funded through reductions in fixed income allocations.
Overall, the data point to portfolios remaining grounded in long‑term strategic objectives, yet increasingly reflecting optimism around a resilient macro environment and a constructive growth outlook.
2. ETFs are still favored
Clients made their largest average portfolio allocation to exchange traded funds (ETFs) in 2025. On average, ETFs comprised approximately 64% of portfolios last year, which represents a decline compared to 2024, but still a significant tilt toward the liquid wrapper (Figure 2).
When we look into the investment mandate of funds, approximately 96% of passive exposures were implemented through ETFs. On the other hand, the average portfolio allocation for active strategies is more balanced, with mutual funds and ETFs accounting for 55% and 42%, respectively.
Our take
In 2025, ETFs were the predominant investment vehicle in our clients' portfolios, especially for passive investment strategies. This is likely because ETFs offer the benefits of inherent diversification, flexibility, greater transparency, and lower expense ratios. Indeed, ETFs’ median expense ratio is one-third lower than mutual funds’ (0.60% vs. 0.89%),1 making ETFs widely recognized as a primary vehicle for passive investing.
Despite being born as a passive investment vehicle, ETFs have positioned themselves as an attractive option for active strategies to pursue specific outcomes in a transparent, liquid, and tax efficient manner and to potentially mitigate risks and capitalize on opportunities passive strategies might miss.
3. Active management takes on a larger portfolio role
Allocation to actively managed funds has seen a significant increase to approximately 46% of portfolio allocations in 2025, which represents a 5% increase from 2024. This shift highlights a growing reliance on active strategies as investors navigated a more uneven opportunity set across markets.
Within active exposures, fixed income remained the dominant focus, accounting for roughly 48% of active allocations, while equity-focused strategies represented 39%, a notable increase from its average 32% allocation in 2023 (Figure 3).
At a more granular level, investors concentrated their active allocations in intermediate core‑plus bond strategies (33%) within fixed income and US large blend strategies (17%) within equities,2 underscoring a preference for broadly diversified core exposures where active decisions can add incremental value.
Our take
In 2025, investors continued to balance active and passive strategies, with allocation decisions increasingly driven by dispersion in outcomes across asset classes rather than broad market beta. While equity markets were supported by resilient growth and a narrowing leadership profile, fixed income markets remained shaped by uncertainty around the terminal policy rate, evolving inflation dynamics, and episodic liquidity stress.
Against this backdrop, investors expressed a clear preference for active implementation where security selection, duration positioning, and risk management could meaningfully influence outcomes. This preference was particularly evident in fixed income, where active strategies captured 40% of total fixed income ETF inflows in 2025, nearly double their 21% share of assets, highlighting their growing role in portfolio construction.3 In equities, active funds accounted for 32% of all equity ETF inflows in 2025, more than three times their 9% AUM market share.4
Performance outcomes further reinforce this preference within core bond allocations. In 2025, 57% of active core fixed income managers outperformed their benchmarks, compared with only 28% of active managers in the equity market’s core large‑blend category, underscoring the asymmetric opportunity set for active management across asset classes.5
4. The shift toward cyclicals continues
In 2025, the average portfolio continued to rotate toward cyclical sectors, increasingly at the expense of defensive exposures. From 2023 to 2025, allocations to cyclical sectors rose by approximately 6% (Figure 4), reflecting a gradual shift in risk appetite as macro conditions evolved. The largest contributor to this increase came from the technology sector, where the average allocation rose by 3.6% over the past three years, underscoring its continued influence within equity portfolios.
Despite higher absolute allocations, client portfolios remained underweight on cyclicals relative to their strategic benchmarks. As the average active weight to cyclicals improved from -2.86% in 2023 to -1.26% in 2025, the degree of underweight narrowed meaningfully signaling a more constructive stance toward economically sensitive sectors.
Our take
While investors remained cautious, continuing to overweight defensive sectors and underweight cyclicals relative to strategic benchmarks, confidence in cyclical exposure improved meaningfully in 2025. Cyclical outperformance and growing optimism around the economic outlook prompted investors to gradually reassess defensive positioning built earlier in the cycle.6 Rather than signaling a broad risk-on shift, client behavior reflects a measured recalibration, narrowing underweights to cyclicals while maintaining diversification.
The reduced underweight highlights a broader pattern across portfolios in 2025, as investors increasingly sought to participate in upside potential without fully abandoning risk discipline, with technology driving much of the cyclical exposure through its combination of growth sensitivity and structural support.
5. Revisiting the home bias
In 2025, 79% of the average portfolio’s equity allocation was invested in US stocks. Compared to a 67% average US share in the global stock market,7 this highlights a persistent home‑market bias. However, a closer look at active positioning relative to strategic benchmarks shows a modest shift away from US equities in favor of international exposures. This marks a change from 2024, when the average portfolio maintained a 1.8% overweight to US equities (Figure 5).
The most pronounced reduction in US exposure occurred within large‑cap equities, pointing to a gradual decline in concentration.
Our take
After trailing US equities for much of the past decade, international equity markets outperformed US stocks in 2025.8 While client portfolios have maintained US equity allocations close to 80% over the past three years, stronger performance in developed and emerging markets, combined with shifting macro conditions and growing concerns around US market concentration, prompted investors to reassess their geographic exposures.
The resulting reallocation led the average portfolio to reduce its US home bias by more than two percentage points, leading to higher absolute and relative allocations outside the United States. While the magnitude of these shifts remained measured, the direction of travel suggests a growing recognition of international equities as both a diversification tool and a source of differentiated return potential.
6. Portfolio duration shifts toward the front end of the curve
Reversing the trend that began in 2023, investors continued to reduce overall portfolio duration relative to their strategic benchmark, reinforcing a preference for limiting interest rate sensitivity amid an uncertain macro backdrop.
In 2025, clients increased active exposure to the short end of the curve (0-3 years) versus 2024, while widening their underweight to intermediate and longer‑duration segments (Figure 6).
Our take
Investors’ preference for the short end of the curve reflects an environment in which policy uncertainty remains high and rate volatility is asymmetric across maturities. With inflation proving sticky and the Federal Reserve navigating a narrow path between easing policy and maintaining credibility, short‑term yields remained closely anchored to policy expectations while longer‑dated yields were increasingly shaped by inflation persistence, growth uncertainty, and fiscal concerns.
In this setting, extending duration offered limited incremental yield relative to the additional interest‑rate risk. By contrast, short and ultra‑short strategies allowed investors to capture elevated front‑end yields, maintain flexibility as policy expectations evolved, and limit exposure to repricing risk further out along the curve, reinforcing the shift toward lower‑duration positioning in 2025.
7. Renewed popularity of gold and commodities
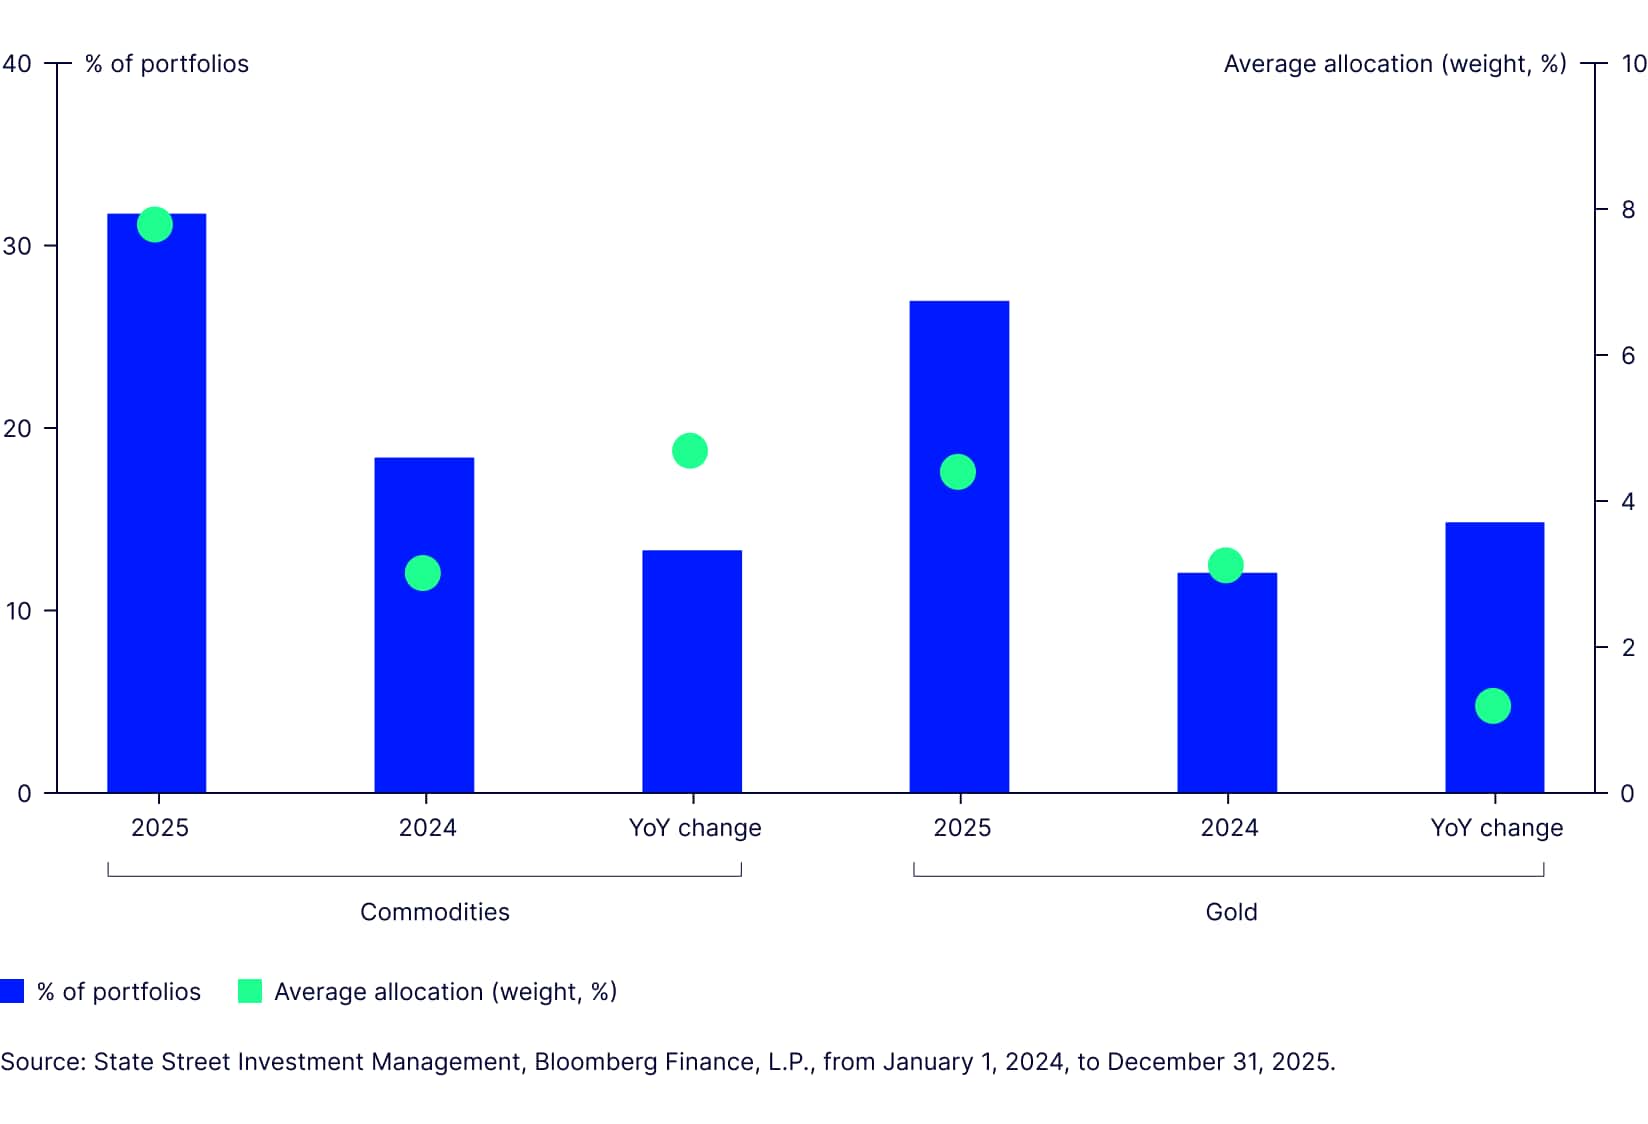
2025 was a record year for gold, with the shiny yellow metal gaining over 67% and reaching a price north of $4,360 per ounce9—marking the strongest annual performance since 1979.10 Other commodities, while tailing gold, followed, with the asset class gaining over 15%.11 The demand for commodity assets, amongst geopolitical shocks and policy uncertainty, was reflected in the portfolios. Physically backed gold products were held by 27% of the analyzed portfolios, while 32% were exposed to commodities overall (Figure 7). This shows a significant increase against previous years, when just 12% held gold-related products in 2024 and 16% in 2023.
Additionally, of those portfolios holding commodity products, the average allocation increased to nearly 8% in 2025, more than doubling the previous amounts of 3.1% and 3.8% in 2024 and 2023, respectively. More than half of the exposure came from gold products, averaging a 4.5% allocation.
Figure 7: Gold and commodities regained a place in portfolios
Our take
The sharp increase in allocations to gold and commodities reflects investors’ response to a year marked by heightened geopolitical risk, policy uncertainty, and diminished diversification benefits across traditional asset classes. Many of these risks remain in place and, while uncertainty persists, the conditions supporting gold continued into 2026. Sustained demand for gold ETFs, resilient physical buying, and elevated fiscal and geopolitical pressures have reinforced gold’s role as a portfolio diversifier.
Inflationary pressures have also re‑emerged, reinforcing the potential value of commodities as both hedging and tactical tools. As a result, gold and other commodities are likely to continue playing an important role in portfolio construction.
How to tackle the challenges ahead
Markets have experienced significant volatility so far in 2026, driven by ongoing geopolitical tensions, shifting trade dynamics, and heightened policy uncertainty. Investors continue to contend with uneven global growth, lingering inflation pressures, and an evolving monetary policy outlook, all against a backdrop of fragile confidence and episodic market stress. Together, these forces have contributed to a more complex and less predictable investment environment.
That’s where we believe portfolio analysis can help investors unveil blind spots in their allocation decisions.
The State Street Investment Management Americas ETF Research Team’s Portfolio Insights Analysis can help guide allocation decisions to reduce the chance of taking on unintended risk or missing key opportunities in an uncertain market.
To learn more about our Portfolio Insights Analysis, please reach out to your State Street representative. And visit Market Trends for our latest insights, ETF flows data, Chart Pack, and more.