What makes the Bloomberg Enhanced Roll Yield Index (BERY) different?
BERY’s systematic approach enhances roll yields and reduces costs associated with rolling over futures contracts. Read more about how it compares to other commodities indices and how it helps with portfolio diversification.
With contributions on BERY from:
Jigna Gibb
Head of Commodities and Crypto Index Product, Bloomberg
Jim Wiederhold
Commodity Indices Product Manager, Bloomberg
During the market turmoil of 2022—when both fixed income and equities suffered double-digit losses amid elevated inflation—commodities were one of the few asset classes with positive returns.
While commodities have always provided exposure to the economic cycle, their low correlation to other asset classes can increase the diversification of a portfolio in an effort to reduce risk. The correlation of the Bloomberg Commodity Index (BCOM) with equities and fixed income has ranged from low to moderate over the past two decades (Figure 1).
Commodities also can serve as an inflation hedge. During periods of high inflation, broad commodities have delivered strong performance (Figure 2) when physical markets remained in tight supply for prolonged periods of time.
Figure 2: Commodities have historically performed well with higher inflation

How does the Bloomberg Enhanced Roll Yield (BERY) Index provide exposure to commodities?
Introduced in 2021, the Bloomberg Enhanced Roll Yield Index (BERY) measures the performance of a diversified, liquid, and cost-effective long exposure to the broad commodities market through synthetic positions in futures contracts. No single commodity or sector dominates the Index. These index characteristics are similar to BCOM’s design.
But to maintain long positions, commodity benchmarks need to sell contracts that will expire soon, while buying longer-dated contracts. This process tends to accrue negative roll yields, as longer-dated contract prices tend to be higher than short-dated contracts (contango), diminishing their return potential over the long run (Figure 3).
Bloomberg developed BERY to take a systematic approach to enhance roll yields and reduce costs associated with rolling over futures contracts. BERY tilts toward commodities trading in backwardation (a downward sloping futures curve) and uses multiple contracts along the curve for each commodity to diversify curve exposures.
And BERY’s approach has captured the carry and curve premium over 20 years of the pre-inception period, outperforming BCOM by 6% per year (Figure 3).
BERY’s key features
- Enhanced roll yield: Provides greater exposure to commodities trading in backwardation to reduce negative roll yields generated during the rolling process
- Diversification across commodities: Reduces concentration to any particular commodity by capping single commodities exposure (e.g., natural gas, silver) at 15% and commodity groups (e.g., energy, precious metals) at 33%
- Diversification along the curve: Equally allocates to three to four futures contracts where liquidity is deepest for each commodity to reduce roll congestion
- Liquidity: Weights commodities by the US dollar trading volume of commodity futures to address investment capacity concerns
- Continuity: Annually rebalances to target commodity weights, which are based on three-year averages of commodity liquidity and futures curve slope, to keep the index responding to changing commodity markets without dramatic shifts in index composition year to year
Dive deeper: How are BERY’s annual target commodity weights calculated?
BERY’s commodity target weights are calculated by factoring commodity liquidity and the degree of futures curve backwardation (Slope Score) with diversification capping. The commodity with higher liquidity and Slope Score is given greater target weight to potentially reduce rolling costs while still offering high capacity.
- Commodity liquidity is measured by commodity liquidity percentage (CLP), which is determined by each commodity’s three-year average daily trading volumes as a portion of the total trading volumes for all the commodities. The commodity liquidity percentages are then adjusted to meet diversification capping rules.
- The Slope Score is the three-year daily average shape of the forward curve from nearby to 1 year ahead. The commodity with the highest degree of backwardation is given the highest Slope Score.
How does BERY’s design compare with other broad commodities indices?
BERY differs from the first generation of broad commodities indices like BCOM and S&P GSCI in two important ways:
- Calculation of annual target weights: The target commodity weights in BERY are decided by both liquidity and the shape of the futures curve, while BCOM’s target weights don’t consider the shape of the futures curve, potentially resulting in greater exposure to commodities trading in contango. For example, natural gas’ futures curve has been in steep contango and thus under-allocated in BERY relative to BCOM. The opposite is true for brent crude oil and heating oil. On the other hand, the S&P GSCI Index is a production-weighted benchmark without any diversification constraint, leading to an Energy concentration of more than 50% of the total index weight (Figure 4).
- Futures contract selection: BERY equally allocates the first three or four futures contracts for each commodity, while BCOM and S&P GSCI each use a single front contract. The three or four futures contracts are rolled into a new set and rebalanced to equal weight every month. BERY’s multiple contract positions along the curve may help harvest curve premium while mitigating volatility during periods of supply/demand shocks.
There are other enhanced roll yield indices in the market, like Bloomberg Roll Select Commodity Index (BCOMRS) and S&P GSCI Dynamic Roll Index, which seek to reduce rolling costs by selecting a single futures contract showing the most backwardation or least contango on a monthly basis, while using the same annual target weights as their parent indices.
In contrast, BERY considers the futures curve shape of each commodity (using Slope Score) when calculating the annual target weight. Moreover, BERY’s allocation to multiple contracts where liquidity is the deepest has resulted in lower volatility than BCOMRS (Figure 6).
What contributes to BERY’s performance?
As a long-only investment in commodities, BERY’s primary return driver is BCOM spot returns. But the curve and carry components contribute significantly to the outperformance over BCOM.
Since its launch, BERY has outperformed BCOM by 2.40% per year. Of that performance, 60-70% can be attributed to the futures selection (curve premium) and 30-40% comes from tilting toward commodities trading in backwardation (carry premium), with the wider universe contributing a marginal difference (Figure 5). These return profiles are consistent over the pre-inception and live performance periods.
Figure 5: BERY’s relative performance attribution compared to BCOM

BERY also has exhibited a stable return profile, with better risk-adjusted return and lower volatility than BCOM. Furthermore, BERY’s reduced drawdowns have shown defensive attributes over BCOM and the heavily energy weighted S&P GSCI (Figure 6).
Figure 6: Performance of BERY and other major commodities indices since BERY’s inception
| Bloomberg Enhanced Roll Yield Index | Bloomberg Commodity Index | Bloomberg Roll Select Commodity Index | S&P GSCI Index | |
| Ann return (%) | 9.76 | 7.21 | 7.24 | 9.54 |
| Ann volatility (%) | 11.76 | 13.24 | 12.49 | 16.40 |
| Sharpe Ratio | 0.41 | 0.22 | 0.24 | 0.28 |
| Max drawdown (%) | -16.09 | -22.48 | -22.19 | -24.11 |
Source: Bloomberg Finance, L.P., as of December 31, 2025. Since the first full month of BERY performance. Data from June 30, 2021 to December 31, 2025. The performance data quoted represents past performance. Past performance does not guarantee future results.
How has BERY performed relative to BCOM and BCOMRS?
While BERY has delivered positive carry premium for most of the time over the past 20+ years, there have been periods of negative carry premium (Figure 5) when deferred contracts have not rallied as strongly as the nearby contract. This often happens in commodity rebound periods following market stress events, such as the burst of the Dotcom bubble in the early 2000s, the Global Financial Crisis in 2008/09, China’s economy slowdown in 2013, and the COVID Pandemic in 2020. During these periods, commodity performance was driven by a sharp rebound in spot prices where BERY was underweight relative to BCOM.
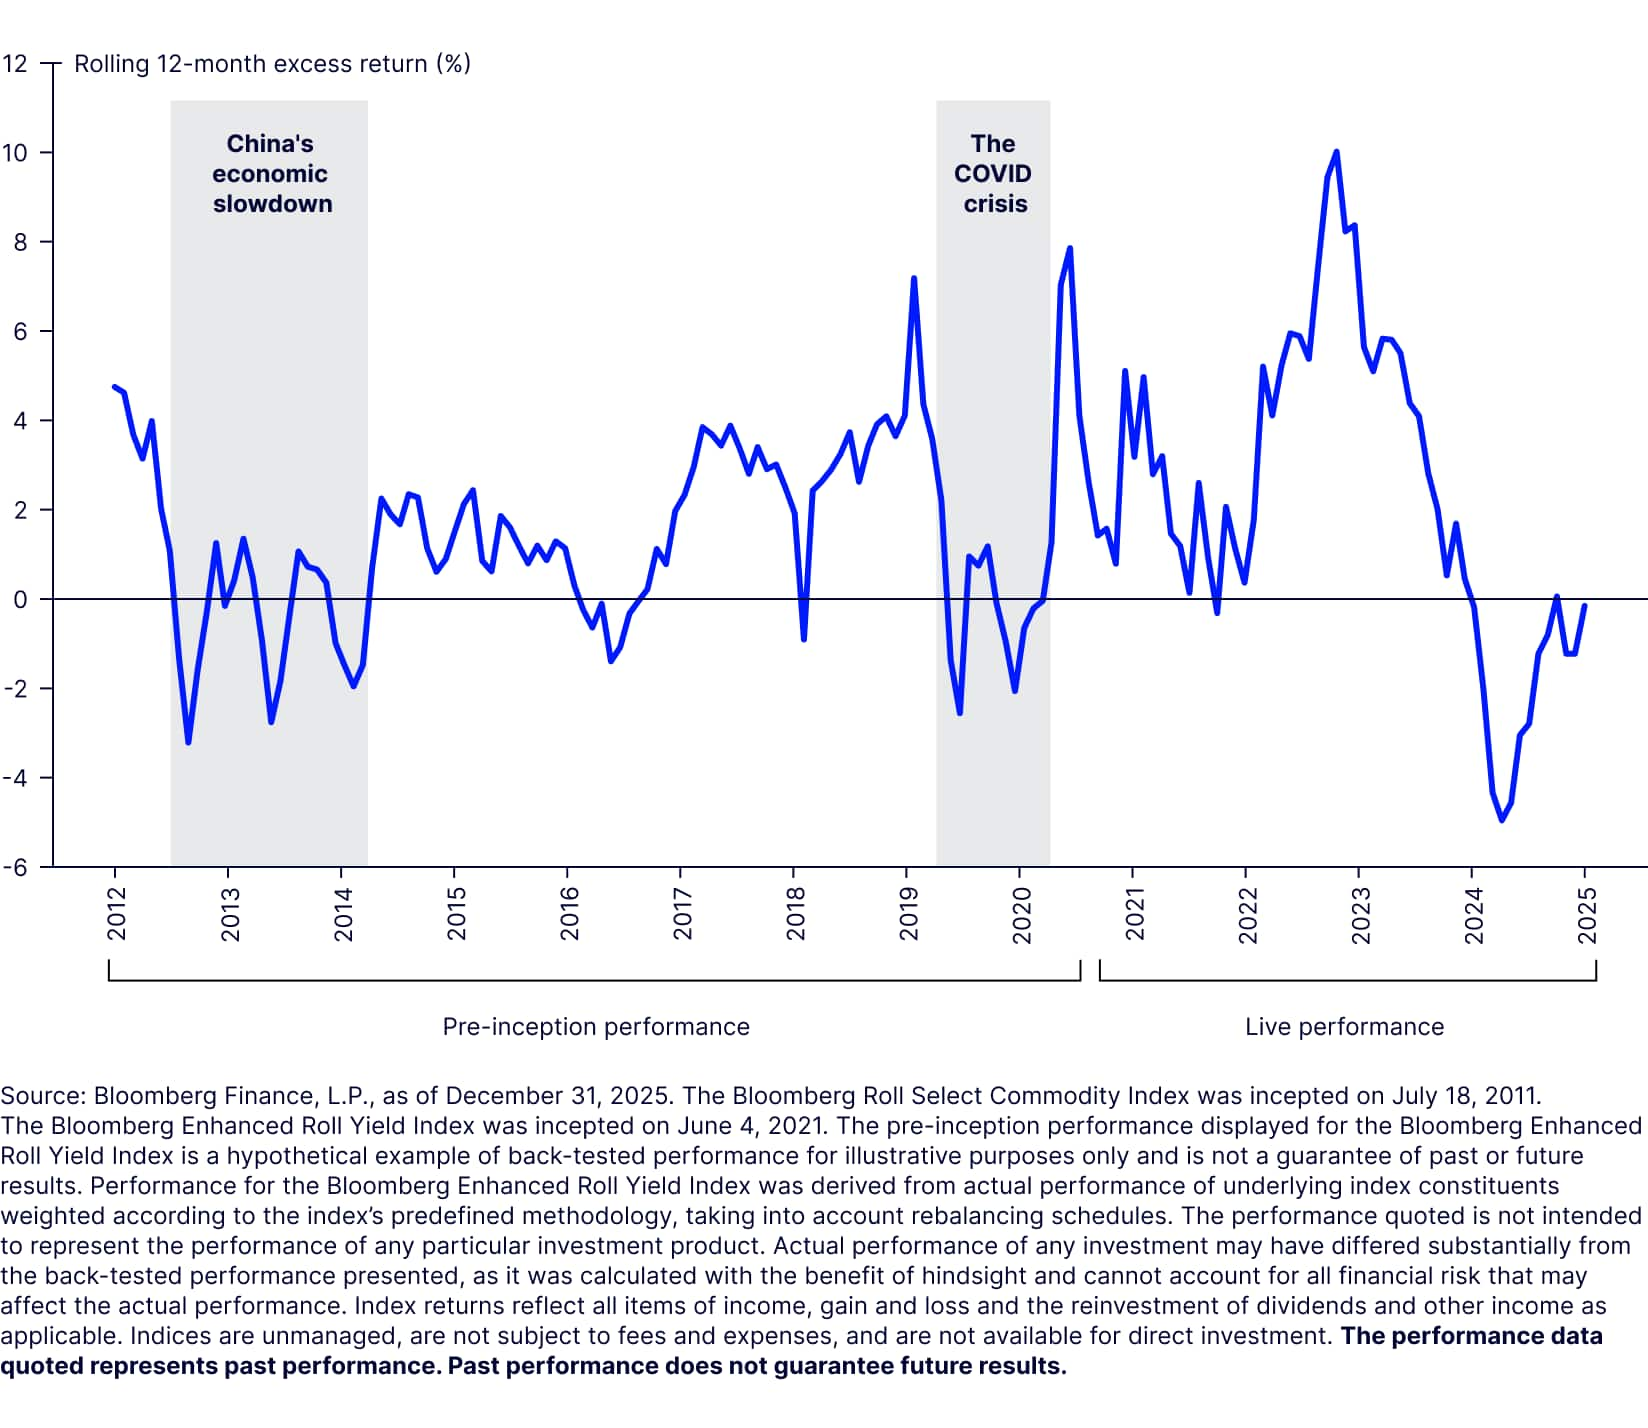
BERY has outperformed BCOMRS 74% of the time on a rolling 12-month basis thanks to additional curve and carry premia being captured (Figure 7). Nevertheless, during sharp commodity market corrections, such as China’s economic slowdown in 2013, and the COVID Pandemic in 2020, BERY underperformed due to the dual impact of (i) futures curve positioning and (ii) tilting toward commodities historically trading in backwardation.
BERY allocates to the front four futures contracts while BCOMRS positions in a single contract up to nine months deferred. In the event of sudden declines in commodity prices, the front contracts react much more aggressively than deferred positions do. In addition, these shock events trigger futures curve rotations away from backwardation into contango, which can adversely impact performance. This pro-cyclical characteristic is a consistent feature of the carry premia.
Figure 7: BERY has outperformed BCOMRS: rolling 12-month excess returns
Consider CERY: An enhanced roll yield broad commodity ETF
The SPDR® Bloomberg Enhanced Roll Yield Commodity Strategy No K-1 ETF (CERY) seeks to track the Bloomberg Enhanced Roll Yield Total Return Index. Given the index’s unique design, CERY may potentially reduce the costs associated with rolling over commodity futures contracts, while providing the potential diversification and inflation-hedging benefits of commodities to core portfolios.
Investors seeking to improve diversification and mitigate inflation risks can consider CERY as part of their strategic allocation to real assets.
Appendix: Broad commodities index comparison
| BCOM | BCOMRS | BERY | S&P GSCI | |
|---|---|---|---|---|
| Rebalance | Annual January roll period (6th to 10th business day) | Annual January roll Period (6th to 10th business day) | Annual January roll period (1th to 10th business day) | Annual January roll period (5th to 9th business day) |
| Commodity liquidity percentages (CLP) | 5-year average dollar value traded (To ensure that uncharacteristic trading years do not distort the CLP) Continuity approach | 5-year average dollar value traded (To ensure that uncharacteristic trading years do not distort the CLP) Continuity approach | 3-year average dollar value traded (To ensure that uncharacteristic trading years do not distort the CLP) Reactive approach | N/A |
| Commodity production percentages (CPP) | 5-year average production, adjusted by USD | 5-year average production, adjusted by USD | N/A | 5-year average production, adjusted by USD |
| Target weights | 2/3 liquidity 1/3 world production | 2/3 liquidity 1/3 world | Liquidity percentages and Slope Scores | 100% world production |
| Composition | 27 commodity future contracts tested, 25 are currently in index. (BISL determines commodities tested) Sufficiently significant to the world economy to merit consideration | 27 commodity future contracts tested, 25 are currently in index. (BISL determines commodities tested) Sufficiently significant to the world economy to merit consideration | 26 commodity future contracts (BISL determines commodities included) Sufficiently significant to the world economy to merit consideration | 24 commodity future contracts |
| Tenor rebalance | N/A | N/A | Monthly (equal weighted) | N/A |
| Roll period | 6th to 10th business day | 6th to 10th business day | 1st to 10th business day | 5th to 9th business day |
| Contract calendar | Pre-defined: 1 futures contract per commodity. (Energy and Metals roll every other month to the third contract out) | Monthly contract selection choosing the most backwardation contracts within nine months (where liquidity is present) | Pre-defined: 3 to 4 futures contracts per commodity | Pre-defined front month contracts |