Making Sense of the Market’s April Nonsense
With significant uncertainty arising from the Trump administration’s tariff policy proposals and reversals, two dynamics drove market trends and investor sentiment in April.
First, markets rapidly re-priced growth and inflation. Growth was revised down and near-term US inflation was revised up. Second, investors derisked away from most assets in favor of cash.
These shifts have impacted all assets, leaving portfolios unbalanced and vulnerable in an emerging new world economic order.
Prior to April, Growth-biased Assets Lagged
Even before Liberation Day on April 2, the Federal Reserve (Fed) had been forecasting a reduction in growth and a rise in inflation.1
Also, the University of Michigan survey had reported rising expectations for a spike in inflation and greater concerns over the labor market. Job separation readings reached their worst since 2020, personal spending expectations dropped by the most since 2021, and the outlook for personal finances hit a record low.2
The downbeat consumer report coincided with US factory activity contracting for the first time this year. The Institute of Supply Management’s manufacturing index declined to 49 (readings below 50 indicate a contraction).3 Consistent with other inflation trends, the group’s price measure increased to its highest level since June 2022. And over the past two months, the gauge increased 14.5 points, the most over comparable periods in the past four years.4
In Q1, before tariffs, assets reacted to these shifts in growth and inflation expectations. Rising-growth assets like equities fell, whereas falling-growth assets, like bonds and gold, rose. Assets that are sensitive to rising inflation (especially those with a negative growth bias) had the strongest returns (Figure 1).
Q1 returns trends likely were viewed as expected reactions to shifts in the economy. But the volatile returns throughout April illustrate a market environment impacted by unpredictable and undefined mercantilist global economic policies. Trends fueling volatility and the demand for liquidity/cash led to losses across most assets, widening risk premiums (Figure 2).
Falling-growth and Rising-inflation Assets Have Been More Resilient
In the wake of growth and inflation forecasts being heavily revised, it’s worth highlighting how assets have different biases toward growth and inflation dynamics. Equities, for example, have a strong bias to rising growth dynamics, and they are now selling off more than nominal bonds, an asset class with a strong bias to falling growth. If there’s a surge in inflation expectations, inflation-linked bonds, gold, and commodities may respond favorably given their positive bias to rising inflation trends.
Mapping these major asset classes to the four quadrants of rising growth, falling growth, rising inflation, and falling inflation shows that all four boxes have experienced either minor gains or outright losses since the start of April, as risk premiums widened (Figure 3).
Yet, falling-growth and rising-inflation assets, with their already-lowered growth and inflation expectations, recorded the more resilient returns — both prior to and after Liberation Day.
This return attribution exercise helps illustrate how April’s sell-off is more about the uncertainty surrounding growth and inflation, rather than their direction. Meanwhile, the year-to-date trends reflect the broader growth and inflation repricing that’s gone on all year and is likely to accelerate.
Investors Are Most Vulnerable to Shifts in Growth
Despite prevailing trends, investors aren’t positioned for weakness in growth and US equity underperformance versus other assets — in fact, they are overexposed to US equities relative to the rest of the world.
Certainly the mix of all US-listed ETFs is heavily equity concentrated and dominated by US equities (Figure 4).
If this group was an “ETF portfolio,” it would be “rising growth biased” and ill-suited for today’s mercantilist macro policy environment. Unbalanced across assets, geographies, or economic regimes, this portfolio would have been built for a world with greater global cooperation, a less constrained Fed, heavy foreign capital flow into the US — and US equity dominance in terms of returns, profits, and productivity. Those trends are unlikely to persist in this new reality.
In fact, this ETF Portfolio is down on the year and endured a double-digit drawdown in April — a return profile worse than the growth-biased 60/40 portfolio.5
Charting the Direction From Here Gets Cloudy
While the final state of tariffs remains ambiguous (e.g., lower than proposed, more days added to the pause, or more specific levies to sectors), it’s clear that we’ve moved to a world of significantly higher tariffs on all US trading partners. Perhaps this is the only certainty in an uncertain world — and a constant headwind for both US and global growth that will continue to fray investors’ nerves.
The tariffs’ knock-on effects to global economies are impossible to predict. A wide range of outcomes, including recession, stagflation, a technology-driven boom, are all on the table. Once this period of acute volatility abates, how growth and inflation expectations shift relative to what was priced in before Liberation Day is what will matter.
It's anyone’s guess what actual growth and inflation rates will be three months from now, let alone a year from now. The same goes for how the Fed will react to changes in the economic environment.
As a result, during this period of intense volatility and asymmetric outcomes, balancing portfolios across assets, geographies, and economic factors can at least spare investors from trying to predict the administration’s next policy proclamation.
For more insights check out our market trends page.

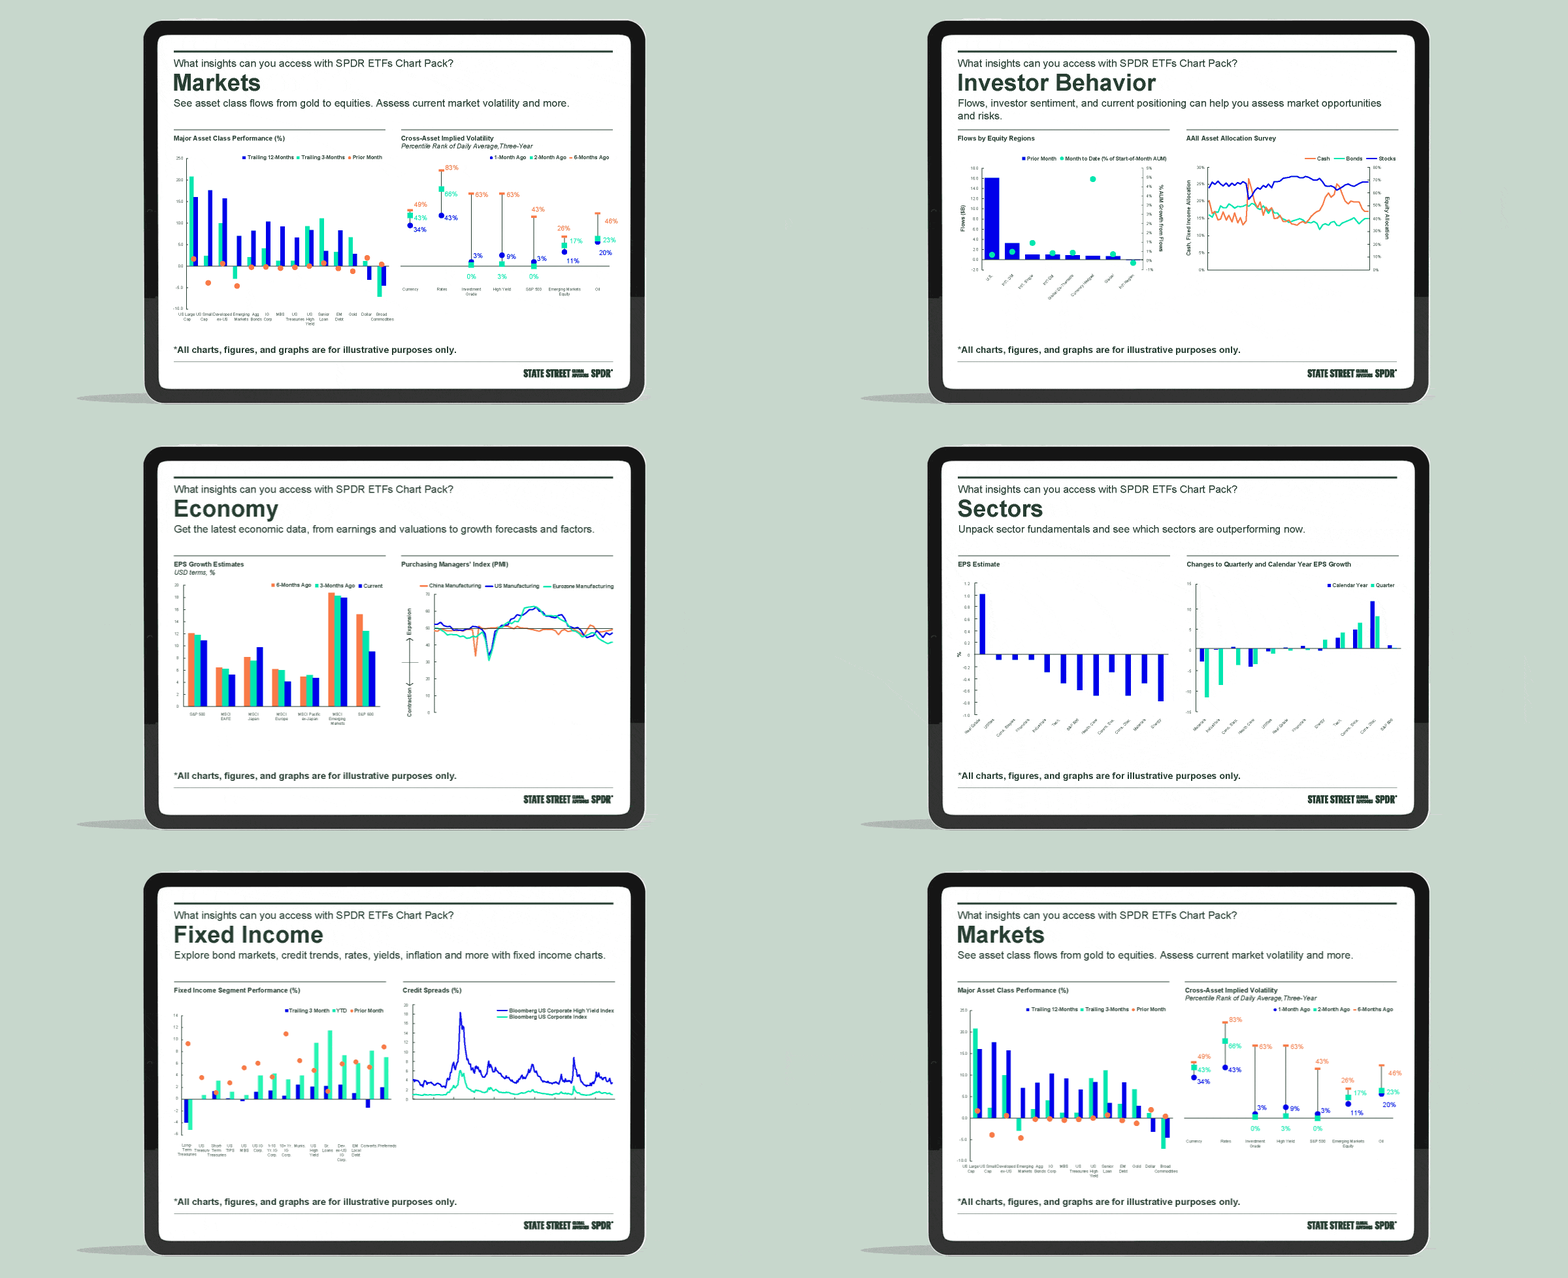
Chart Pack
An easy way to visualize the latest market movements.
