Long-Term Asset Class Forecasts for US Investors: Q3 2025
Our longer-term asset class forecasts are forward-looking estimates of total return and risk premia, generated through a combined assessment of current valuation measures, economic growth, inflation prospects, sustainability considerations, yield conditions as well as historical price patterns. We also include shorter-term return forecasts that incorporate output from our multi-factor tactical asset allocation models. Our latest forecasts are now available. Read on to learn about the process we use to arrive at our return forecasts for the major asset classes.
Inflation
The starting point for our nominal asset class return projections is an inflation forecast. We incorporate both estimates of long-term inflation and the inflation expectations implied in current bond yields. US Treasury Inflation-Protected Securities (TIPS) provide a market observation of the real yields that are available to investors. The difference between the nominal bond yield and the real bond yield at longer maturities furnishes a marketplace assessment of long-term inflation expectations.
Cash
Our long-term forecasts for global cash returns incorporate what we view as the normal real return that investors can expect to earn over time. Historically, cash investors have earned a modest premium over inflation, but we also take current and forward-looking global central bank policy rates into consideration in formulating our cash forecast.
Bonds
Our return forecasts for fixed income are derived from current yield conditions together with expectations as to how real and nominal yield curves will evolve relative to historical precedent. We then build our benchmark forecasts from discrete analysis of relevant maturities. For corporate bonds, we also analyze credit spreads and their term structures, with separate assessments of investment grade and high yield bonds. We also take into account the default probability for high yield bonds in the foreseeable future.
Equities
Our long-term equity market return forecasts combine estimates of real return potential, derived from historical and current dividend yields, forecasted real earnings growth rates, expected share issuance or buyback yield, and potential for expansion or contraction of valuation multiples. Our way of estimating real earnings growth rates incorporates forecasts of GDP levels. Across both developed and emerging markets, variations in labor, capital and productivity levels result in region-specific differences in the GDP estimates, allowing for more region-appropriate forecasts for both developed and emerging market equities.
Another important feature of our equity forecasts is that they include elements of sustainability through leveraging State Street Investment Management’s R-Factor scores. Improvements in a country’s aggregated and normalized R-Factor scores are used to incrementally reduce its risk expectations within the forecast and the other way around.
Smart Beta
Smart Beta forecasts are developed using MSCI World index forecasts as a starting point and adding expected alpha and beta adjustments as appropriate.
Private Equity
Our long-term forecast for private equity is based upon past performance patterns of private equity funds relative to listed equity markets and our extrapolation of these performance patterns on a forward basis. According to several academic studies 1,2,3 the annual rate of return of private equity funds over the long term appears to be largely in line with that of listed equities after appropriate adjustments for leverage are made. Private equity funds seem to have been outperforming relative to listed equities before fees, but generally in line with them (on a leverage-adjusted basis) after fees.
REITs
Real Estate Investment Trusts (REITs) have historically earned returns between bonds and stocks due to their stable income streams and potential for capital appreciation. Hence, we model it as a blend of two approaches. The first approach is to apply the average historical spread of the yields over Treasuries to forecast the expected return. The second approach is to account for inflation and long-term capital appreciation with the current dividend yield.
Commodities
Our long-term commodity forecast is based on our forecasts of US Inflation and the US Dollar Index. Since the exposure to commodities is primarily held through Futures markets, rolling the futures would be a source of return. For this, we use the long-term roll return along with the latest positioning of commodities futures. We also consider that collateral held for maintaining the exposure to futures shall generate a return.
Forecasts to construct multi-asset portfolios
Applied to asset allocation portfolios managed in the United States, including State Street’s Target Retirement strategies, we further factor in the expected impact of currency on risk and return over time. Figures 1 and 2 reflect the long-term asset class forecasts and correlations used to construct multi-asset portfolios for US investors.
Figure 1: Asset Class Return Forecasts for US Investors
| Asset Class | Benchmark | Long-Term Return (%) | Long-Term Risk (%) |
| US Large Cap | S&P 500 Index | 6.37 | 15.66 |
| US Small/Mid Cap | Russell Small Cap Completeness Index | 6.75 | 19.25 |
| Global Equities (ACWI) ex US | MSCI ACWI ex US Index | 7.6 | 17.8 |
| US Investment Grade Bond | BBG US Aggregate Bond | 4.44 | 5.11 |
| US Short Gov/Corporate Bond | BBG US 1-3 Year Gov/Cred Index | 3.61 | 1.71 |
| US Long Government Bond | BBG US Long Gov Bond Index | 5.74 | 14.48 |
| US High Yield Bond | BofA ICE US High Yield Constrained Index | 5.01 | 9.55 |
| US Intermediate TIPS Bond | BBG 1-10 Year TIPS Index | 3.37 | 5.31 |
| Emerging Markets Bonds | JPM EMBI Global Diversified Index | 7.39 | 9.93 |
| Global Real Estate (REITs) | FTSE EPRA NAREIT Developed Index | 6.21 | 20.34 |
| Global Private Equity | Burgiss Private Equity | 8.29 | 10.89 |
| Commodities | BBG Enhanced Roll Yield Commodity | 5.12 | 16.84 |
| Diversified Private Markets* | Custom Index | 8.27 | 10.08 |
| Core Private Credit | Burgiss Private Debt Index | 6.5 | 7.67 |
| Opportunistic Private Credit | Burgiss Distressed Private Debt Index | 11.48 | 10.42 |
| Direct Real Estate | Burgiss Real Estate Index | 7.92 | 11.09 |
*Diversified Private Markets forecast is comprised of a blend of 80% Global Private Equity, 12.5% Direct Real Estate/Real Assets, 5% Opportunistic Private Credit, 2.5% Cash
Figure 2: Asset Class Correlations
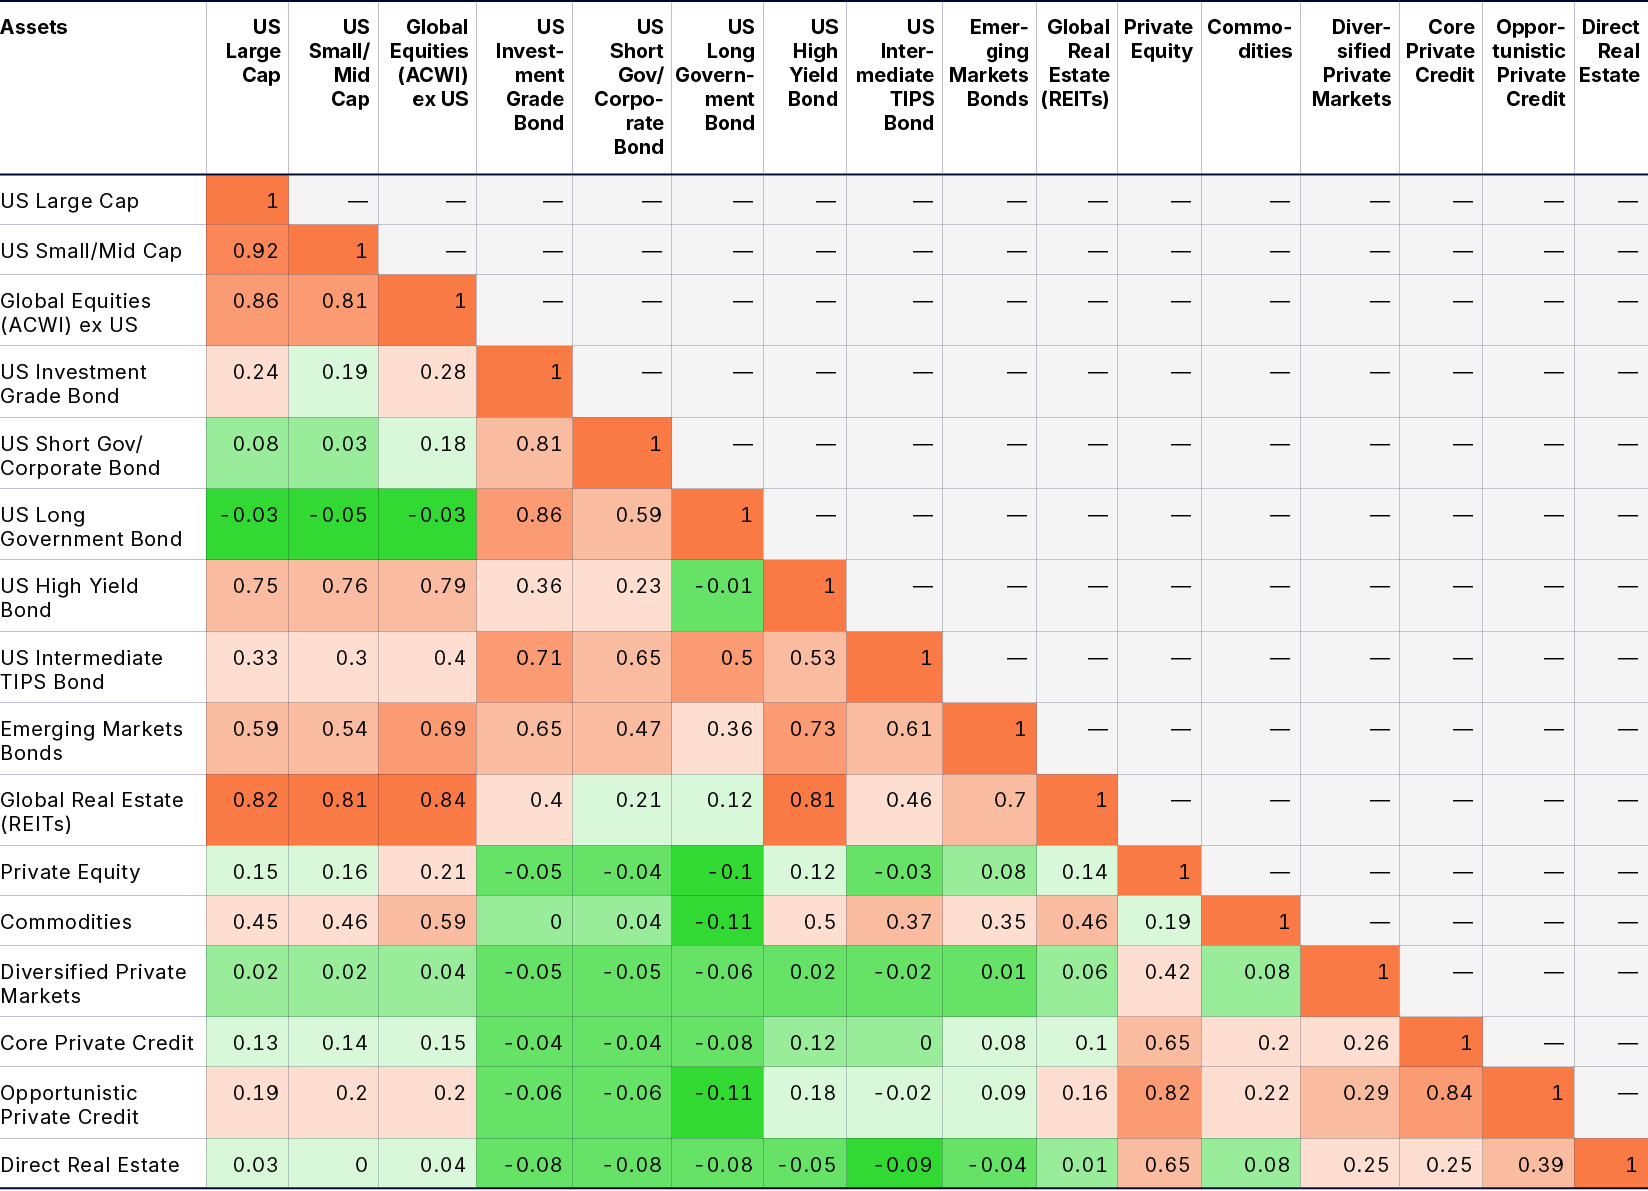
Source for Figure 1 and Figure 2: The forecasted returns are annual arithmetic averages based on State Street Investment Management Investment Solutions Group June 30, 2025 forecasted returns and long-term standard deviations. The forecasted performance data is reported on a gross of fees basis. Additional fees, such as the advisory fee, would reduce the return. For example, if an annualized gross return of 10% was achieved over a five-year period and a management fee of 1% per year was charged and deducted annually, then the resulting return would be reduced from 61% to 53%. The performance includes the reinvestment of dividends and other corporate earnings and is calculated in USD, taking into account the impact of currency on forecasted risk and return. The forecasted performance is not necessarily indicative of future performance, which could differ substantially.
Please reach out to your representative in case of any further questions on our forecasts or methodologies.
Note: Forecasts apply to the listed primary benchmarks and other asset class benchmarks as long as they are substantially similar.
Note: Private asset forecasted returns are Net of Fees, Public asset forecasted returns are Gross of Fees.
Modeling outcomes for plan participants
Using the above inputs, which we update on a quarterly basis, we are able to model expected outcomes for plan participants. While assumptions can, and often are, customized based on a variety of factors, the simplified assumptions set out below create a clean comparison of the efficacy of glidepath changes.
State Street Investment Management Standard Glidepath Assumptions
| Start Age | 21 |
| Retirement Age | 65 |
| Starting Salary | $30,000 |
| Defined Benefit | No DB plan |
| Social Security | Participants have Social Security |
| Savings Rate | 11% (Including company match) |
| Wage Growth | 2.5% p.a. |
| Life Expectancy | Based on the RP-2014 actuarial tables. Our longevity goal is to fund a 25-to-30-year retirement period. For 65-year-old men and women, life expectancy is currently estimated at 85 and 88 years, respectively. However, given the fact that many participants’ balances will be used to support both the individual and a beneficiary, we factor in a dual-life expectancy, which moves the target age to 93. |
Source: State Street Investment Management as of June 30, 2025. For illustrative purposes only. Wage data sourced from the Bureau of Labor Statistics combined with assumptions made by State Street Investment Management. Assumptions are intended to be illustrative and do not reflect an actual plan participant.