How the Fed could drive up valuations and raise caution flags
While the Fed’s eventual easing may fuel markets in the short term, valuations may suffer over the longer term.

Despite sizable macro uncertainty, broad equity markets are up so far in 2025. And the Federal Reserve (Fed) is forecast to relax its restrictive policy stance in September, potentially supporting further gains as greater liquidity and lower financing costs are ushered into capital markets.
So, while you might conclude that it’s all green lights for risk assets, no traffic light stays green forever. Green lights also don’t go straight to red. They move first to yellow—and that’s where the US equity market valuations now find themselves.
And unfortunately, while the Fed’s easing may help markets stretch that yellow light and keep everything moving in the short term, valuations may suffer over the longer term.
Caution: Negative relative earnings yield ahead
The rally that has pushed the S&P 500 to all-time highs this year has also driven up market valuations. While there are multiple metrics to examine and quantify this move, as highlighted in our chart pack, one of the more illuminating data points comes from analyzing the S&P 500 Index’s earnings yield (EY).
The EY formula is a simple inversion of the price-to-earnings ratio—the market’s earnings divided by price. By indicating the profit earned for each dollar invested, it helps you to compare stocks versus other asset classes, like bonds, that also produce cash flows.
Right now, the market’s 3.70% EY sits in the bottom 10th percentile historically—indicating stretched valuations (Figure 1).
More worrisome is how low that 3.70% EY is relative to US 3-month T-bills’ 4.22% yield.1 That is, if you can obtain a higher cash flow yield from the risk-free cash market, it means the risk-market asset is overvalued.
The differential between cash and stocks hasn’t been this negative since the peak of the dot-com bubble in the early 2000s. And there’s a strong connection between this relative yield difference and negative subsequent 10-year returns (Figure 2).
In fact, the last time the EY minus cash difference was this negative, anyone who bought US equities over the next 36 months had negative returns for the next decade.
But the Fed cutting rates should reverse this, right?
There are two ways to reverse this trend. Either the EY could rise or cash yields could fall. With the Fed likely cutting rates in September—the market projects 25 basis points (bps)2 —and at least once more for the rest of the year (the market projects a total of two cuts by the end of 2025), there’s potential for cash rates (e.g., US 3-month T-bills) to fall.3
Of course, US T-bills have already moved lower in advance of the rate cut and are trading a wider variance to the fedfunds rate than normal. This is consistent with the market previously pushing US 3-month T-bill rates lower ahead of anticipated Fed rate cuts in the autumn of 2024 (Figure 3).
Therefore, when the Fed does lower rates and the fedfunds rate collapses, the US 3-month T-bill rate likely will stay pinned because it’s moved ahead of the Fed.
But for the sake of argument, even if the Fed cuts rates by 25 bps in September and by another 25 bps again later in the year, and the EY doesn’t budge, it will still be below the 3-month T-bill yield. The variance right now is 52 bps.
All these assumptions are necessary to get rid of the negative difference. And that’s if the EY doesn’t move, which it likely will.
Connecting the dots of how the Fed may hurt valuations
If the Fed lowers rates, equities will likely rally, given the lower discount rate for future growth assumptions. And long-term bonds could fall, with the curve bull steepening (short-term rates fall faster than long-term rates). Of course, there’s a greater likelihood the curve bear steepens (short-term rates fall but long-term rates rise) as inflation remains a thorn in everyone’s side—especially long-term bond risk premiums.
Let’s say the curve bull steepens and rates fall and helps propel additional equity gains. That will put upward pressure on the denominator of the EY (i.e., price) and push the EY lower, as it’s unlikely earnings will be revised upwards in a similar fashion.
In fact, even as Fed projections have turned more dovish and Q2 earnings results were above expectations, Q3 2025 and full-year 2026 earnings forecasts have been revised lower since June (Figure 4).
If the Fed cuts 50 bps in 2025, yields on cash will fall, but not by the full 50 bps as the current gap already reflects at least one cut. Markets will likely rally in the short-term off the euphoria of rate cuts relaxing liquidity. But in the longer term, Fed rate cuts could have the following impact:
- Growth doesn’t increase at the same pace as equity gains, as downside revisions continue amid sluggish economic growth, uneven consumer sentiment, and stubborn inflation
- The EY minus cash difference doesn’t reverse, but worsens
- Long-term return forecasts for US equity markets weaken, as the EY approaches dot-com territory. This is significant because 55% of current mutual fund and ETF assets are now invested in US equities4
- The curve bear steepens, lowering equities’ growth potential as long-term financing remains high/restrictive, further damaging the EY minus cash level and long-term equity returns
While this line of thinking could turn out to be wrong, the throughline in this scenario points to seeking balance with resilient diversification solutions to help limit the adverse impacts if history repeats itself when it comes to relative earnings yield and subsequent returns.
At a time of increased uncertainty, greater concentration, and weak valuations, a balanced investment approach may help portfolios to keep stretching yellow lights.
For more insights check out our market trends page.
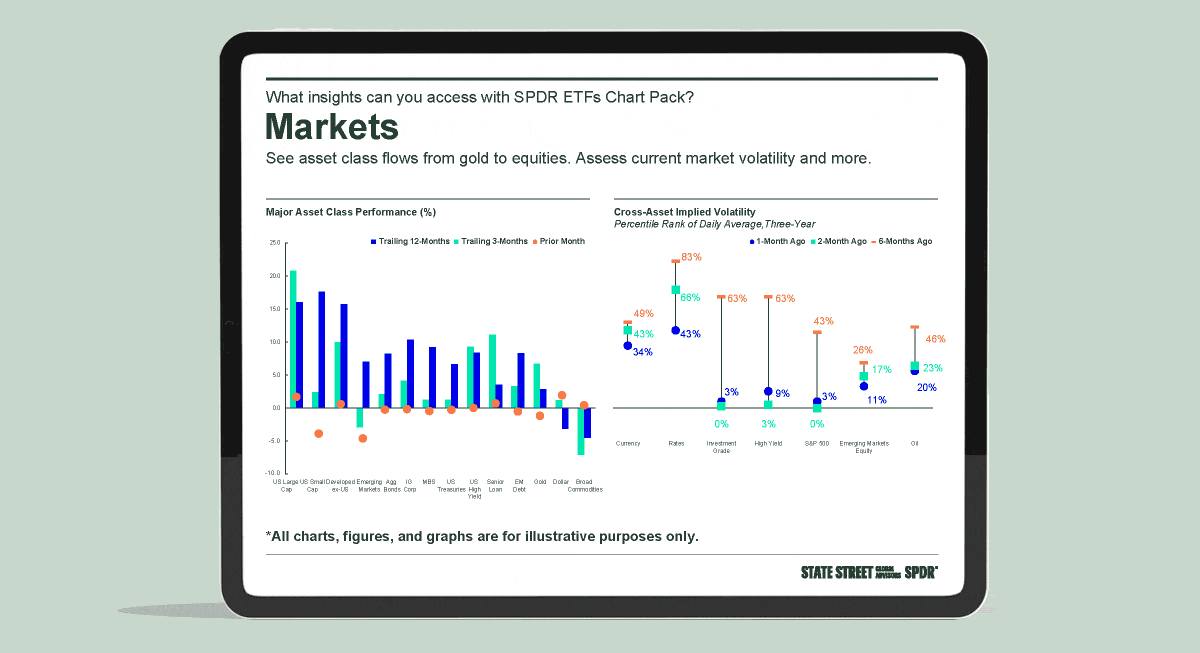
Chart Pack
An easy way to visualize the latest market movements.