Target lower costs with State Street® Select Sector SPDR® ETFs


Many investors analyze the cost of exchange traded funds (ETFs) by comparing only their expense ratios. But because ETFs can be bought and sold on an exchange like a stock and may incur trading costs, it’s important to evaluate an ETF’s total cost of ownership (TCO).
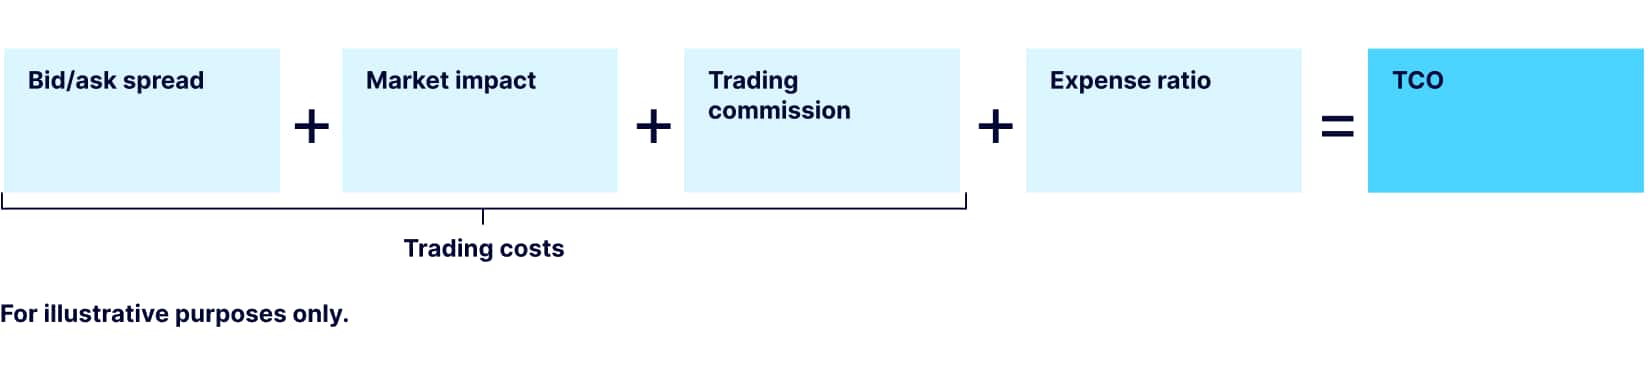
The TCO includes both holding costs (expense ratio) and trading costs (Figure 1). Importantly, a low expense ratio does not necessarily mean low trading costs, or ultimately the lowest TCO.
Depending on your rebalancing size and frequency, trading costs can accumulate and have a more significant impact on the TCO than any expense ratio difference between ETFs. While market impact may be insignificant for small trades (e.g., a notional value less than $50 million) and most brokerage firms charge $0 commissions on ETF trades, the bid/ask spread is unavoidable regardless of the trade size and can quickly add to trading costs for portfolios requiring more frequent rebalancing or high turnover.
Figure 1. Total cost of ownership breakdown
ETFs with higher average daily volumes and greater depth of market tend to have lower bid/ask spreads than funds with less liquidity. Therefore, a robust TCO analysis must be a part of any ETF due diligence process. This is especially important for investors looking to minimize total cost—particularly for those managing sector rotation strategies where higher turnover can materially increase trading expenses.
State Street® Select Sector SPDR® ETFs: Lowest TCO versus competitors1
Considering both expense ratios and trading cost profiles, the data shows that the State Street® Select Sector SPDR® ETFs stand out among their competitors with the:
- Lowest expense ratio: At 8 basis points (bps), the Select Sector SPDR® ETFs have the lowest expense ratio across all US sector suites2
- Lowest trading costs: Select Sector SPDR® ETFs on average have the tightest and most consistent bid/ask spreads through different volatility regimes across all US sector suites listed on the US stock exchanges (Figure 2) with an average trading volume 12x greater than the second-closest competitor3
- Lowest TCO: The lowest expense ratio and the lowest trading costs typically lead to the lowest TCO
How lower TCO adds up
For long-term, strategic sector exposure with low turnover, the expense ratio is a key driver of total cost of ownership. Having the lowest expense ratio, Select Sector SPDR® ETFs may offer substantial savings over a longer horizon (Figure 3).
The impact of trading costs increases with trading frequency even for commission-free, small-size trades with minimal market impact. For instance, using Select Sector SPDR® ETFs to implement a high turnover sector rotation strategy of buying a potential best-performing sector, holding it for a month, and then swapping that position with another potential best-performing sector the following month, would result in an average annual cost savings of 69 bps compared to using the second-closest competitor suite by TCO (Figure 4).
Consider Select Sector SPDR® ETFs for cost-effective, precise exposure to sectors
Buying an ETF based on its headline expense ratio alone may not lead to the most cost-efficient solution. Evaluating an ETF’s TCO involves moving beyond just the expense ratio, liquidity profile, and trading costs to analyze a combination of technical and process drivers such as strategy type, holding period, and rebalance frequency. Volatility also plays a role. In volatile markets, liquidity is vital. Investors want to be able to buy and sell securities fast, easily, and at an attractive cost across different volatility regimes.
Today, the State Street® Select Sector SPDR® ETF suite covers all 11 GICS® sectors offering a cost-effective solution with the lowest expense ratios and the tightest and most consistent bid/ask spreads4—a benefit for investors managing different types of sector strategies and seeking to lower TCO.