State Street Growth Target Retirement Series: A year in review
More than one year after launch, the State Street Growth Target Retirement Series is gaining traction with plan sponsors seeking a low-cost, diversified approach to managing longevity risk within a QDIA. Built on decades of target date expertise, the strategy combines disciplined asset allocation with a higher emphasis on growth to support participant outcomes over a full career.
State Street Investment Management has provided solutions to Defined Contribution (DC) plans around the globe for over forty years. Over this time, we have continued to refine our offerings as the marketplace and participant needs have evolved. In September 2024, we announced the expansion of our Target Retirement Platform with the creation of the State Street Growth Target Retirement Series. Since launching in October 2024, the Growth Series has resonated with plan sponsors seeking to prioritize longevity risk in a Qualified Default Investment Alternative (QDIA) through a diversified, low-cost approach.
The Growth Series is grounded in the key tenets to target date fund design we have developed over the last thirty years, namely:
- A consistent, committee-based, decision-making process
- Disciplined risk management and sub-asset class diversification
- A long-term strategic approach
- Emphasis on delivering value for fee
Our approach to target date fund design seeks to address the key risks faced by participants— accumulation, market, longevity, and inflation risks— with a diversified mix of asset classes, intentionally employed at career stages where these risks are most present.
The Growth Series seeks to further address the needs of a subset of plan sponsors with plan demographics or committee preferences requiring an emphasis on longevity risk.
Given our belief that asset allocation is the main driver of outcomes over a full career, the prioritization of longevity risk results in a glidepath with two distinctions: a larger allocation to higher-risk assets than our standard offering, and a diverse mix of 11 underlying asset classes which allow us to pursue this goal more efficiently than simply increasing our allocation to equities. Importantly, the Growth Series is constructed using passive index fund building blocks—delivering a risk profile similar to actively managed Target Date strategies at a fraction of the cost. Through the dual lens of plan sponsor demand and performance, we now review the Growth Series’ progress against the objectives we set forth at launch.
Figure 1: Asset class mix
| Fixed income | Short-term Bonds |
| Core Aggregate Bonds | |
| Long Gov’t Bonds | |
| US High Yield Bonds | |
| Emerging Market Debt (Hard Currency) | |
| Inflation sensitive | TIPS |
| Commodities | |
| REITs | |
| Equity | International Equity |
| US Small/Mid Cap Equity | |
| US Large Cap Equity |
Source: State Street Investment Management, as of December 31, 2025.
A strong foundation
As of December 31, 2025, our approach has gained traction with over $10 billion in committed assets to the Growth Series across a collection of Defined Contribution plans. Significantly, all of these mandates represent net-new clients to State Street Investment Management, highlighting the demand for a solution like the Growth Series to fit this unique segment of DC participants.
Peer-relative results offer an intriguing view into the Growth Strategies’ performance given the differing approaches in the market (Fig. 2), but in particular, against active approaches with a similar risk profile. Since inception in October 2024, the Growth Series has on average outperformed 98% of peer strategies with strong relative results achieved across each career stage of the glidepath (Fig. 3). While the market environment in which equities outpaced bonds was favorable to approaches with a higher allocation to risky assets, diversification through the use of sub-asset classes at different stages of the glidepath also proved effective.
Figure 2: Glidepath provider comparison
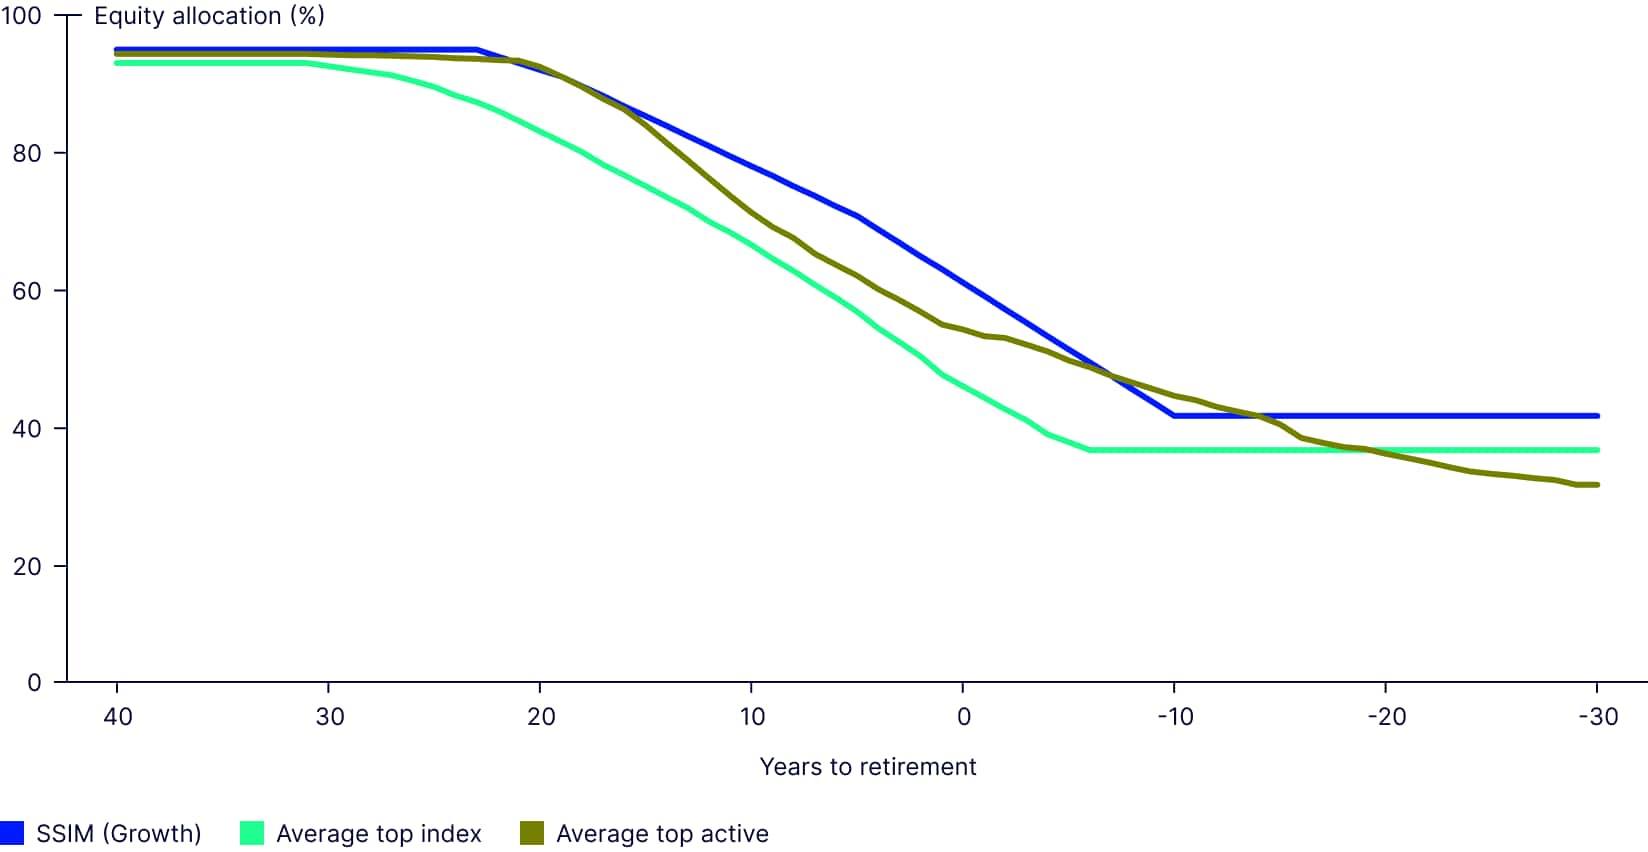
Source: State Street Investment Management Defined Contribution, March 31, 2025. Updated Annually. Competitor info sourced from fact sheets and/or prospectus. Glidepath data is typically available in 5-year increments and is linearly interpolated between vintages. The information contained above is for illustrative purposes only. Diversification does not ensure a profit or guarantee against loss. Past performance does not guarantee future results. Investing involves risk including the risk of loss of principal. Please refer to the disclosure slide for additional risk disclosures. Characteristics are as of the date indicated, are subject to change, and should not be relied upon as current thereafter.
Figure 3: Peer universe rankings
Morningstar US Peer Universe Rank (%) | Quarter Ranking | 1 Year Ranking | Since Inception Return Ranking | Since Inception Risk Ranking | Inception Date |
| State Street Growth 2065 | 40 | 13 | 4 | 46 | 10/15/2024 |
| State Street Growth 2060 | 37 | 9 | 2 | 44 | 10/15/2024 |
| State Street Growth 2055 | 34 | 9 | 2 | 37 | 10/15/2024 |
| State Street Growth 2050 | 28 | 9 | 2 | 27 | 10/15/2024 |
| State Street Growth 2045 | 26 | 9 | 6 | 36 | 10/15/2024 |
| State Street Growth 2040 | 20 | 8 | 4 | 28 | 10/15/2024 |
| State Street Growth 2035 | 5 | 1 | 1 | 9 | 10/15/2024 |
| State Street Growth 2030 | 4 | 1 | 1 | 1 | 10/15/2024 |
| State Street Growth 2025 | 7 | 7 | 1 | 33 | 10/15/2024 |
| State Street Growth 2020 | 14 | 12 | 1 | 67 | 10/15/2024 |
| State Street Growth Retirement | 17 | 5 | 3 | 62 | 10/15/2024 |
Source: Morningstar as of December 31, 2025. State Street fund performance provided by State Street Investment Management Investment Solutions Group. Morningstar Percentile Rankings are based on the average annual total returns of the funds in the category for the periods stated and do not include any sales charges or redemption fees, but do not include 12b-1 fees and the reinvestment of dividends and capital gains distributions. The highest (or most favorable) percentile rank is 1 and the lowest (or least favorable) percentile rank is 100. Rankings for each share class will vary due to different expenses. Had sales charges or redemption fees been included, total returns would be lower. On December 15, 2025, State Street Growth Target Retirement Class IV was renamed to Class III, and the net expense ratio was changed to 3.5 bps. The performance figures used to calculate peer rankings contained in Figure 1 are provided on a net of fees basis, reflecting the deduction of investment management fees (net 3.5 bps). The performance includes the reinvestment of dividends and other corporate earnings, income from securities lending activity, and is calculated in US dollars. The highest (or most favorable) percentile rank is 1 and the lowest (or least favorable) percentile rank is 100. Had sales charges or redemption fees been included, total returns would be lower. The 2070 Strategy was made available for investment on June 30, 2025. The performance data quoted represents past performance. Past performance does not guarantee future results.
For example, Emerging Markets Debt (Hard Currency), introduced in the glidepath at age 42 in tandem with US High Yield, offers an attractive risk and return profile relative to traditional equities and bonds, with potential diversification benefits to the US credit cycle. Within a multi-asset framework, these attributes can be used to improve outcomes while mitigating overall risk. Since its addition to the glidepath at the end of Q2 2025, Emerging Markets Debt (Hard Currency) has been additive to results, with outperformance relative to US Investment Grade Bonds of +481 basis points and +396 basis points relative to US High Yield.
Figure 4: Emerging Markets Hard Currency relative performance 2H25
Relative Performance (%) | US Bonds | US High Yield |
State Street EMD Hard Currency Strategy | 4.81 | 3.96 |
Source: State Street Investment Management, July 1, 2025–December 31, 2025. The performance data quoted represents past performance. Past performance does not guarantee future results.
Additionally, the Growth Series has so far produced compelling results when compared to active managers that hold similar levels of risk, but face headwinds from higher fees (relative to passive) and inconsistent performance from underlying actively managed building blocks and tactical tilts. As shown in Figure 5, the Growth Strategies have outpaced offerings from two of the largest active providers driven by our strategic focus and asset allocation decisions throughout the glidepath.
Figure 5: Growth Series since-inception performance relative to active peers
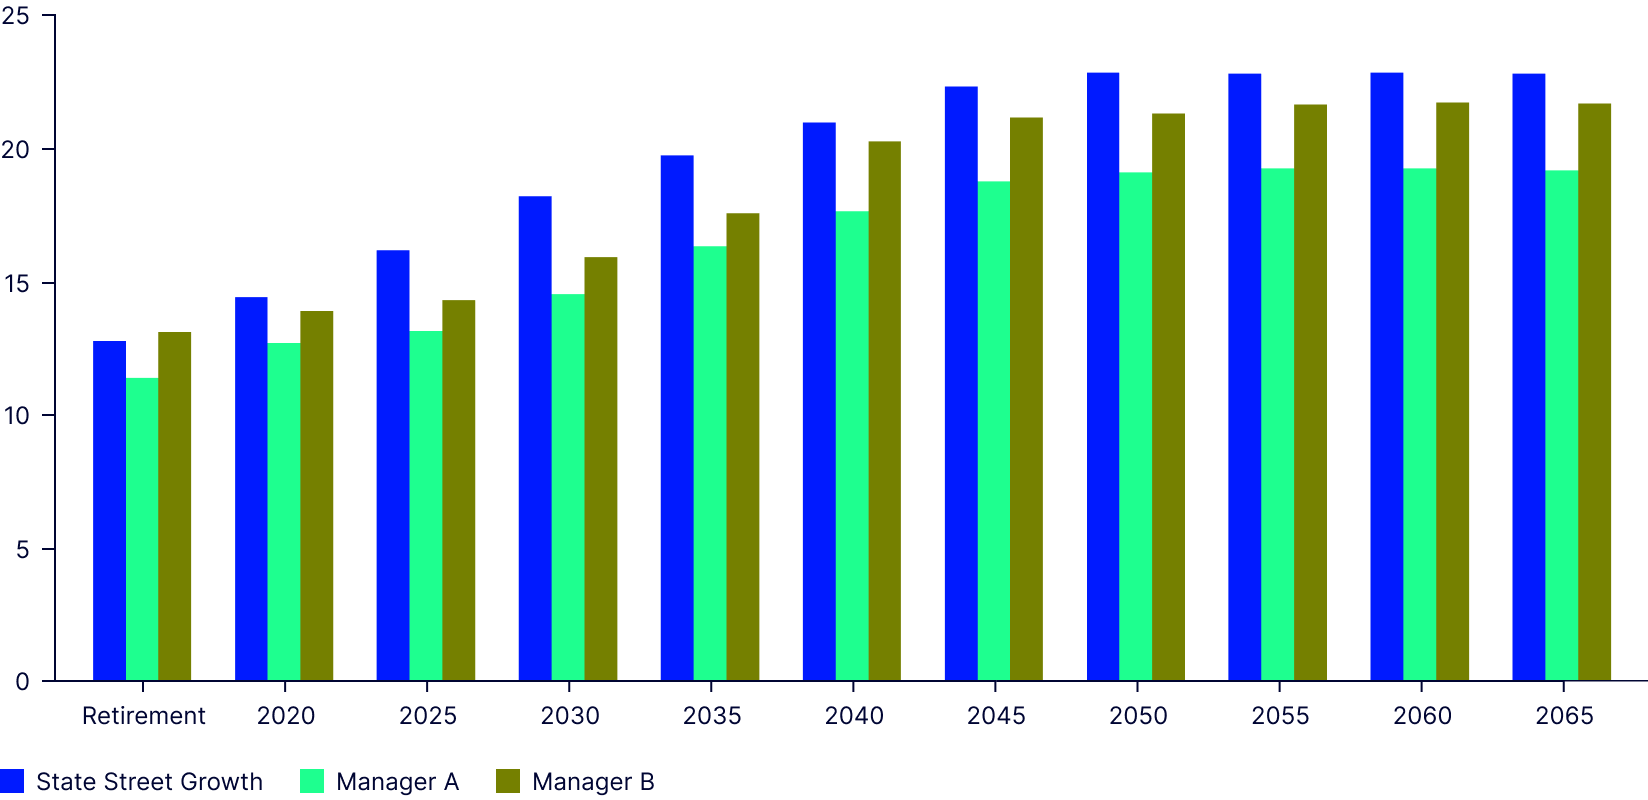
Source: State Street Investment Management, Morningstar. Performance is shown on a cumulative basis from November 1, 2024 to December 31, 2025.
Case study: The cash balance worker
The QDIA decision-making process requires navigating the increasing number of solutions available in the market. An examination of the participant population across demographic factors— such as wages (including wage growth), savings rates, and retiree withdrawal behavior, among other factors—provides important context when selecting the solution that represents the ‘best fit.’ Here, we can adopt the perspective of a hypothetical plan sponsor evaluating the QDIA-landscape.
Employees of Company XYZ generally earn more than the broader population and are longer-tenured. High participation in the open Cash Balance plan suggests the participant population has a significant source of retirement savings outside of their 401(k) savings. The investment committee is sensitive to fees and does not want to incur the added expenses and oversight required of a custom solution—fund accounting, legal, fact sheet generation, and trust/ custody fees, to name a few.
These higher salaries offer participants more stability for each percentage of contributions to the DC account, but may require higher savings at retirement to achieve sufficient income replacement. Meanwhile, the Cash Balance benefit acts as a reliable pillar to support a lengthier retirement. Taken together, these demographics point to potentially higher risk tolerance and risk capacity in the target date series. In our view, the State Street Growth Target Retirement Series is a worthy consideration through its higher emphasis on growth allocations and longevity risk, and passive implementation to maintain low costs for participants.
Improving participant outcomes over the full retirement glidepath
The State Street Growth Series represents a commingled option designed to meet the needs of plan participants traditionally served by active approaches. We are encouraged by results to date, both in terms of asset growth in the series and the performance delivered for participants.
That said, we recognize there is always work to be done to improve participant outcomes. Our approach is grounded in our mission to improve retirement outcomes—whether through improving asset allocation or offering decumulation features. We look forward to demonstrating our commitment to this objective in the years ahead to meet the needs of the ever-evolving workforce.
Target date solutions
Explore our innovative target date solutions built on decades of experience—expertise critical to making sure retirement plans evolve at the pace of participant needs.