
Building a differentiated income portfolio with sectors


Elevated rate volatility, shifting monetary policy expectations, persistent fiscal pressures, and declining equity dividend yields have made traditional income allocations less straightforward as a source of consistent portfolio income. With life expectancies rising, the challenge for advisors is no longer simply about finding yield, it’s about helping clients balance reliable income with enough capital growth to outpace inflation and support their financial goals through retirement.
That reality is prompting a broader search that requires not only diversification at the asset class level, but also new approaches to sourcing differentiated yield that can complement core bond, dividend, and equity allocations.
State Street’s® Select Sector SPDR® Premium Income ETFs (SSPI) are designed to help investors navigate this evolving income landscape by turning targeted sector equity exposures into a potential source of income. By combining sector ETFs with a systematic covered call strategy, SSPI ETFs seek to generate income from both dividends and option premiums while maintaining exposure to a portion of sector upside.
Traditional sources of income are under pressure
As companies have increasingly prioritized buybacks over dividends, cash distributions have become more constrained.1 The dividend yield of the S&P 500® has hovered around historically low levels—near 1%, while growth-oriented sectors such as Technology have offered even less income.2
At the same time, bond yields—long considered the cornerstone of income portfolios—have experienced elevated volatility in recent years3 driven by changes in monetary policy and rising fiscal deficits, making them a less stable source of income. And while dividend-focused equity strategies may offer a higher paying alternative to broad equities, yields remain in the low single-digits.4
Turning sector exposure into an income opportunity
SSPI ETFs are designed to address several of today’s income challenges by expanding how income can be generated from equities. Rather than relying solely on dividends, SSPI ETFs combine sector equity exposures with an active systematic covered call strategy that can potentially help enhance portfolio yield, reduce downside risk, and manage portfolio volatility.
SSPI's income-generating potential is rooted in a simple idea: implied volatility—a measure of the market’s expectations of how prices may move in the future—is an important driver of option premiums. Higher levels of volatility have historically translated into higher option premiums. While volatility is often viewed primarily as a source of risk, SSPI ETFs seek to convert market volatility into higher income potential through a systematic call strategy.
This approach generates income from two primary components:
- Ordinary income dividends: SSPI ETFs pass through quarterly dividends paid by the underlying State Street® Sector ETFs, providing investors with the potential for a traditional cash dividend component.
- Option premiums: By selling call options on sector ETFs the strategy seeks to collect premiums from other market participants. This has historically been the dominant source of income accounting for more than 80% of the SSPI ETFs’ dividend yield on average,5 and has reflected compensation for giving up certain upside potential associated with selling call options.
The combination of these two sources results in a different income profile compared to traditional income sources. Across the SSPI suite, average distribution yields have been in the mid-teens—meaningfully higher than traditional equity sectors, as well as many broad equity and traditional core fixed income indices, which typically offer low single-digit yields.6
Sector-level precision may offer differentiated income opportunities
One of the key differentiators of SSPI is its focus on sectors, rather than broad market indices or individual stocks.
Broad-market-based covered call strategies offer diversification but tend to capture wider overall market volatility. Because they spread exposure across all sectors, overall volatility—and therefore potential option income—can be moderated.
At the other end of the spectrum, single-stock covered call strategies may generate higher premiums due to the higher volatility of single stocks, but they introduce significant company-specific risk, which may not be suitable for investors seeking to balance income generation with capital appreciation.
SSPI sits between these two approaches. By focusing on sectors, it aims to capture differences in volatility across distinct parts of the equity market, and that sector precision may be especially relevant in today’s market where leadership, volatility, and investor sentiment vary meaningfully across industries.
For example, Energy volatility typically increases during periods of geopolitical uncertainty, potentially driving higher option premiums. And as the sector has seen higher implied volatility on the back of the US-Iran war, XLEI has offered one of the highest income levels across the 11 SSPI ETFs with a dividend yield of 20%.7
Moreover, while defensive sectors have historically exhibited more stable return patterns than cyclical sectors, underlying sector trends may reshape typical volatility patterns, potentially creating more tactical income opportunities. For example, Utilities—typically a defensive sector—has seen temporary spikes in volatility over the past year as well as an increase in average volatility levels8 as the sector’s fundamentals become increasingly driven by AI infrastructure demand.
This sector-based approach offers several advantages:
- Access to targeted volatility-driven sector income opportunities
- A more balanced approach between single-stock concentration and broad-market diversification
- Diversification across multiple sources of option premium
Balancing income and long-term growth potential
SSPI strategies are designed to generate premium income potential while maintaining the prospects for long-term capital appreciation. SSPI ETFs pursue this objective by modifying the return profile of the sector equity exposure through systematically selling call options on the underlying sector ETFs.
From a risk perspective, the inclusion of option premiums may help smooth out portfolio volatility relative to holding sector ETFs alone. Historically, these strategies have exhibited lower drawdowns and less volatility than their underlying sectors,9 with the premium collected through option selling historically acting as a partial cushion during market declines.
At the same time, SSPI maintains exposure to the underlying equity sector, allowing for participation in sector upside—albeit at a moderated level. With a beta to underlying sectors typically ~0.7,10 these strategies still aim to capture a portion of sector’s growth and potential gains.
There is, however, an important trade-off to consider. In strong sector rallies, upside will be capped due to the nature of covered call strategies. For example, as Technology has enjoyed strong gains fueled by the AI build-out, XLKI’s return since inception has underperformed its underlying sector by 11.9%.11 From an income perspective, however, XLKI has generated a 19.7% dividend yield, well above the 0.4% yield of its underlying sector.12
In this sense, SSPI does not seek to maximize price appreciation or current income. Instead, it seeks to shift part of the return profile from capital appreciation toward income generation—aiming to create a more balanced outcome between income and capital growth.
Why a delta-based option strategy matters
A key consideration in any covered call strategy is determining which call options to sell. This decision affects both the amount of potential income generated and the level of participation in market upside.
Rather than targeting a fixed yield or a fixed distance between the option strike price and the current market price (known as moneyness), SSPI targets delta. Delta is a measure of how sensitive an option’s value is to price changes in the underlying assets, which seeks to allow the strategy to adapt more effectively to changing market conditions across sectors, including shifts in volatility and price trends.
For a call option, delta is often interpreted as an approximate probability that the underlying stock price will rise above the strike price by expiration, in which case the seller of the call option will give up the price appreciation above the strike price.
For example:
- Higher-delta calls generally have a lower strike price and generate potentially higher option premiums because they are more likely to be exercised by the buyer, but they cap the seller’s upside participation at a lower level.
- Lower-delta calls generally have a higher strike price and generate potentially lower option premiums because they are less likely to be exercised by the buyer, but they allow sellers greater participation in rising markets.
Figure 4: Illustrative covered call strategy payoff
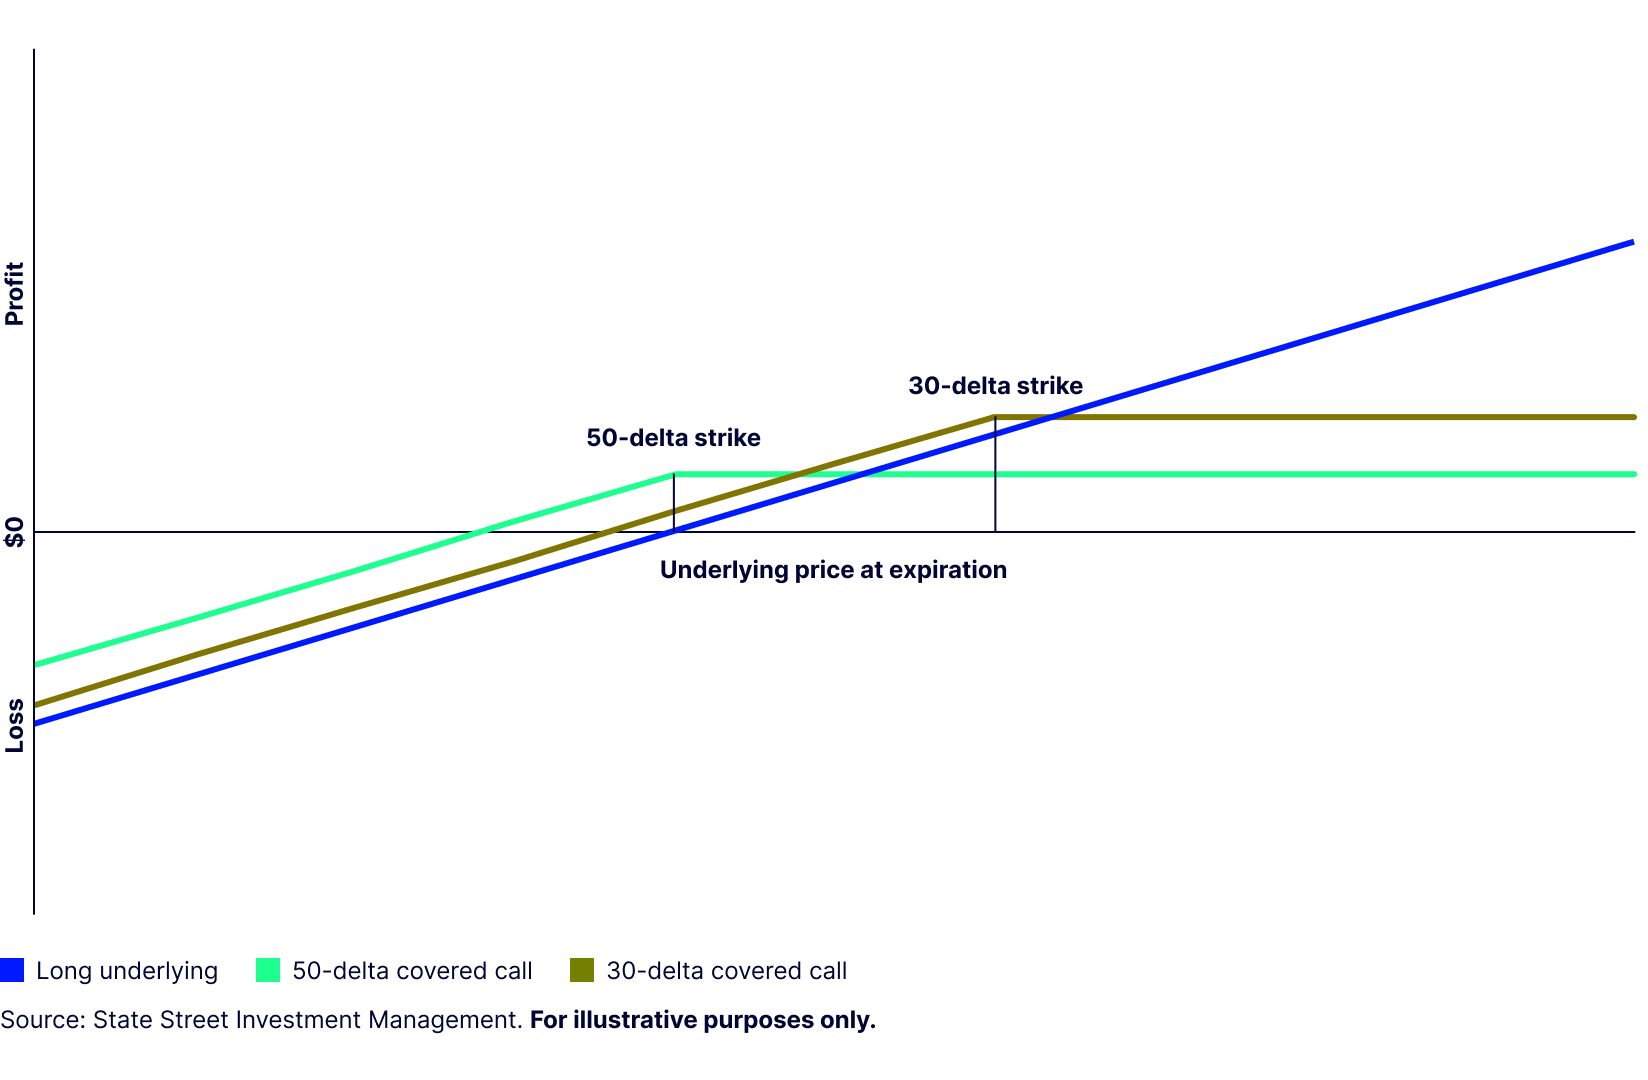
Because volatility can change over time and vary widely across sectors, fixed-moneyness or fixed-yield approaches can lead to inconsistent trade-offs between income potential and upside participation. A delta-based approach may help maintain a more consistent balance by adjusting strike selection as market conditions evolve. Through regular rebalancing, the SSPI ETFs seek to generate premium option income potential while allowing the upside cap to reset as underlying prices change, supporting a more consistent framework across sectors that aims to keep the income and upside trade-offs more disciplined across sectors and over time.
Portfolio applications for sector-based covered call strategies
Rather than serving a single purpose, SSPI ETFs can be incorporated in different ways based on investor objectives, portfolio structure, and market views.
Dialing up income within core equity allocations
SSPI ETFs can be used to potentially enhance income within an existing equity allocation by replacing a portion of traditional sector exposure with the corresponding SSPI ETF. This can be particularly useful in constructing portfolios that are equity-heavy but income-light, or in sectors where dividend yields are typically low.
For example, investors may favor the growth-oriented Technology sector to capitalize on AI-driven opportunities but also seek income to meet cash flow needs. Replacing a portion of traditional Technology exposure with State Street® Technology Select Sector SPDR® Premium Income ETF (XLKI) may help to increase portfolio income potential while retaining exposure to a portion of the sector’s upside opportunity.
Building diversified income streams
Investors can also use SSPI ETFs to build a more income-oriented equity portfolio by combining multiple SSPI funds—either in line with market weights or through active tilts. This approach allows income to be sourced from different parts of the market, rather than relying on a single driver. In aggregate, such a portfolio may deliver significantly higher income potential than traditional broad equity exposure.
For example, a dividend yield of a SSPI portfolio mirroring the S&P 500 sector weights would have been ~16%, compared to only 1% dividend yield of the S&P 500.13 And, the portfolio could still participate in the equity market upside, albeit at a moderated level, with less volatility and lower drawdowns.14
Complementing existing income strategies
For investors already using dividend strategies or broad-market-based covered call ETFs, SSPI may serve as a complementary allocation to potentially boost income further. By adding sector-based covered call exposure, investors may add differentiated income streams and flexibility in how income is generated.
Similarly, complementing a single-stock-based covered call strategy with sectors may help optimize an income strategy—accessing more targeted segments of growth relative to broad market options, while offering a more diversified alternative to options on single stocks.
Through a systematic, delta-based strategy wrapped in a single product, SSPI ETFs offer investors an efficient way to implement a covered call strategy relative to a do-it-yourself approach. For investors who might otherwise write options on single stocks or ETFs themselves, SSPI provides access to experienced active, professional management and operational simplicity, reducing complexity while maintaining access to option-based premium income potential.
Positioning for periods of elevated volatility
SSPI ETFs can also play a role in more tactical positioning. In periods where certain sectors are expected to experience higher volatility, but investors remain positive on the long-term sector fundamentals, SSPI ETFs may help investors capture volatility-driven income potential in the sector options market while staying invested in the underlying sector with reduced downside.
Take the Tech sector as an example: Tech went through a series of pullbacks due to investor concerns about AI CapEx and AI disruption risks to software companies in late 2025 and Q1 2026. While the S&P 500® Tech sector fell by 13.3% during the period, XLKI was down by merely 3.8%; largely due to the high option premiums collected during the volatile period.15
Expanding the income portfolio toolkit with sector precision
Income investing continues to evolve with investor needs and structural market shifts. As traditional sources of yield face ongoing challenges, investors are increasingly focused on building more flexible and resilient income strategies.
While traditional income strategies have been built primarily around asset classes—equities for dividends and fixed income for coupons—SSPI ETFs expand this framework by introducing a new dimension with income potential sourced from underlying sector volatility.
This creates a shift from pure asset allocation toward income source diversification. As investors build income-oriented portfolios to navigate the changing income landscape, SSPI ETFs can complement core equity and fixed income allocations, as well as existing covered call strategies—adding a new building block and differentiated source of yield potential to the investor’s portfolio construction toolkit.
Appendix
Standard performance information
| Name | Ticker | QTD (%) | YTD (%) | 1 year (%) | 3 year (%) | 5 year (%) | 10 year (%) | Since inception | Inception date | 30-day SEC yield (%) | GER* (%) |
|---|---|---|---|---|---|---|---|---|---|---|---|
| Annualized returns | |||||||||||
| State Street® Communication Services Select Sector SPDR® ETF | XLC (NAV) | -3.06 | -8.37 | 0.03 | 19.43 | 6.86 | — | 11.02 | Jun 18 2018 | 1.15 | 0.08 |
| State Street® Communication Services Select Sector SPDR® ETF | XLC (MKT) | -3.08 | -8.42 | -0.01 | 19.42 | 6.85 | — | 11.02 | — | — | — |
| State Street® Communication Services Select Sector SPDR® Premium Income ETF | XLCI (NAV) | -1.88 | -4.32 | — | — | — | — | 2.42 | Jul 29 2025 | 1.05 | 0.35 |
| State Street® Communication Services Select Sector SPDR® Premium Income ETF | XLCI (MKT) | -1.62 | -4.15 | — | — | — | — | 2.53 | — | — | — |
| State Street® Consumer Discretionary Select Sector SPDR® ETF | XLY (NAV) | 7.87 | -1.36 | 8.75 | 12.27 | 6.48 | 12.79 | 9.76 | Dec 16 1998 | 0.76 | 0.08 |
| State Street® Consumer Discretionary Select Sector SPDR® ETF | XLY (MKT) | 7.86 | -1.38 | 8.76 | 12.28 | 6.47 | 12.78 | 9.76 | — | — | — |
| State Street® Consumer Discretionary Select Sector SPDR® Premium Income ETF | XLYI (NAV) | 7.10 | 0.21 | — | — | — | — | 5.71 | Jul 29 2025 | 0.52 | 0.35 |
| State Street® Consumer Discretionary Select Sector SPDR® Premium Income ETF | XLYI (MKT) | 7.08 | 0.11 | — | — | — | — | 5.65 | — | — | — |
| State Street® Consumer Staples Select Sector SPDR® ETF | XLP (NAV) | 2.09 | 8.32 | 5.45 | 6.72 | 6.26 | 7.02 | 6.77 | Dec 16 1998 | 2.63 | 0.08 |
| State Street® Consumer Staples Select Sector SPDR® ETF | XLP (MKT) | 2.07 | 8.27 | 5.45 | 6.71 | 6.26 | 7.01 | 6.77 | — | — | — |
| State Street® Consumer Staples Select Sector SPDR® Premium Income ETF | XLSI (NAV) | 2.61 | 4.48 | — | — | — | — | 3.12 | Jul 29 2025 | 2.34 | 0.35 |
| State Street® Consumer Staples Select Sector SPDR® Premium Income ETF | XLSI (MKT) | 2.51 | 4.17 | — | — | — | — | 3.06 | — | — | — |
| State Street® Energy Select Sector SPDR® ETF | XLE (NAV) | -12.55 | 20.52 | 29.25 | 12.98 | 18.79 | 8.82 | 8.38 | Dec 16 1998 | 2.84 | 0.08 |
| State Street® Energy Select Sector SPDR® ETF | XLE (MKT) | -12.60 | 20.46 | 29.20 | 12.96 | 18.78 | 8.81 | 8.38 | — | — | — |
| State Street® Energy Select Sector SPDR® Premium Income ETF | XLEI (NAV) | -6.90 | 12.42 | — | — | — | — | 18.52 | Jul 29 2025 | 2.56 | 0.35 |
| State Street® Energy Select Sector SPDR® Premium Income ETF | XLEI (MKT) | -6.72 | 12.48 | — | — | — | — | 18.65 | — | — | — |
| State Street® Financial Select Sector SPDR® ETF | XLF (NAV) | 8.98 | -1.22 | 3.97 | 18.59 | 9.76 | 13.27 | 6.09 | Dec 16 1998 | 1.37 | 0.08 |
| State Street® Financial Select Sector SPDR® ETF | XLF (MKT) | 8.94 | -1.26 | 4.00 | 18.59 | 9.75 | 13.26 | 6.09 | — | — | — |
| State Street® Financial Select Sector SPDR® Premium Income ETF | XLFI (NAV) | 6.48 | -1.53 | — | — | — | — | 3.65 | Jul 29 2025 | 1.25 | 0.35 |
| State Street® Financial Select Sector SPDR® Premium Income ETF | XLFI (MKT) | 6.50 | -1.53 | — | — | — | — | 3.71 | — | — | — |
| State Street® Health Care Select Sector SPDR® ETF | XLV (NAV) | 8.74 | 3.41 | 19.78 | 7.92 | 6.44 | 10.09 | 8.69 | Dec 16 1998 | 1.59 | 0.08 |
| State Street® Health Care Select Sector SPDR® ETF | XLV (MKT) | 8.72 | 3.36 | 19.77 | 7.92 | 6.43 | 10.08 | 8.69 | — | — | — |
| State Street® Health Care Select Sector SPDR® Premium Income ETF | XLVI (NAV) | 8.18 | 5.02 | — | — | — | — | 18.39 | Jul 29 2025 | 1.36 | 0.35 |
| State Street® Health Care Select Sector SPDR® Premium Income ETF | XLVI (MKT) | 8.37 | 5.19 | — | — | — | — | 18.62 | — | — | — |
| State Street® Industrial Select Sector SPDR® ETF | XLI (NAV) | 14.85 | 20.12 | 27.20 | 21.71 | 14.29 | 14.65 | 9.85 | Dec 16 1998 | 0.98 | 0.08 |
| State Street® Industrial Select Sector SPDR® ETF | XLI (MKT) | 14.81 | 20.03 | 27.13 | 21.69 | 14.28 | 14.64 | 9.85 | — | — | — |
| State Street® Industrial Select Sector SPDR® Premium Income ETF | XLII (NAV) | 13.65 | 12.87 | — | — | — | — | 19.80 | Jul 29 2025 | 0.88 | 0.35 |
| State Street® Industrial Select Sector SPDR® Premium Income ETF | XLII (MKT) | 13.66 | 12.84 | — | — | — | — | 19.79 | — | — | — |
| State Street® Materials Select Sector SPDR® ETF | XLB (NAV) | 2.19 | 13.11 | 17.93 | 9.13 | 6.40 | 10.35 | 8.32 | Dec 16 1998 | 1.74 | 0.08 |
| State Street® Materials Select Sector SPDR® ETF | XLB (MKT) | 2.14 | 13.04 | 17.91 | 9.13 | 6.40 | 10.35 | 8.32 | — | — | — |
| State Street® Materials Select Sector SPDR® Premium Income ETF | XLBI (NAV) | 4.65 | 7.26 | — | — | — | — | 9.69 | Jul 29 2025 | 1.43 | 0.35 |
| State Street® Materials Select Sector SPDR® Premium Income ETF | XLBI (MKT) | 4.94 | 7.21 | — | — | — | — | 9.75 | — | — | — |
| State Street® Real Estate Select Sector SPDR® ETF | XLRE (NAV) | 8.72 | 10.78 | 9.84 | 8.96 | 3.27 | 6.31 | 7.28 | Oct 07 2015 | 3.23 | 0.08 |
| State Street® Real Estate Select Sector SPDR® ETF | XLRE (MKT) | 8.68 | 10.74 | 9.85 | 8.96 | 3.26 | 6.31 | 7.28 | — | — | — |
| State Street® Real Estate Select Sector SPDR® Premium Income ETF | XLRI (NAV) | 6.75 | 5.66 | — | — | — | — | 4.92 | Jul 29 2025 | 2.93 | 0.35 |
| State Street® Real Estate Select Sector SPDR® Premium Income ETF | XLRI (MKT) | 6.71 | 5.69 | — | — | — | — | 4.96 | — | — | — |
| State Street® Technology Select Sector SPDR® ETF | XLK (NAV) | 43.48 | 32.68 | 51.24 | 30.74 | 21.78 | 25.57 | 10.84 | Dec 16 1998 | 0.39 | 0.08 |
| State Street® Technology Select Sector SPDR® ETF | XLK (MKT) | 43.45 | 32.59 | 51.22 | 30.73 | 21.77 | 25.56 | 10.84 | — | — | — |
| State Street® Technology Select Sector SPDR® Premium Income ETF | XLKI (NAV) | 20.83 | 17.08 | — | — | — | — | 29.07 | Jul 29 2025 | 0.36 | 0.35 |
| State Street® Technology Select Sector SPDR® Premium Income ETF | XLKI (MKT) | 20.75 | 16.99 | — | — | — | — | 28.98 | — | — | — |
| S&P 500® Information Technology Index | — | 31.79 | 19.76 | 37.48 | 30.88 | 22.14 | 26.59 | 14.29 | — | — | — |
| State Street® Utilities Select Sector SPDR® ETF | XLU (NAV) | -0.56 | 7.62 | 14.09 | 14.86 | 10.76 | 9.00 | 7.87 | Dec 16 1998 | 2.67 | 0.08 |
| State Street® Utilities Select Sector SPDR® ETF | XLU (MKT) | -0.58 | 7.58 | 14.11 | 14.86 | 10.76 | 8.99 | 7.87 | — | — | — |
| State Street® Utilities Select Sector SPDR® Premium Income ETF | XLUI (NAV) | 2.12 | 9.53 | — | — | — | — | 10.32 | Jul 29 2025 | 2.40 | 0.35 |
| State Street® Utilities Select Sector SPDR® Premium Income ETF | XLUI (MKT) | 2.18 | 9.37 | — | — | — | — | 10.30 | — | — | — |
| S&P 500® Index | — | 15.20 | 10.21 | 22.32 | 20.61 | 13.41 | 15.51 | 19.06 | — | — | — |
Source: State Street Investment Management, Bloomberg Finance, L.P., as of June 30, 2026. The performance data quoted represents past performance. Past performance does not guarantee future results. Current performance may be lower or higher than the performance data quoted. Investment return and principal value will fluctuate so that the investor's shares, when redeemed, may be worth more or less than the original cost. All results are historical and assume the reinvestment of dividends and capital gains. Performance is shown net of any fees. Periods of less than one year are not annualized. The market price used to calculate the Market Value return is the midpoint between the highest bid and the lowest offer on the exchange on which the shares of the Fund are listed for trading, as of the time that the Fund's NAV is calculated. If you trade your shares at another time, your return may differ.Index returns are unmanaged and do not reflect the deduction of any fees or expenses. Index returns reflect all items of income, gain/loss, and the reinvestment of dividends and other income as applicable. Performance of an index is not illustrative of any particular investment. It is not possible to invest directly in an index. Visit www.ssga.com for most recent month-end performance. The gross expense ratio is the fund’s total annual operating expenses ratio. It is gross of any fee waivers or expense reimbursements. It can be found in the fund’s most recent prospectus. The 30-day SEC yield is an annualized yield that is calculated by dividing the investment income earned by the fund less expenses over the most recent 30-day period by the current maximum offering price that does not take into account expense ratio subsidizations.
* GER = Gross Expense Ratio