A holistic approach to managing private market allocations
Managing risk has been a primary focus for many public and Taft-Hartley plans in recent years. Volatile markets, rising inflation, and economic uneasiness have made it particularly important for these plans to consider strategies for navigating uncertainty.
As both public and private pension plans have increased their allocations to private asset classes over the last few years,1 liquidity management is becoming an increasingly important factor in their risk assessments. Plans looking to capitalize on private assets’ promise to unlock new levels of diversification and growth potential need to address these investments’ distinct liquidity restrictions.
Many plans create risk budgets to inform their investment decisions. Similarly, plans can create liquidity budgets. A liquidity budget can support a holistic perspective on liquidity management—one facet of a broader total portfolio approach that integrates considerations about factors such as risk, exposures, time horizons, and other key dimensions across the portfolio.
Incorporating private assets
Institutional investors allocating to private asset classes often encounter challenges managing their current allocations toward their long-term targets. An institutional investor typically reviews their allocation strategy every one to three years. Once the decision is made to invest in private assets, their investment policy statement might look something like the example below.
| Asset Class Group | Current Target (%) | Long-Term Target (%) | Difference (%) |
|---|---|---|---|
Liquid Growth | 70 | 60 | -10 |
Private Growth | - | 10 | +10 |
| Real Assets | 10 | 10 | - |
| Fixed Income | 20 | 20 | - |
Source: State Street Investment Management. For illustrative purposes only.
Adding 10% to a private growth allocation can take years to achieve. Throughout that time, the investor needs to manage diversification within the private asset allocations. The question then becomes how to measure portfolio performance relative to an investible benchmark. There are several ways to manage this:
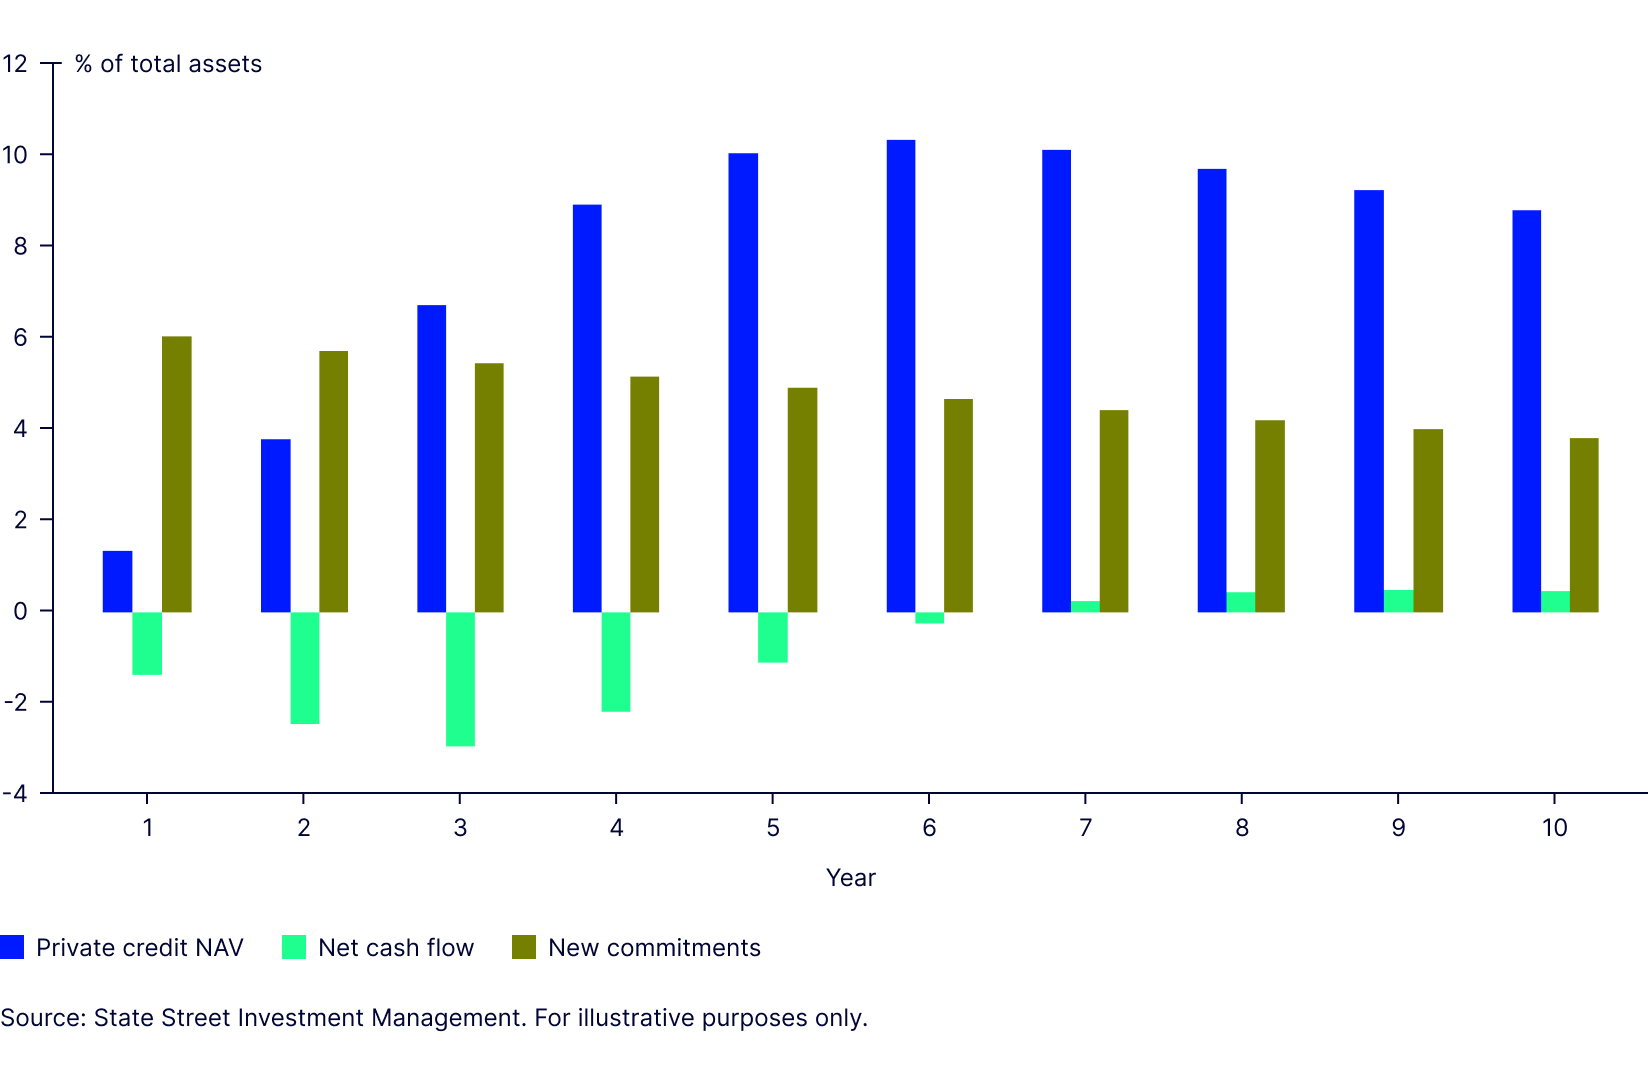
Interim benchmarks: Plans can start by carrying out a cash flow pacing analysis for the private assets. They can estimate the required commitments and corresponding net cash flows (expected capital called minus distributions) to build up an allocation of 10% of the total plan’s assets. Because of the many assumptions that go into this type of model, plans likely would want to revisit the analysis annually. The chart below (Figure 1) illustrates what such an allocation to private credit might resemble over time.
Figure 1: Cash flow pacing analysis for private credit allocation
The table below shows the investible benchmark a plan might adopt for the first year while the allocation to private assets is being built up.
| Asset Class Group | Current Target (%) | Year 1 Target (%) | Long Term Target (%) |
|---|---|---|---|
| Liquid Growth | 70 | 65 | 60 |
Private Growth | - | 5 | 10 |
Real Assets | 10 | 10 | 10 |
| Fixed Income | 20 | 20 | 20 |
| Total Assets | 100 | 100 | 100 |
Source: State Street Investment Management. For illustrative purposes only.
Split management of public and private assets: Another approach would be to create a benchmark in which publicly traded assets are managed to a public-only benchmark, and the weight of private assets floats as the allocation is gradually built over time. As
with an interim benchmark, plans may choose to revisit cash flow pacing annually to ensure it aligns with the buildup of its private market allocation.
| Asset Class Group | Current Target (%) | Actual Year 1 Allocation (%) | Public Scaled to 100% | Long Term Target (%) |
|---|---|---|---|---|
| Liquid Growth | 70 | 65 | 68.4 | 60 |
Real Assets | 10 | 10 | 10.5 | 10 |
Fixed Income | 20 | 20 | 21.1 | 20 |
| Total Public Assets | 100 | 95 | 100 | 90 |
| Private Growth | - | 5 | 10 | |
| Total Private Assets | - | 5 | 10 | |
| Total Assets | 100 | 100 | 100 |
Source: State Street Investment Management. For illustrative purposes only.
Meeting private market commitments
After a plan decides to build a private asset allocation, it must determine how best to fund its investment commitments. Private equity tends to be the most common private market allocation among institutional investors. Funding private equity from public equity is a natural choice given the abundance of liquidity held by plans in public equity allocations. Likewise, a plan might fund allocations to private and opportunistic credit out of bank loans and high yield positions, with the mix varying depending on the investments’ risk and return profile. Last, private real assets can be proxied with liquid real assets, as public and unlisted infrastructure have similar long-term returns and correlation of approximately 90%, although listed infrastructure has almost double the volatility of private infrastructure.
Investors should be aware of two other key considerations as they consider funding sources for private allocations:
- The denominator effect: Public assets tend to be more volatile than private assets, and private market valuations tend to change more slowly than public asset values. As a result, the percentage these assets make up of the overall portfolio can move around a lot in volatile markets, potentially leaving a plan overweighted to illiquid holdings
- Currency hedging: The US is a vibrant market for private assets, but there are plenty of international opportunities as well. US-based investors may want to consider currency hedging any non-USD exposure. For non-US investors, currency hedging is a critical way to offset the high currency risk that accompanies private market investments.
The bottom line
Private asset allocations, whether to real assets, equity, or credit, provide investors with additional sources of potential return, increased diversification, and the lower volatility that results from their valuation approach. The illiquid nature of such assets, and the lag time between the commitment and drawdown of capital for these investments, makes managing the implementation of the allocation particularly important. Considerations include how to fund the capital calls, how to benchmark the allocation before it is fully implemented, how to manage volatility, and whether to hedge currency. Each client will have different governance and structural considerations to balance when determining how best to implement an illiquid allocation.
State Street Investment Management has helped many different types of clients, in different regions, successfully implement illiquid asset allocations that have added value and helped them achieve their objectives. Please contact us or visit ssga.com for additional information on how we can help with your portfolio’s liquidity and exposure needs.