Don’t Forget About the Interest Rate Hedge Ratio
Most plan sponsors are well versed on the benefits of a de-risking glidepath and the virtues of reducing risk as the funded status improves. One way to reduce that risk is the interest rate hedge ratio—the interest rate sensitivity of the asset portfolio measured relative to the interest rate sensitivity arising from the liability cashflow profile. Deciding what level of hedge ratio to target along each stage of the glidepath, how frequently to measure it, and what pool of assets should be used to construct it are all key questions to consider.
In the US corporate defined benefit pension space, there are three dominant risks to funded status – equity beta, interest rates, and credit spreads. Many plans have sought to address these risks through a Liability Driven Investment (LDI) framework that seeks to gradually reduce these risks as the plan becomes better funded. A popular approach is to establish a de-risking glidepath that transitions capital from equity (and other growth) assets to fixed income assets that are more highly correlated to a plan’s liabilities at defined funded status trigger points.
Implicit in the design of a de-risking glidepath is a decision on what interest rate hedge ratio to target at each trigger point. Interest rate hedge ratio refers to the ratio of asset duration to liability duration, adjusted for the plan’s funded status (because total assets may be higher or lower than the liability). Said differently, it’s the DV011 from assets divided by the DV01 of the liabilities. All else being equal, the higher the funded status, the closer the interest rate hedge ratio should be to 100% in order to mitigate the impact that changes in interest rates may have on the volatility of the funded status. The composition of the interest rate hedge ratio will also evolve as the plan becomes better funded – perhaps from an initial composition of long duration Treasuries and futures contracts to eventually being sourced primarily from investment grade corporate bonds spanning the entire maturity curve. Increasing the capital allocated to investment grade corporate bonds as a plan moves along the de-risking glidepath serves to both raise the interest rate hedge ratio as well as the sensitivity of assets relative to liabilities due to changes in corporate spreads.
Figure 1 demonstrates the risk reduction (lower surplus Value at Risk or VaR, shown as green bars) that a pension achieves by moving more of its capital to fixed income and simultaneously increasing its hedge ratio. The light green line represents the declining weight in global equities as the assets are optimized to target an increasingly higher interest rate hedge ratio. Figure 2 illustrates that a pension may also achieve a risk reduction, up to a certain limit, by increasing its hedge ratio even as it holds constant the amount of capital dedicated to equities (light green line). Eventually, the simple act of extending duration to reach a higher interest rate hedge
ratio will introduce curve risk that overwhelms the marginal benefit of an incrementally higher interest rate hedge ratio.
Figure 1: Risk Reduction Achieved by Increasing Hedge Ratio
90% Funded Pension Plan – Unconstrained Optimization
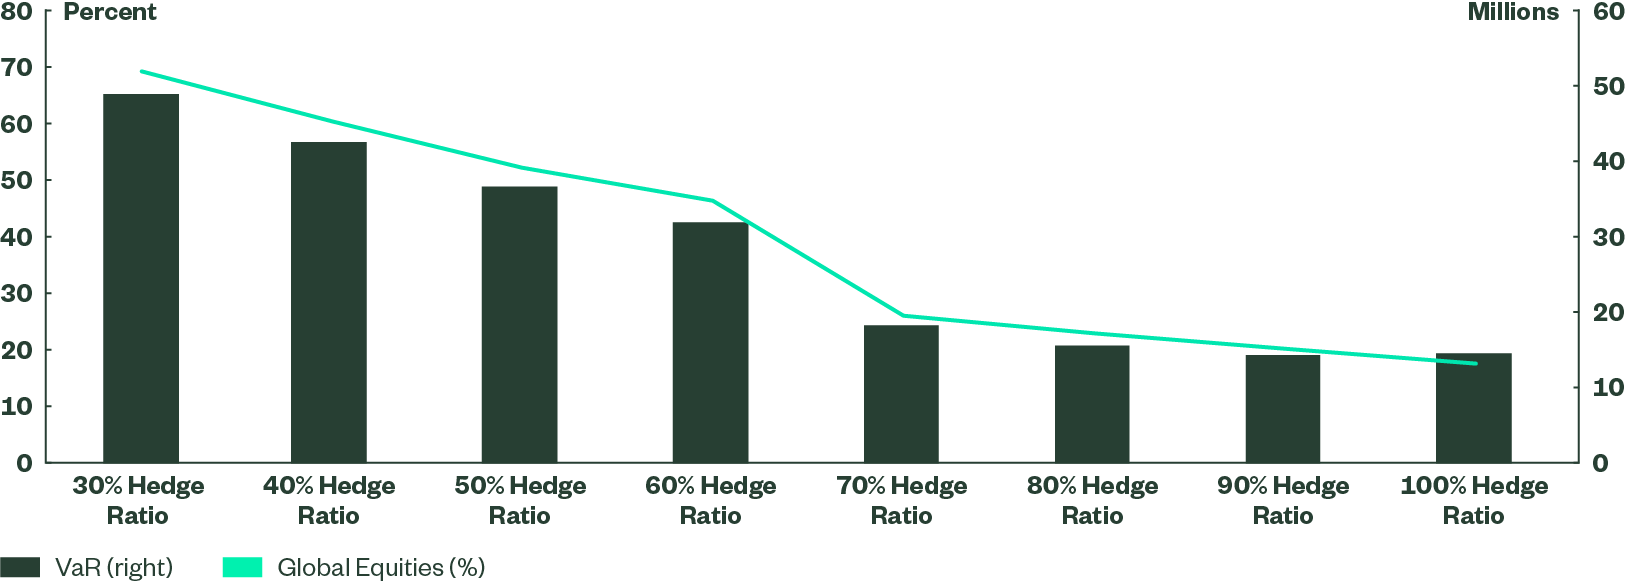
Source: Moody’s Analytics PFaroe; State Street Global Advisors Long Term Asset Class Forecasts as of March 31, 2023. See Appendix A for a description of the liability profile and the universe of assets utilized to derive the hedge ratio.
Figure 2: Risk Reduction Achieved by Increasing Hedge Ratio
90% Funded Pension Plan – Static Allocation of 50% Global Equities
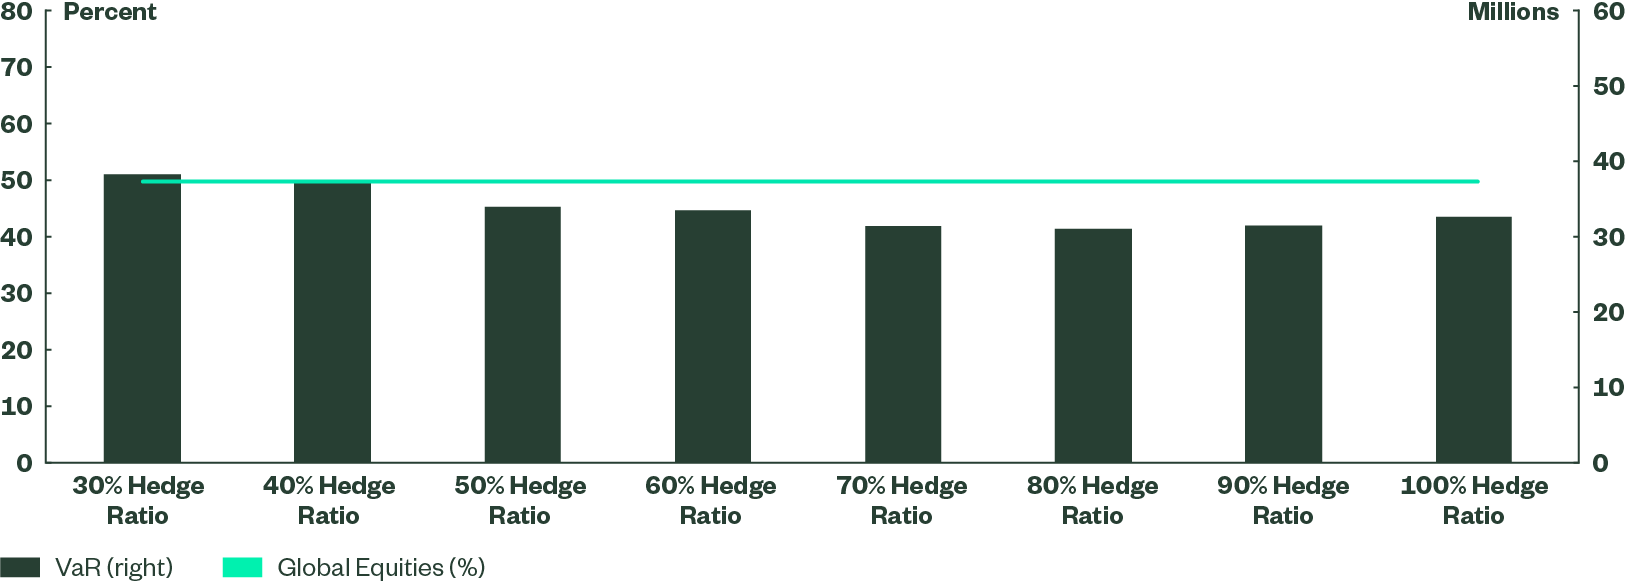
Source: Moody’s Analytics PFaroe; State Street Global Advisors Long-Term Asset Class Forecasts as of March 31, 2023. See Appendix A for a description of the liability profile and the universe of assets utilized to derive the hedge ratio.
A natural question resulting from the above discussion is how to appropriately set an interest rate hedge ratio target for a plan that is not fully funded. What are the factors that affect that consideration? Is an explicit interest rate hedge ratio desired, or is a general level acceptable based on an initial strategic asset allocation? Finally, what metrics should be evaluated to determine if the interest rate hedge ratio requires an adjustment, or whether the funds and/or securities underlying the interest rate hedge ratio need to be traded? Each of these questions deserves ample discussion, which we undertake regularly with our defined benefit clients and prospects. In the following pages, we will touch briefly on a general framework below (Figure 3) in hopes of facilitating these decisions.

Impact of Funded Status on Primary Decisions
The level of funded status of a particular plan is a critical input for plan sponsors when setting an asset allocation, yet it is not the sole variable to be considered. Factors that will influence strategic asset allocation decisions, and ultimately the interest rate hedge ratio, are:
1. What liability basis is used to measure the funded status?
Corporate defined benefit plans employ a number of different liability measures when calculating funded status to evaluate the adequacy of the asset base relative to a variety of goals. Some measures are driven by regulatory or accounting requirements (such as Projected Benefit Obligation, or PBO, which is the measure considered under US GAAP Accounting), while others are more goal-oriented (such as Plan Termination Liability, or PTL, which is based on the estimated cost of transferring the plan’s future obligations to an insurance company). Because “fully funded” on a PBO basis is not necessarily equivalent to being "fully funded” on a PTL basis, it is critical to understand the implications and underlying assumptions of the liability basis before making allocation decisions.
2. Is the plan open and accruing additional service cost?
The combination of service (accrual) and interest cost (liability growth due to passage of time) for an open plan (still accruing benefits) creates a high liability growth rate that needs to be matched or exceeded by the plan assets to maintain funded status without cash contributions. This high liability growth rate often leads to a preference for a larger allocation to growth assets and their higher expected returns. Normally, this would result in a low hedge ratio due to the combination of a low capital allocation to fixed income and a long, growing tail of liability cashflows. However, given the significant increase in interest rates since their nadir in 2020, plan sponsors may now wish to consider extending duration by allocating more capital to US Treasury STRIPS or by employing leverage and utilizing Treasury futures to increase the asset DV01.
3. Does the sponsor have a funding policy for making contributions beyond the minimum required?
With the knowledge that the asset portfolio does not have to shoulder the entire burden of closing the funding gap, plan sponsors may pair a funding policy with a more conservative asset allocation. By allocating more capital to liability-based assets, the hedge ratio may be constructed using a broader universe of assets (predominantly corporate bonds) that span different maturity buckets, thereby reducing curve risk and adding more credit spread exposure.
4. Are the operating fundamentals of the corporation strong enough to support the desired contribution policy?
For those plans that are in the precarious position of being underfunded and attached to a corporation experiencing headwinds, pairing a high hedge ratio with an aggressive asset allocation may be the optimal solution. Forced to seek higher expected returns to compensate for the lack of future funding, plans in this position with a low hedge ratio will be subjected to “double jeopardy” – equity drawdown and concomitant interest rate decline – that may cause their funded status to breech statutory guidelines, triggering a required cash contribution at an ill-fated time. A higher hedge ratio may allow the plan to receive a diversification benefit, should the negative correlation between interest rates and equities manifest again, especially on days when Treasury yields crash (Figure 4).
Figure 4: Days When the 10-Year Treasury Yield Declined by More than 5%
January 3, 2000 through July 31, 2023
| Total | S&P 500 | Days S&P 500 | S&P Average Return on |
Since 1/3/2000 | 103 | -1.94% | 84 | -2.71% |
Since 12/31/2020 | 17 | -0.07% | 10 | -1.10% |
Source: State Street Global Advisors, Bloomberg as of July 31, 2023.
Hedge Ratio: Indirectly Achieved vs. Directly Targeted
Hedge ratio is listed as the last primary item within the decision framework outlined through Figure 3, above, since the plan sponsor retains flexibility on the level of hedge ratio to target almost regardless of the capital allocated to liability-based assets. There are two ways to arrive at a hedge ratio: indirectly, through the strategic asset allocation weights assigned to liability-based assets; or directly, by targeting a specific level (more typically a range) of hedge ratio and then periodically adjusting the liability-based assets to achieve this target (or re-enter the range).
Plans whose funded status and growth asset allocation fall in the middle of Figure 3 are typically achieving their hedge ratio through periodic rebalancing of the total portfolio to a strategic asset allocation. This approach will establish a hedge ratio at the inception of the SAA, but will result in the hedge ratio drifting over time as the assets rebalance to defined targets that are not updated to account for the following factors:2
1. Changes in the level or shape of the yield curve
2. Duration variability within underlying asset portfolios/benchmarks (Figure 5)
3. Evolution in the liability duration profile (e.g. mortality adjustments)
4. Changes in the funded status
For plans that are focused on closing a funding gap or targeting higher expected returns to compensate for future accruals, sourcing a hedge ratio indirectly is a fairly effective approach.
Alternatively, for plans that are well funded and seeking to mitigate the impact of interest rates on their funded status volatility, we recommend arriving at a hedge ratio directly by employing a target solution that establishes a desired hedge ratio level and an acceptable range. Employing an acceptable range, typically +/- 2% tolerance around the desired level, acknowledges that high precision comes with a cost of frequent trading. To implement this target/range solution, our process incorporates information from both the asset portfolio and the liability profile to assess the current level of the hedge ratio, usually within a few days of each month end.3
If the hedge ratio level is within the acceptable range, no action is taken. If one of the factors mentioned above has caused the hedge ratio to drift outside of the range, we undertake trades to bring the level back to the center of the range. Our actuarial, strategist and implementation teams work closely to measure and execute with the required speed and precision, typically resulting in a fairly low trading frequency and a tight tolerance around the hedge ratio target. While the monitoring and rebalancing process can be resource-intensive, our experience and toolset allows us to implement the approach efficiently and with great success both for clients who have placed their plan in hibernation, as well as those that have reached a funding level where annuitization is being contemplated.
Summary
Most plan sponsors have become well versed on the benefits of a de-risking glidepath and the virtues of reducing risk as the funded status improves. A major determinant of that risk reduction is the interest rate hedge ratio whereby the interest rate sensitivity of the asset portfolio is measured relative to the interest rate sensitivity arising from the liability cashflow profile. Deciding what level of hedge ratio to target, how frequently to measure the ratio, and what pool of assets will be used to construct it are all key decisions that should be integrated into the design of the de-risking glidepath.
Appendix A – Hedge Ratio Optimizations
Surplus Value at Risk (VaR) numbers were calculated for a hypothetical pension plan using the liability cashflows shown below and setting the asset portfolio capital to arrive at a 90% funded status on March 31, 2023. For each optimization run, a hedge ratio was targeted using PfaroeDB’s Optimization module, setting a parallel interest rate shift as the sole parameter. The assets included in the optimization are listed below and are based on State Street Global Advisors Long-Term Asset Class Forecasts as of March 31, 2023.
Figure 7: Asset Classes included in Hedge Ratio Optimization
| Security | Modified Duration | Effective Duration |
| Global Equities (ACWI) | ||
| US High Yield Bond | 4.7 | 4.5 |
| US Intermediate Credit Bond | 4.4 | 4.3 |
| US Intermediate Government Bond | 4.0 | 3.9 |
| US Long Credit Bond | 13.0 | 12.7 |
| US Long Treasury STRIPS Bond | 25.2 | 24.5 |
Source: State Street Global Advisors, PFaroeDB.