2023 Target Retirement Annual Review
Each year, State Street Global Advisors conducts a comprehensive review of its Target Retirement strategies. The annual review process is driven by the Defined Contribution Investment Group (DCIG), which blends asset allocation expertise from State Street’s Investment Solutions Group with defined contribution (DC) market insights from the Global Defined Contribution team. The review follows a consistent and transparent framework to reassess the capital market expectations and demographic assumptions that underpin the glidepath, while also evaluating new asset classes and investment themes for inclusion in the portfolios. The process is grounded in three key criteria: desirability, suitability, and investability.
Executive Summary
As we conducted this year’s review, we noted that both the investment landscape and our position in the target date fund (TDF) marketplace look different than in years past. Our review was driven by the goal of improving outcomes with a particular emphasis on crucial implementation considerations such as liquidity and tracking error. With the sharp acceleration in inflation and rapid rise in yields impacting the relative desirability of asset classes, we reassessed the role of fixed income across the glidepath and explored other segments of the bond market for potential inclusion. Meanwhile, the substantial growth in assets in our State Street Target Retirement series has caused us to take a fresh look at implementation considerations, specifically reexamining our rebalancing process through the lens of a larger asset base and different market conditions.
Asset Allocation Considerations
Bonds Under the Microscope: Bonds have experienced a significant period of underperformance since the COVID-driven flight to quality in 2020. The rapid rise in rates paired with the potential for a “higher for longer” environment has many questioning the role of fixed income in TDFs. We believe that diversification is not broken, and that bonds remain poised to play a key role across the glidepath. For younger investors, a 10% allocation to long duration government bonds is expected to provide higher levels of real income relative to the past few years, while offering potential price appreciation and a buffer to equity market volatility as correlations between bonds and stocks normalize. Later in the glidepath, we believe that our diversified approach to fixed income — including short duration, credit, and high yield — should offer higher efficiency and lower interest rate sensitivity in retirement.
Exploring New Opportunity: The sharp increase in yields has caused a number of fixed income asset classes that are not currently held in the glidepath to merit consideration. Non-US bonds and, most notably, emerging market debt, are examples of asset classes that we have reviewed in the past but ultimately chose not to implement. This year, with desirability and liquidity improved, we evaluated emerging market hard-currency sovereign debt as a potential means to improve risk-adjusted returns. In the end, however, there are a number of additional considerations — ranging from geopolitical risks to the mechanics of daily trading — that continue to raise questions over suitability.
Implementation Considerations
Just as we consider the investability of any asset class for inclusion, the ongoing implementation process for the strategy is crucial to delivering successful long-term outcomes. The substantial growth of the State Street Target Retirement strategies — assets have nearly tripled over the last five years to what is today $167 billion — merits refreshed analysis on the rebalancing process for the strategy. We have historically employed a quarterly rebalance, which has been additive through periods of market volatility and stretched liquidity, and as assets rise, the importance of implementation only grows.
Results for 2024: No Changes and Reinforced Conviction in Our Approach
After a robust review, we reaffirm our conviction in the glidepath and implementation for the market environment going forward, and will not make changes to the glidepath for 2024. Three key reasons are detailed below:
- The outlook across fixed income asset classes, broadly, is as strong as it has been since the inception of the TDFs. We are comfortable with the level of diversification and the potential for real income and price appreciation that the existing fixed income allocations may deliver.
- While return forecasts for emerging market debt (EM debt) are quite compelling, the expected impact on outcomes is a function of the level of excess risk that we are willing to take on. EM debt carries a higher level of risk with higher potential tracking error relative to fixed income asset classes in the glidepath today. We have a long history of implementing these exposures and are comfortable with the liquidity profile, but these considerations suggest that the incremental benefits are not material enough to justify a change at this time.
- Our quarterly rebalancing process continues to add value from an investment standpoint, and we have the necessary scale and discretion, as needed, to process rebalances across multiple tranches to ensure best execution in quarters that require larger trade sizes. The benefits of this approach continue to outweigh a change to either a monthly or daily rebalancing cadence.
In this paper, we will provide insights into our research process and some of the key considerations that drove this recommendation through the lens of our three key criteria: desirability, suitability, and investability. Desirability and suitability will focus on asset class considerations, while investability will detail our review of the rebalancing process.
Desirability
Would enacting this change to the glidepath be expected to improve participant outcomes?
Though we have made a number of enhancements since the inception of the strategy in 2005, changes have been made through a long-term lens, avoiding tactical changes to the risk profile of the glidepath. Recognizing the importance of bonds as a source of diversification and portfolio efficiency over long horizons, we maintained our conviction in this approach through recent years despite low yields, presenting a challenging outlook for fixed income. At the time of our review, with fixed income yields hovering around multi-decade highs and the equity risk-premium at its 20-year low, this view is reinforced and the outlook for bonds relative to equities has materially improved. As such, we believe our current positioning within fixed income across glidepath — focused on diversification and positioned to benefit from higher coupons and potential price appreciation — is appropriate going forward. For more information on our views about diversification and fixed income’s role in a TDF, please see our white paper “Diversification Isn’t Broken.”
Figure 1: Equity Risk Premium at Lowest Point in 20 Years

Beyond our current approach, we explored fixed income markets outside of the US to identify any attractive opportunities. In the past, we reviewed local-currency emerging market debt due to its desirable return prospects, but ultimately chose not to add the asset class because currency exposure and the concentrated nature of the index introduced a level of volatility that was not suitable. Today, with return expectations improved across the board, our 2023 review focused on asset classes that do not feature the same types of volatility — non-US developed market bonds (hedged to USD) as well as emerging market hard-currency sovereign debt (referred to as EM debt).
Using the long-term asset class forecasts generated by State Street’s Investment Solutions Group as a starting point, the first thing that jumps out is the relative efficiency of fixed income compared to equities, and the lack of compensation for the excess risk that equities present. Comparing different fixed income asset classes in the chart below, while EM debt appears especially desirable, fixed income largely stands out as desirable across the risk spectrum. One exception continues to be non-US developed market bonds, which, despite significant improvement from the days of negative yields, still appear undesirable relative to US core bonds. Additionally, diversification benefits are largely mitigated by hedging currency to USD, while the index provides minimal sector diversification. Using portfolio optimization as a guide, EM debt clears the necessary hurdle rate for further consideration while non-US aggregate bonds do not.
Figure 2: Long-Term Risk and Return Expectations:
EM Debt Stands Out While Global Agg Is Less Compelling

Incorporating EM debt would be, based on our current forecasts, a more thoughtful and efficient way to potentially improve outcomes when compared to increased equity exposure. However, the expected risk that we are willing to take on will ultimately drive the level of impact. Through our analysis, we identified High yield and US investment grade bonds as the primary areas from which to source the potential allocation. Increasing the level of risky debt at the expense of US investment grade bonds in the years approaching retirement would be most impactful, but would increase the risk profile of the glidepath and introduce additional value at risk.
We were particularly sensitive to increasing risk for participants approaching and entering retirement, and as a result we ultimately focused on an approach that kept the allocation to risky debt in retirement consistent with our current glidepath. We accomplished this by sourcing the exposure from US aggregate bonds in the wealth accumulation phase and high yield in retirement. We elected to split the high yield and EM debt allocation for each vintage where EM debt was introduced, due to the diversification benefits and relative efficiency of the pairing.
While EM debt is an investment grade asset class based on average credit quality, sourcing the exposure from US investment grade bonds would, predictably, increase the expected risk of those vintages where US bonds were reduced. Further, the rapid increase in yields throughout the year has dramatically improved the outlook for US investment grade, with core bonds at the time of our analysis providing long-term return expectations that are in range of what is expected from US large cap stocks. As a result, a 3.5% allocation to EM debt introduced at the initial de-risking point improved return expectations less than expected — by 5–10 basis points (bps) across vintages — while increasing risk by 5–20 bps, ultimately causing a minimal impact on efficiency.
On the other end of the spectrum, replacing a portion of high yield exposure with EM debt may provide benefits in terms of risk reduction, reducing reliance on the US credit cycle and offering varying levels of diversification in different stress scenarios. This blended approach between US high yield and EM debt carries an attractive expected return profile but limited impact on outcomes, as return expectations are comparable between the two asset classes. While today’s forecasts may support it, reducing equity exposure in the wealth accumulation phase is not desirable, regardless of current valuations, due to the role that equities will continue to play in addressing longevity risk. This ultimately makes the inclusion of EM debt at the expense of current fixed income exposures less impactful to overall outcomes.
EM Debt – Desirable, but with Caveats
In all, EM debt passes the desirability threshold — albeit with caveats. Inclusion of EM debt improves expected outcomes in the median case but may introduce more variance. Thus, we look to the relative suitability metric to guide the ultimate decision of whether or not to add the asset class.
Suitability
State Street’s history in managing EM debt mandates, experienced and skilled trading team, and broader technological improvements in how EM debt markets are traded allowed the DCIG to get comfortable with the asset class and our ability to implement it. However, higher expected returns relative to US investment grade are largely due to the added risks that EM debt presents, namely liquidity, geopolitical, and lower quality. Given the strong outlook for fixed income as a whole, these additional considerations may impact whether the asset class clears the bar of materiality for inclusion.
There are three key aspects of suitability that must be considered:
1. Liquidity
While EM debt has benefited from significant improvements in liquidity due to market growth and technological advancement, liquidity varies widely depending on the segment. Sovereign debt is relatively liquid while corporate debt is not. Focusing on sovereign debt, and leveraging State Street’s experienced trading desk with a proven track record, allows for greater potential daily trading volume in EM debt than what is expected even in US high yield.
Since we last reviewed the asset class, the size and structure of the market has improved dramatically. Since 2010, the size of the EM hard-currency debt market has nearly quadrupled. There has been a notable increase in sovereign and quasi-sovereign issuers over that time. In addition, over the past several years, engaging with counterparties to execute portfolio trades has become a much more prominent feature of the EM debt market. Portfolio trades allow our trading desk to trade multiple EM debt bonds at once instead of individually trading bonds. Portfolio execution is a much more seamless way to trade EM debt, helping reduce the market impact of trading and potentially lowering slippage costs, as the entire portfolio can be executed at once versus over time. In total, portfolio trading has notably improved the liquidity of the market.
As part of our analysis, we stress tested our glidepath with hypothetical EM debt allocations to understand empirically the range of trades that could result following large market moves. After consulting with our trading desk, even in extreme scenarios with constrained liquidity, we felt comfortable that the market could digest these hypothetical trade sizes.
Figure 3: Growth of EM Debt Markets Over Time

2. Expected Tracking
While some level of expected tracking error is accepted for higher returning asset classes, tracking error is still a key area of focus for index-based target retirement strategies. Certain asset classes — international equities and global REITs, for example — carry structural tax advantages that lead to an expected level of positive tracking when accessed via a DC ERISA collective investment trust. Others, like high yield, carry higher expected tracking bands due to the relative illiquidity of the asset class, making it less feasible to fully replicate.
Similar to high yield, an allocation to EM debt would come with higher expected ranges of tracking. State Street has a global Emerging Market Debt trading team and has the capabilities to trade around the clock. However, because EM debt trading is centered in London due to proximity to multiple time zones, the timing of when trades are sized for US Investors may leave limited time to trade in certain markets. While these considerations do not pose material issues in terms of execution of daily trading, they give some insights into potential drivers of tracking error for DC participants beyond those inherent in the asset class, despite its favorable liquidity.
3. Risk Relative to US Investment Grade
EM economies typically have higher growth and lower debt to GDP than developed markets. In addition to attractive risk-adjusted returns, EM debt offers diversification from developed market macroeconomic and monetary policy regimes and cycles. It also offers attractive yield enhancement versus US investment grade, with a higher overall credit quality than US high yield.
Additionally, the composition of the EM hard-currency sovereign universe makes the asset class more desirable. Unlike local-currency EM debt, which is a highly concentrated index, there are 68 countries in the EM hard-currency universe, with balanced regional diversification and a 10% maximum country allocation, somewhat lessening the impact of idiosyncratic risks.
However, emerging market countries carry geopolitical and economic risk. Geopolitical risk is, in large part, compensated via the long-term return expectations for the asset class. However, this is still an important consideration for US-based target date investors and is especially poignant today. In terms of economic risk, despite carrying an investment grade rating, EM debt is still down the quality spectrum from US aggregate bonds, while presenting some liquidity risk relative to the US bond market.
Verdict on Suitability
As noted in the desirability section, any additional risk that the glidepath takes on needs to be compensated by additional levels of expected return. With the outlook for fixed income as a whole improved as a result of the material increase in rates in recent years, the improvement in expected outcomes by adding EM debt was certainly present, but marginal. While there are potential benefits from pairing US high yield with EM debt, the impact on outcomes was ultimately not material enough to offset the added risks detailed above.
As a result, EM debt narrowly misses the threshold for inclusion based on suitability for our off-the-shelf strategies; however, we remain positive on the asset class and will continue to use EM debt as an available asset class in circumstances where a higher risk profile may be appropriate or as long-term market forecasts evolve.
Investability
While investing in EM debt takes a high level of expertise and careful day-to-day management, we remain broadly comfortable with the ability to implement this exposure. We chose not to add EM debt to our off- the-shelf glidepath for 2024, but the detailed analysis of the relative liquidity of the asset classes in the glidepath and stress tests of potential illiquidity events paired nicely with a broader review of implementation processes for the existing glidepath.
We have historically employed a quarterly rebalancing cadence, as we believe this strikes the right balance between capturing short-term performance momentum, managing transaction costs, and keeping tracking error in line by investing intra-quarter daily cash flows at the floated benchmark weights. However, as the strategies have grown, a quarterly rebalancing cadence has led to larger and larger trade sizes, which impacts liquidity considerations for the asset classes we consider (e.g., EM debt) and highlights the importance of a thoughtful approach for how and when to execute rebalance trades in periods of heightened volatility (e.g., Q1 2020).
From an investment standpoint, we evaluated the historical returns of our asset allocation, using a strategic asset allocation that closely approximates the income fund as an example of the most broadly diversified underlying vintage in the glidepath. In conducting this analysis, we found that quarterly rebalancing had been additive — both in terms of annualized risk and return as well as the impact on portfolio turnover and transaction costs. While the relative impact varies across vintages, quarterly has driven higher returns over monthly in all scenarios. Also important, especially with respect to the income fund, quarterly had lower max drawdowns than both daily and monthly cadences.
The performance impact of a daily rebalance was more mixed, presenting marginal performance benefits in more equity-heavy vintages, but these marginal benefits did not justify significantly higher turnover and transaction costs. While annual and semi-annual rebalances may potentially improve performance, asset class weights drift considerably from strategic weights in these scenarios, and as a result, they were not considered. We also analyzed various trading bands (e.g., 3% and 5%) as part of this analysis, but did not consider adding them due to the potential for higher tracking error and added complexity with respect to execution and attribution.
Excess Risk and Return at Different Rebalancing Cadence
| % | Quarterly Rebalance | Impact From Daily Rebalance Relative to Quarterly | Imapact From Monthly Rebalance Relative to Quarterly |
|---|---|---|---|
| Annual Return | 5.44 | -0.11 | -0.14 |
| Std Deviation | 6.25 | 0.03 | 0.05 |
| Sharpe Ratio | 0.870 | -0.021 | -0.029 |
| Max Drawdown | -22.38 | -0.07 | -0.52 |
| Avg Annual Turnover | 13.8 | +83.35 | +7.02 |
Source: State Street Investment Solutions Group as of 9/30/23. Historical performance comparison reflects a backtest of index returns from 12/31/1997–6/30/23 due to data availability for a close proximity of the State Street Target Retirement Income fund. Backtested performance does not reflect returns of the actual fund. Strategic asset allocation for the backtested portfolio is as follows: 13.8% S&P 500 Index, 2.6% S&P 1000 Index (due to its longer track record than the Russell Small Cap Completeness Index), 10.1% MSCI ACWI ex US IMI Index, 5% FTSE EPRA/NAREIT Developed Index, 3.5% Bloomberg Roll Select Commodity Index, 18% Bloomberg 1–10 Year Government Inflation-Linked Bond Index, 7% BofA ICE US High Yield Constrained Index, 20% Bloomberg US Aggregate Bond Index, 20% Bloomberg US 1–3 Yr Government/Credit Bond Index
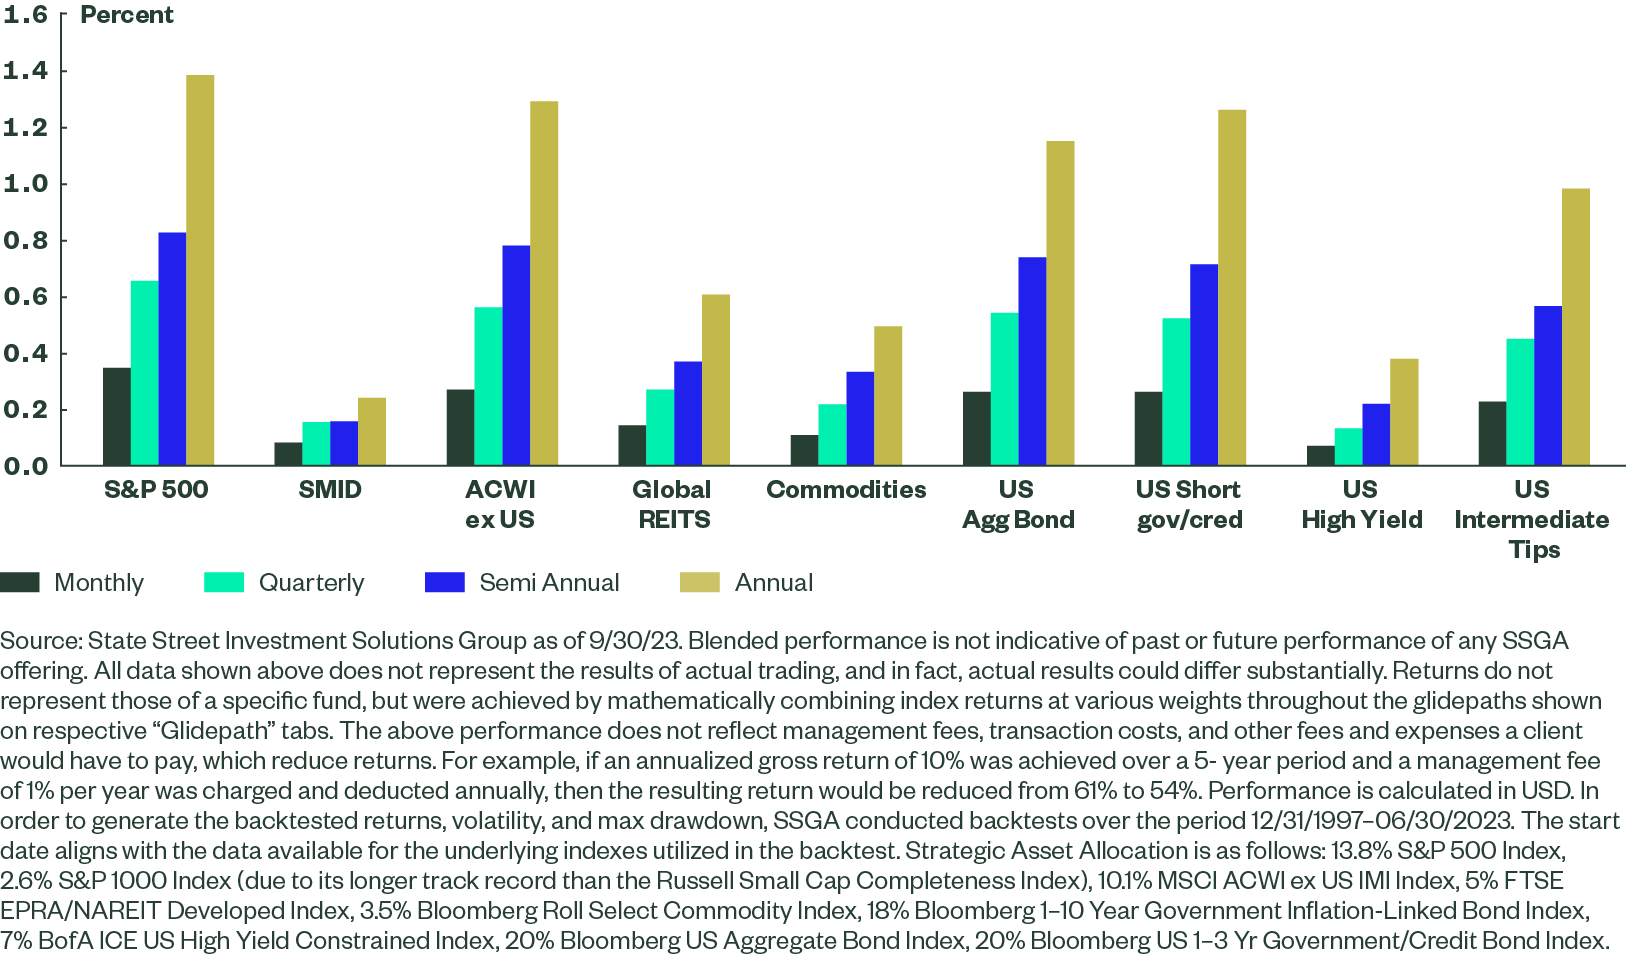
Secondly, we stress tested various trade sizes — the average historical rebalance trade by asset class as well as the largest trades for each asset class that were executed over the period. As one might expect, the average trade size was higher for quarterly rebalances versus monthly and daily. For example, the average quarterly US large cap trade was 65 bps (meaning the average difference between the target weight and portfolio weight at the time of the rebalance was .65%), while using a monthly cadence, the average would have been 34 bps. While a quarterly rebalance led to the largest trades over the periods examined — driven by 2008 and 2020 — the absolute difference has historically been largest in more liquid asset classes where there is significant capacity for daily trading volume. These stress tests gave us comfort that the market will continue to be able to digest the larger trades that may arise due to quarterly rebalancing in volatile markets.
Figure 4: Average Rebalance Trade By Asset Class
Beyond the average size of the rebalance, we were particularly focused on the most significant historical rebalances and how those scenarios would impact the funds going forward. Through this lens, interestingly, the difference between trade sizes was less notable. For example, while the average quarterly rebalance trade was roughly double the monthly trade size, the largest trade across asset classes — and most notably what are generally considered less liquid asset classes like US high yield and global REITs — was far tighter. The largest monthly rebalance for US high yield was 75% of the largest quarterly trade, while the largest global REIT monthly trade was 85% of the largest quarterly rebalance. Commodities were the lone exception, as the difference in size of the largest trade was more significant than the difference in average, but commodities make up the smallest percentage of the asset allocation and thus dollar amounts are more modest.
Figure 5: Largest Historical Rebalance by Asset Class

Analysis of historical performance impact solidifies that a quarterly rebalance continues to strike the right balance between minimal deviation from benchmark weights and additive performance. The Investment Solutions Group works closely with our equity and fixed income portfolio management teams to execute each rebalance, carefully considering the maximum dollar amount that can be traded for each underlying fund in the context of the growing Target Retirement strategies. We expect to be able to execute on a quarterly rebalancing cadence as the strategies grow, maintaining the flexibility to execute in multiple tranches during periods where larger trade sizes may correspond with stretched liquidity. We believe that the potential for modest tracking error in these rare circumstances that may require multiday execution is more appropriate than the added turnover and potential for negative performance impact that would come from a monthly or daily rebalancing cadence.
Closing Thoughts
Given the turbulent rate environment over the past few years and a potential “higher for longer” regime going forward, our annual review process gave us an opportunity to put our TDFs under a microscope. Focusing our review on the two areas that have shifted the most over the last few years — the starkly different yield environment and the material growth in our TDF assets under management — our review concluded the following:
- Reaffirmed conviction in our current glidepath: Examining our glidepath, we dug into our bond exposure through the lens of a higher yielding environment. The outlook for fixed income, broadly, is as strong as it has been since the inception of the TDFs. Balancing this against the compressed expected returns for global equities, we believe diversification across the glidepath will be key to generating strong risk-adjusted outcomes. Moreover, as we reevaluated our fixed income allocation across the glidepath, we remain confident in the level of diversification and the potential for real income and price appreciation it may deliver.
- No new asset classes to be added for 2024: Emerging market debt is increasingly attractive from a US-based investor’s perspective, driven by improved return expectations and liquidity. Offering diversification and a deeper market than at any time previously, there is potential for improved outcomes when pairing EM debt with US bonds in our glidepath. That said, the relative tradeoffs need to be weighed against the unique risks and likely higher expected tracking error that comes with this type of allocation. Finally, given the improved outlook across the fixed income landscape, the inclusion of EM debt did not pass the materiality threshold for our off-the-shelf TDFs.
- Maintained quarterly rebalance cadence: As our TDF assets under management have grown, our quarterly rebalance process has led to larger and larger trade sizes. In an effort to balance lower tracking error with higher transaction costs, we examined several different rebalancing cadences to examine the impact on both participants and liquidity. In the end, we believe our quarterly rebalance approach still strikes the right balance of capturing short-term momentum while minimizing tracking error, and benefits participants by keeping transaction costs low relative to a monthly or daily rebalancing cadence.