Using ETFs to Rebuild Your Bond Core in 60/40 Portfolios
In the wake of the worst bond returns in nearly 50 years, rate hikes and persistent inflation continue to challenge returns — making now a good time to rebuild your bond core.
The Role of Bonds in a Traditional 60/40 Portfolio
In the traditional 60/40 portfolio, the role of bonds is to offset the risks that stocks carry. But last year, because bonds fell along with stocks, they failed to provide that desired income and stability. Now, in the wake of the worst bond returns in nearly 50 years, rate hikes and persistent inflation continue to challenge returns — making this a good time to rebuild your bond core.
Today, there are more than 600 bond exchange traded funds (ETFs) — including actively managed strategies — you can use to help you target sectors of the bond market for their specific risk and return characteristics, to better align your bond core with the current market.
While the Bloomberg US Aggregate Index (Agg) has traditionally provided an off-the-shelf core bond exposure, the benchmark no longer aggregates all fixed income sectors. Its ability to provide diversification is further reduced due to historically high correlations between its largest components. And, because the index is vulnerable to today’s elevated duration risks, it’s failed to provide reliable and sufficient income to investors.
Is there a better alternative to the Agg for your core bond exposure?
4 Ways Bond ETFs Can Help You Rebuild Your Fixed Income Core
To help you better pursue your goals, by increasing yield and lowering duration in your core, here are four ways you can use transparent bond ETFs.
1. Mitigate Risk by Optimizing Yield per Unit of Duration
The Agg's market-cap weighting scheme results in a heavy bias toward Treasurys (~40%). This tends to reduce the index's yield while extending its duration. Constructing an equal weighted portfolio of the Agg’s subcomponent sectors (investment-grade corporates/credit, mortgage-backed securities, and Treasurys) results in a more balanced sector exposure, but with a similar risk/return (duration/yield) profile. It also results in an ever-so-slight improvement to the yield-per-unit of duration metric (0.69 versus 0.68 for the Agg).
Using just the intermediate (1-10 year) portions of the Treasury and corporate markets balances yield and duration more evenly. But the intermediate version of an equal-weighted Agg has the same yield as the Agg (4.3% ) with two fewer years of duration (4.5 years).1 This results in a yield-per-unit duration of 0.96, but these slight improvements fail to produce yield at a reasonable risk (YARR).
Optimizing the weighting of the subcomponents (maturity bands) of the core Agg sectors to maximize the yield per unit of duration can help you to more precisely meet your objectives with the traditional exposures of the Agg.
By delineating short-, intermediate-, and long-duration exposures within the corporate and Treasury sleeves, you can adjust the balance between all segments to target the best possible exposure given portfolio constraints — such as the yield and duration tradeoff.
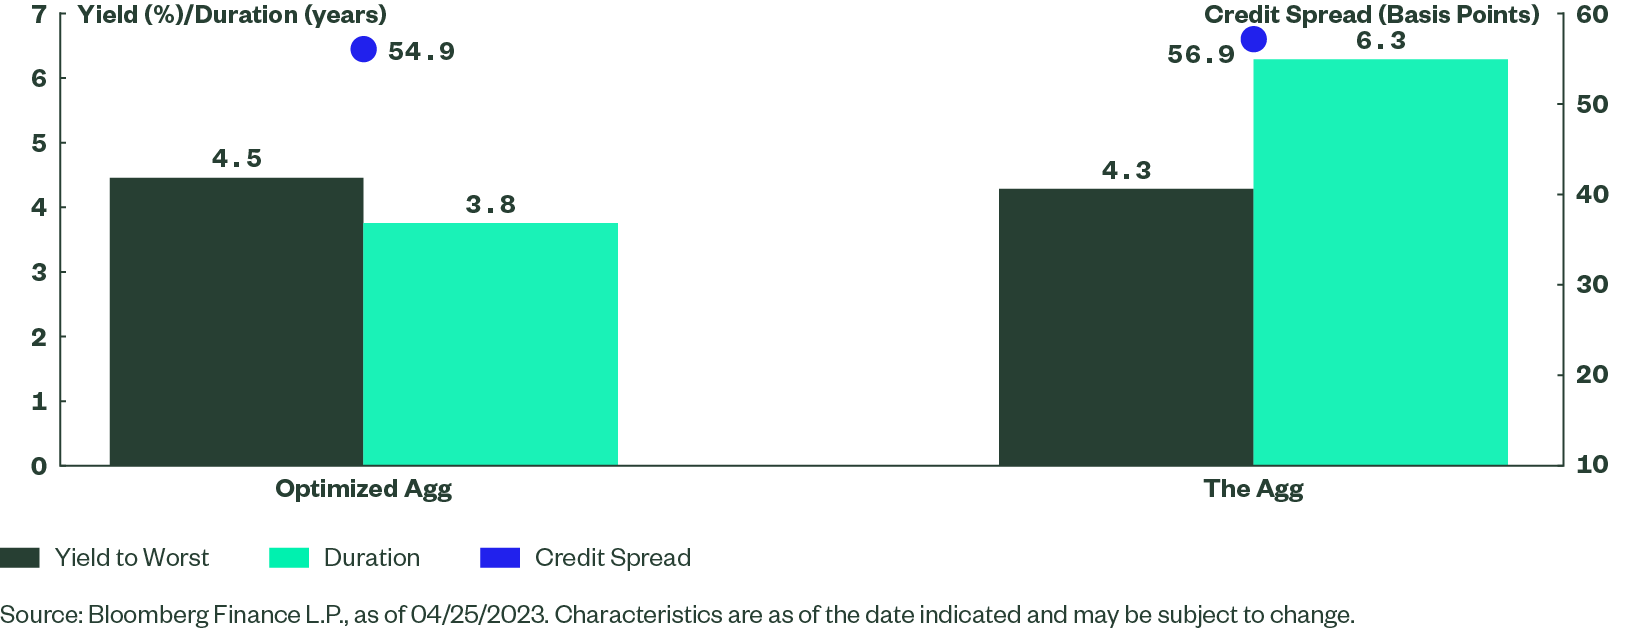
The figures below illustrate how you can adjust the Agg sector weights to optimize yield per unit of duration while still complying with risk constraints.
With 40% less duration alongside a higher yield, this allocation improves the risk/return tradeoff afforded by the Agg by 74% (1.19 versus 0.68 yield per unit of duration), while staying aligned to the heritage sector exposure. Spread risk is lowered as well, given the focus on shorter-term exposures and how attractive that part of the curve has become due to the Federal Reserve’s recent rate hikes.
Optimized Core Agg Sector Weights and Constraints
| Portfolio | Weights (%) | |
|---|---|---|
| Treasurys | Short Term | 30 |
| Intermediate | 7 | |
| Long Term | 3 | |
| Corporates | Short Term | 30 |
| Intermediate | 7 | |
| Long Term | 3 | |
| Mortgages | 20 | |
| Constraints | Agg Sector Weight Cannot Exceed 40% or be less than 20% Each Duration Bucket Weight must be between 3% and 30% Portfolio Option Adjusted Spread Cannot Exceed the Agg by 20% |
|
Optimized Agg Portfolio Profile versus the Agg
2. Boost Diversification and Income by Adding Nontraditional Bond Sectors
If being confined to mortgages, Treasurys, and corporates won’t allow you to meet your objectives without overconcentrating the portfolio, ancillary bond segments can offer potential diversification and income benefits.
Bond segments like senior loans, high yield, and emerging market debt are historically less correlated with the Agg .2 When assets are less correlated, their prices tend to diverge. This diversification potentially reduces risk and helps boost a portfolio's risk/return profile.
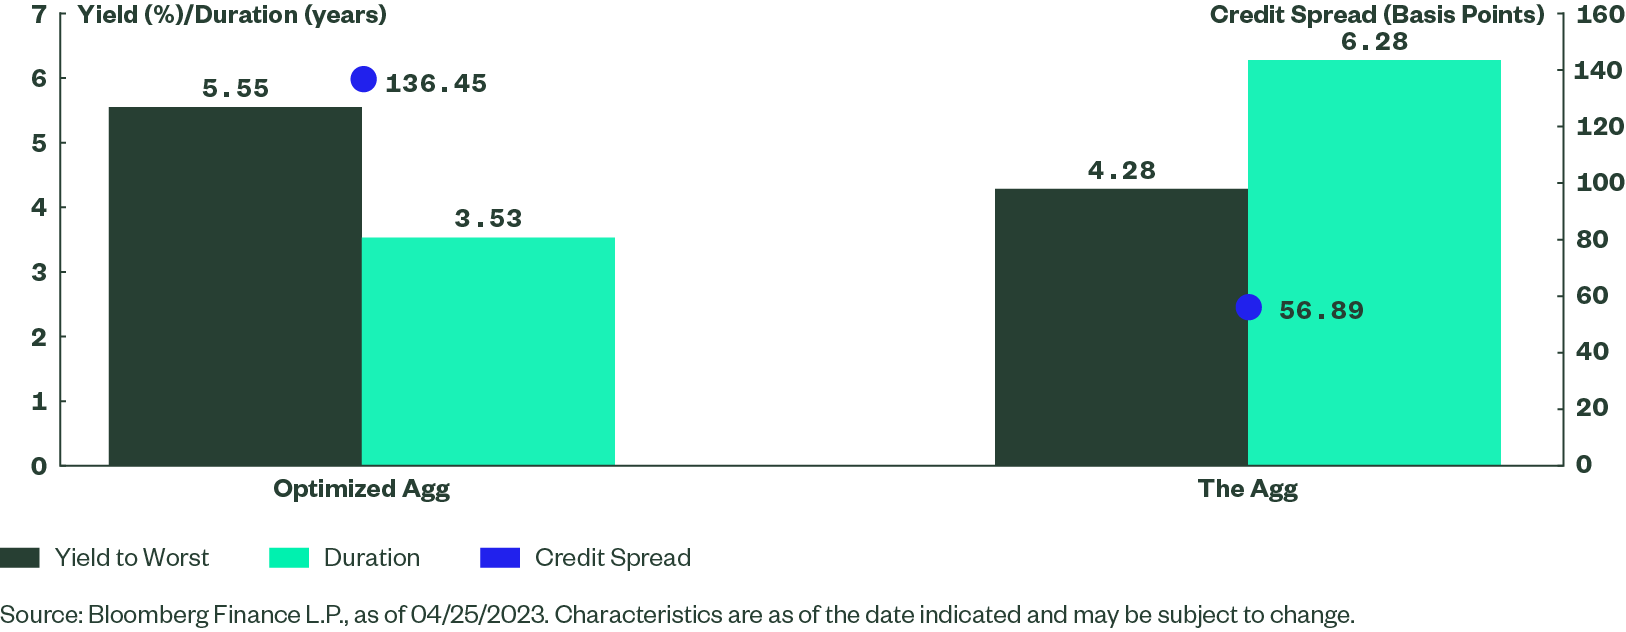
The portfolio below allocates 30% of the core fixed income portfolio to nontraditional bond sectors, while maintaining the 70% weighting to the optimized Agg exposure shown in the prior example. Doing this improves the yield/duration profile, without overconcentration in any one complement exposure.
Following this rules-based approach leads to a portfolio with 131% higher yield per unit of duration than that of the Agg (1.57 versus 0.68) and increased diversification across geographies and sectors. It also avoids taking on significant spread risk, as the overall credit spread level is commensurate with investment-grade corporate bonds (136 basis points).3
As for diversification, the Bloomberg Fixed Income Risk Model shows that this portfolio has a lower expected standard deviation than the broader Agg, 4.14% versus 6.42%, because it contains less correlated markets that go beyond a simple mix of high-grade corporates and Treasurys.
Optimized Core-Plus Agg Sector Weights and Constraints
| Portfolio | Weights(%) | |
|---|---|---|
| Treasurys | Short Term | 21 |
| Intermediate | 5 | |
| Long Term | 2 | |
| Corporates | Short Term | 21 |
| Intermediate | 5 | |
| Long Term | 2 | |
| Mortgages | 14 | |
| Nontraditional | EM Local Debt | 4.9 |
| US High Yield | 10 | |
| Preferreds | 2 | |
| Senior Loans | 10 | |
| Pan-European High Yield | 3.1 | |
| Portfolio Constraints | 70% in Optimized Agg No more than 10% in one of the non-Agg sectors No less than 2% in one of the non-Agg sectors Credit Spread equivalent to US Corporates Yield more than the Agg |
|
Optimized Core-Plus Agg Portfolio Profile versus the Agg
3. Stabilize Income by Structuring Bond Allocations Based on Outcomes
The goal of a bonds in a portfolio is three-fold, to provide 1) income 2) diversification and 3) stability. Today, however, the unbalanced yield and duration profile of most bond cores limits an investor’s potential return and income.
While the above approaches to building your bond core seek to maximize yield per unit of duration while managing spread risk (credit risk and implicit equity biases), alternatively you could structure a portfolio to target the above three goals equally.
First, select assets for their properties related to those three attributes and place them into three buckets:
- Diversification: Strategies with a negative correlation to stocks.
- Income: Markets with a high income potential.
- Stability: Exposures with low standard deviation of returns, likely short-term funds.
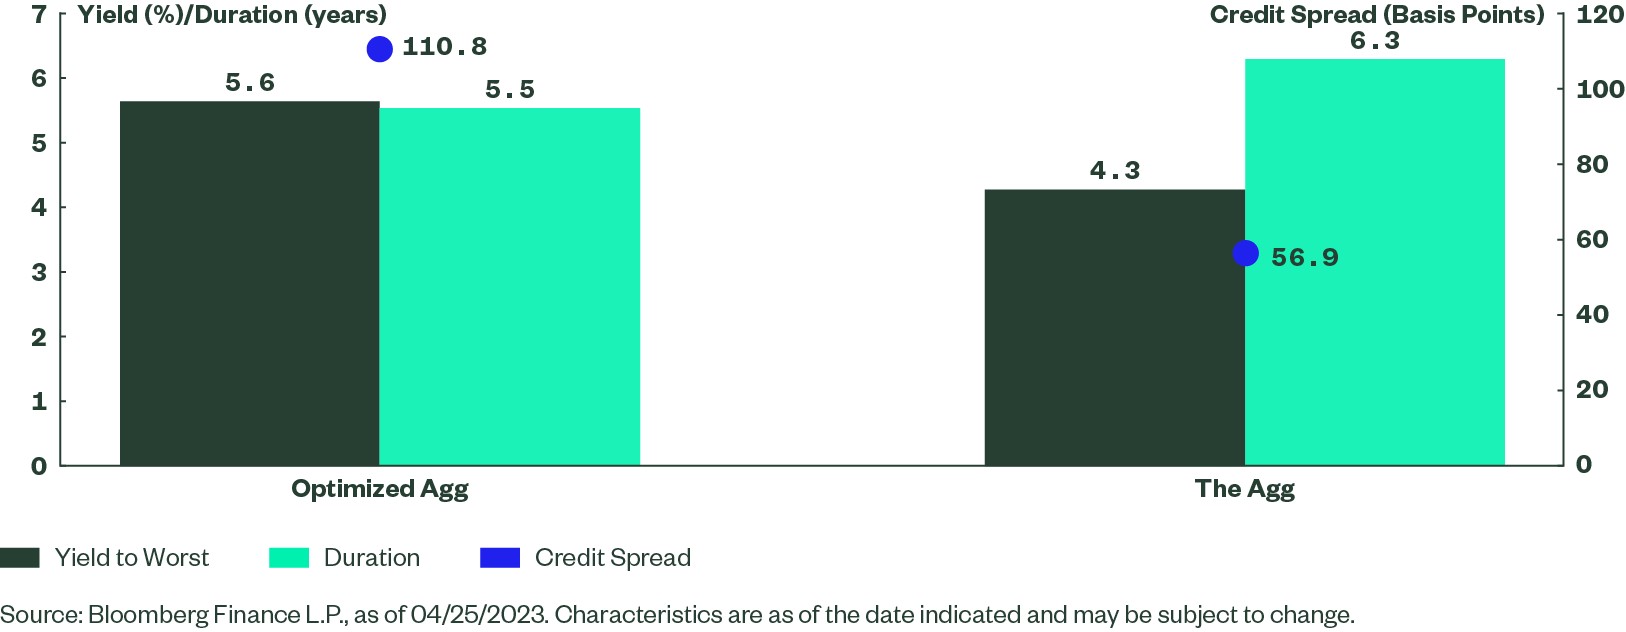
Second, equal weight the strategies in each bucket, so that no single bucket or strategy dominates the portfolio. The chart below shows the allocations to each of the three buckets and the results relative to the Agg. Relative to the Agg, the resulting portfolio has:
- Higher yield
- Lower duration
- An option-adjusted spread just under 100 basis points
Additionally, the Bloomberg Fixed Income Risk Model shows that this portfolio has a lower expected standard deviation than the broader Agg, 6.03% versus 6.42%, due to its focus on diversity and income stability.
Three Bucket Portfolio Weights
| Portfolio | Weights (%) | |
|---|---|---|
| Diversification | Long-term Treasurys | 11.10 |
| Long-Term Corporates | 11.10 | |
| Mortgages | 11.10 | |
| Income | High Yield | 8.33 |
| Senior Loans | 8.33 | |
| EM Local Debt | 8.33 | |
| Preferreds | 8.33 | |
| Stability | Investment-Grade Floating Rate Notes | 11.10 |
| Ultra-Short Treasurys | 11.10 | |
| Short-term TIPS | 11.10 | |
Three-Bucket Portfolio Profile versus the Agg
4. Seek More Income By Focusing on Risk Parity and Capital Efficiency
You can construct a diversified portfolio with elevated income potential and in a risk aware manner by combining two asset allocation concepts: 1) risk parity 2) capital efficiency.
Risk parity focuses on balancing the risk contributions of assets in a portfolio. And when determining portfolio weights, it focuses both on the asset’s volatility and correlations. While you can construct this portfolio using a model that focuses on expected risk, the portfolio below focuses on historical volatility and correlations (with a 12-month lookback). Because an asset’s marginal contribution of risk changes as the volatility profile of assets change, the weights listed below could change depending on the market environment.
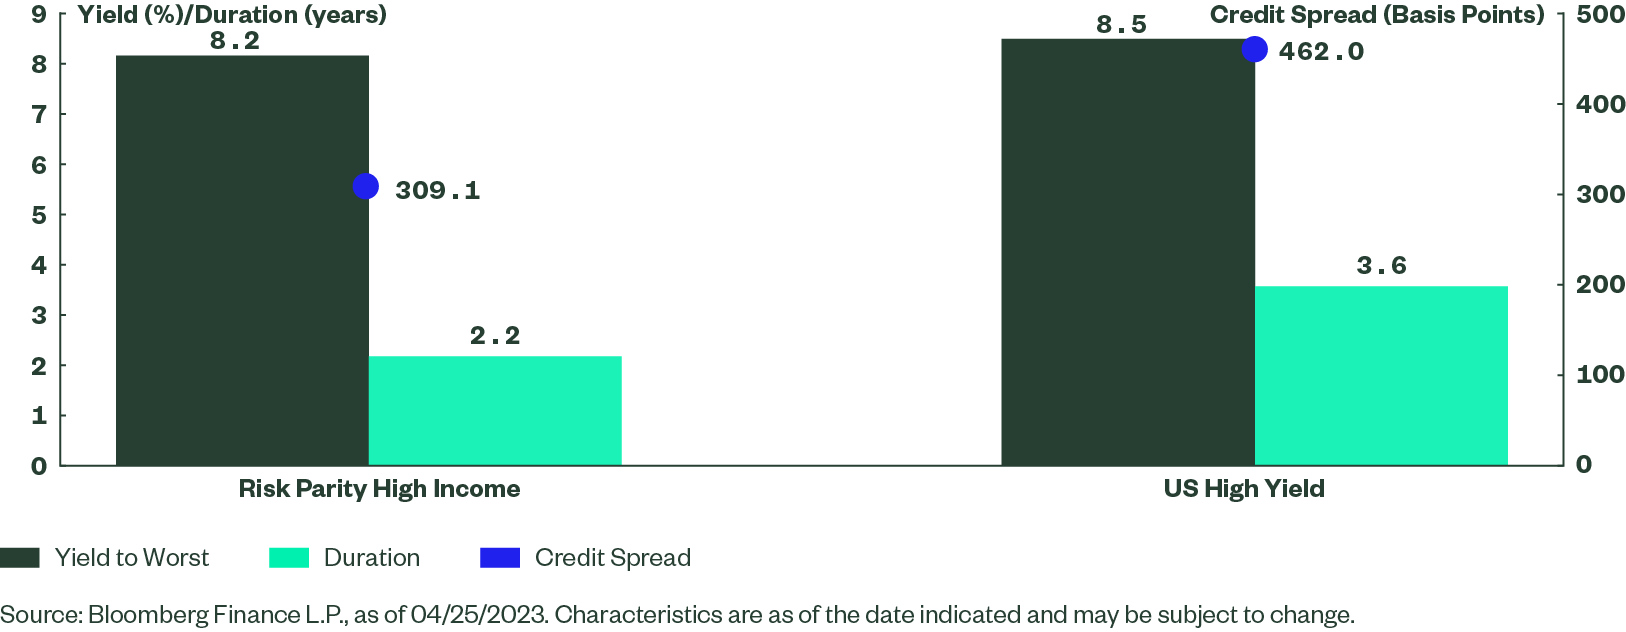
For today’s market, applying a risk parity approach to high-income sectors like EM local debt, global short-term high yield, US short-term high yield, and senior loans results in a portfolio with a yield of 8.19%, a duration of 2.20 years, and a credit spread well below that of a single fixed rate high yield exposure (309 versus 462) as shown below.
The portfolio also features greater sector diversity (and yield) than owning only high yield as an income-producing sleeve. From a risk model perspective, standard deviation is actually below that of a standalone high yield exposure (4.31% versus 6.82%). This is because some of these high-income sectors are not closely correlated and less volatile segments are weighted more heavily.
Risk Parity High Income Weights
| Portfolio | Weights (%) |
|---|---|
| Bank Loans | 30.00 |
| Preferreds | 9.20 |
| Short-term US High Yield | 18.20 |
| Short-term Global High Yield | 30.00 |
| EM Local Debt | 12.60 |
Risk Parity High Income Portfolio Profile versus US High Yield
While this portfolio’s profile is attractive, a pure high-income portfolio carries a high level of implicit equity risk. As such, it wouldn’t offer total portfolio diversification to the equity side of an allocation. If you want to try to maintain the intent of a high-income portfolio while efficiently balancing equity diversification, you can add long-term Treasurys.
Long-term Zero Coupon Treasurys (e.g., 25+ maturity STRIPS) have a duration of 27 years.4 Given that the Agg has a duration of 6.3, a 24% allocation to long-term Treasurys would provide a broader portfolio with the same dollar duration as a 100% allocation to the Agg.
The takeaway? Long-term Treasurys are a more capital efficient tool for basic bond diversification, i.e., you need less than one-third of the portfolio to obtain the same duration profile as broad core bonds.
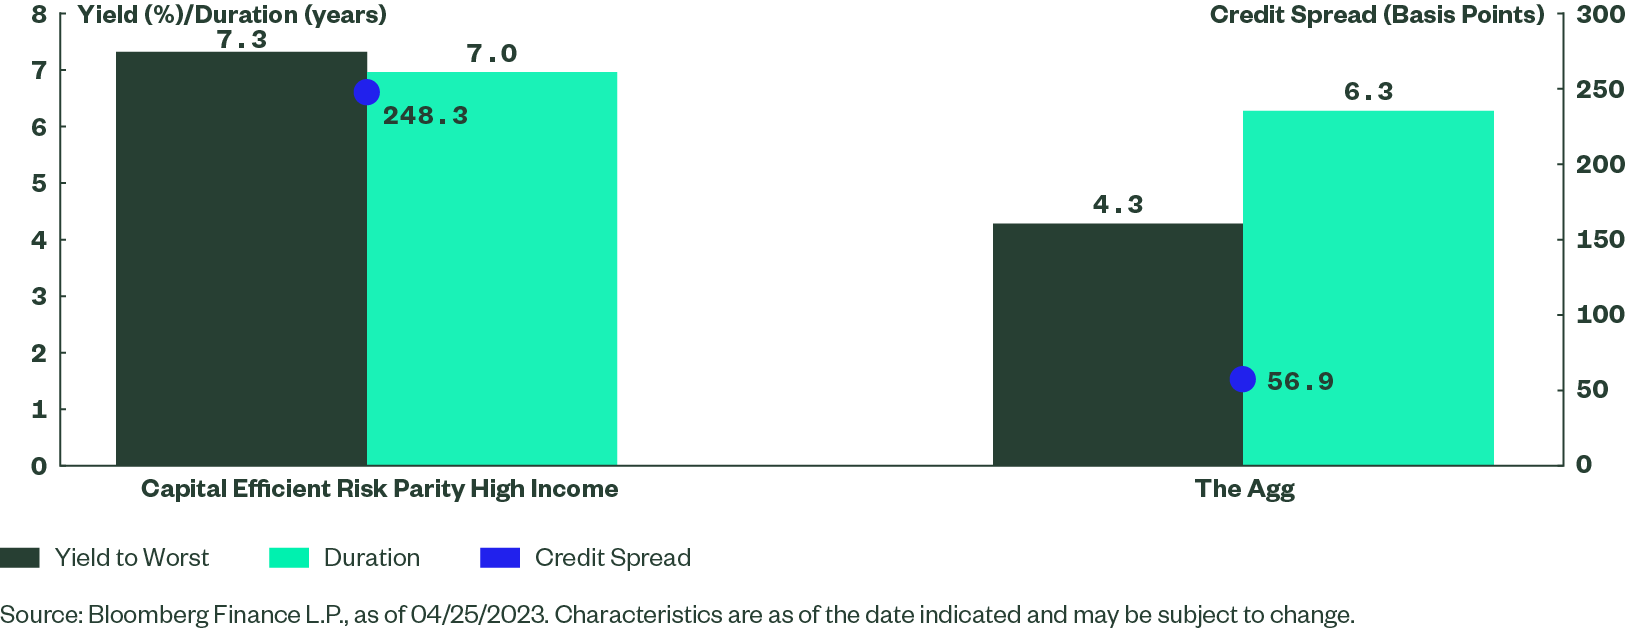
Given that the high-income risk parity portfolio has only two years of duration, a 20% and 80% split between long-term Treasurys and the risk parity high-income sleeve provides a similar level of duration (7.0 versus 6.3) as a 100% Agg exposure, but with a strong yield improvement as shown below. And, as far as implicit equity risk, the trailing 36-month beta to the S&P 500 Index of a capital-efficient risk parity high-income portfolio is 0.06 compared to 0.01 for the Agg.5
Capital-Efficient Risk Parity High-Income Illustrative Portfolio Profile versus Agg
Use Bond ETFs to Move Beyond the Agg in 60/40 Portfolios
While indexing to the Agg provides an off-the-shelf solution for broad fixed income exposure, it’s not always as simple as that. Investors’ risk constraints, return objectives, and tax considerations vary widely. Bond ETFs, including actively managed solutions, can be effective building blocks to help you go beyond what the Agg offers to rebuild your bond core in the traditional 60/40 portfolio.
If you’re looking to rebuild your core or explore new bond opportunities, check out our SPDR Bond ETFs.
Want timely data and insights to help you navigate bond markets? Get the latest outlook.