SPDR® SSGA US Sector Rotation ETF (XLSR) – Q4 2023 Commentary
For the fourth quarter, XLSR returned 10.90% on a NAV basis. The fund finished the quarter with overweights in Consumer Staples, Information Technology, Communication Services, Industrials and Energy.
Performance
The fund’s underperformance versus the benchmark was primarily driven by a targeted allocation to Energy with an underweight to REITs . The Energy sector fell significantly in the final months of the quarter as record production from US shale companies and concerns about future demand offset support from OPEC+ production cuts and resilient current demand which pushed the sector lower. REITs have been a persistent underweight due to poor price momentum and weak earnings sentiment in our quantitative models while the unstable commercial real estate outlook and rising rates for most of 2023 weighed on the sector. However, some softer economic data, combined with dovish commentary from Fed Chairman Powell and revisions to the economic projections, renewed optimism for a soft landing on the back of aggressive rate cuts projected from the Fed in 2024. This jubilance sent yields plunging and improved risk appetite in November and December,benefitting a beaten down REITs sector which finished up over 15%.
Fund Performance
| As Of | QTD (%) | YTD (%) | 1 Year (%) | 3 Year (%) | 5 Year (%) | 10 Year (%) | Since Inception Apr 02 2019 (%) |
|
|---|---|---|---|---|---|---|---|---|
| NAV | Dec 31, 2023 | 10.90 | 19.04 | 19.04 | 6.58 | - | - | 11.32 |
| Market Value | Dec 31, 2023 | 10.82 | 18.94 | 18.94 | 6.55 | - | - | 11.31 |
| S&P 500 Index | Dec 31, 2023 | 11.69 | 26.29 | 26.29 | 10.00 | 15.69 | 12.03 | 13.21 |
Source: State Street Global Advisors, as of December 31, 2023.
Past performance is not a reliable indicator of future performance. Investment return and principal value will fluctuate, so you may have a gain or loss when shares are sold. Current performance may be higher or lower than that quoted. All results are historical and assume the reinvestment of dividends and capital gains. Visit www.ssga.com for most recent month-end performance. Performance of an index is not illustrative of any particular investment. All results are historical and assume the reinvestment of dividends and capital gains. It is not possible to invest directly in an index.
Performance returns for periods of less than one year are not annualized. Performance is shown net of fees.
Index returns are unmanaged and do not reflect the deduction of any fees or expenses. Index returns reflect all items of income, gain and loss and the reinvestment of dividends and other income as applicable.
The market price used to calculate the Market Value return is the midpoint between the highest bid and the lowest offer on the exchange on which the shares of the Fund are listed for trading, as of the time that the Fund's NAV is calculated. If you trade your shares at another time, your return may differ.
Gross Expense Ratio: 0.70% Net Expense Ratio: 0.70%
The gross expense ratio is the fund’s total annual operating expenses ratio. It is gross of any fee waivers or expense reimbursements. It can be found in the fund’s most recent prospectus.
Portfolio Allocations
| Name | Target Weight (%) | Strategic Weight (%) | Active Tilt (%) | Change Since Beginning of Quarter (%) |
| The Technology Select Sector SPDR Fund (XLK) | 36.25 | 28.90 | 7.35 | 11.42 |
| The Consumer Discretionary Select Sector SPDR Fund (XLY) | 11.61 | 10.87 | 0.74 | -6.72 |
| The Financial Select Sector SPDR Fund (XLF) | 11.57 | 12.89 | -1.32 | 1.30 |
| The Consumer Staples Select Sector SPDR Fund (XLP) |
11.45 | 6.25 | 5.20 | 7.98 |
| The Communication Services Select Sector SPDR Fund (XLC) | 11.44 | 8.67 | 2.77 | 0.99 |
| The Industrial Select Sector SPDR Fund (XLI) | 9.47 | 8.36 | 1.11 | -1.74 |
| The Energy Select Sector SPDR Fund (XLE) | 4.43 | 3.92 | 0.51 | -0.69 |
| The Health Care Select Sector SPDR Fund (XLV) | 3.59 | 12.66 | -9.07 | -9.38 |
| The Materials Select Sector SPDR Fund (XLB) |
0.00 | 2.40 | -2.40 | -3.17 |
| The Utilities Select Sector SPDR Fund (XLU) | 0.00 | 2.41 | -2.41 | 0.00 |
| The Real Estate Select Sector SPDR Fund (XLRE) | 0.00 | 2.47 | -2.47 | 0.00 |
| Cash | 0.00 | 0.20 | 0.00 | 0.00 |
| 100.00 | 100.00 | 0.00 | 0.00 |
Source: State Street Global Advisors Investment Solutions Group, as of December 31, 2023. Portfolio allocations are as of the date indicated, are subjected to change and should be relied upon as current thereafter. This information should not be considered a recommendation to invest in particular sector or to buy or sell any security shown. The benchmarks weights indicated reflect the weight of custom benchmark. The "Custom Benchmark" is created by State Street Global Advisors and maybe different for different accounts.
Portfolio Positioning and Outlook
Looking back, 2023 brought many notable events for markets to navigate. Inflation moderated, but remained elevated and prompted central banks to continue aggressively tightening monetary policy. Economic growth in the US outpaced expectations, but disappointed elsewhere. The banking crisis in March was short lived, but was followed by S&P downgrading a list of banks over the summer. Bond volatility was high as inflation surprises, the repricing of expectations for the Fed Funds rate and massive bond issuances by the Treasury pushed yields higher before softer jobs data in Q4 sent yields tumbling. Looking forward, 2024 could be another turbulent year as global growth slows while heightened geopolitical tensions and rising debt levels challenge the resiliency of economies. Additionally, central banks will need to balance inflation risks with recession risks as they attempt to administer a soft landing.
In the near-term, our asset allocation outlook for early 2024 may not fit all that nicely into a bullish or bearish dichotomy. We’re bullish with respect to our equity allocations (where we are overweight).
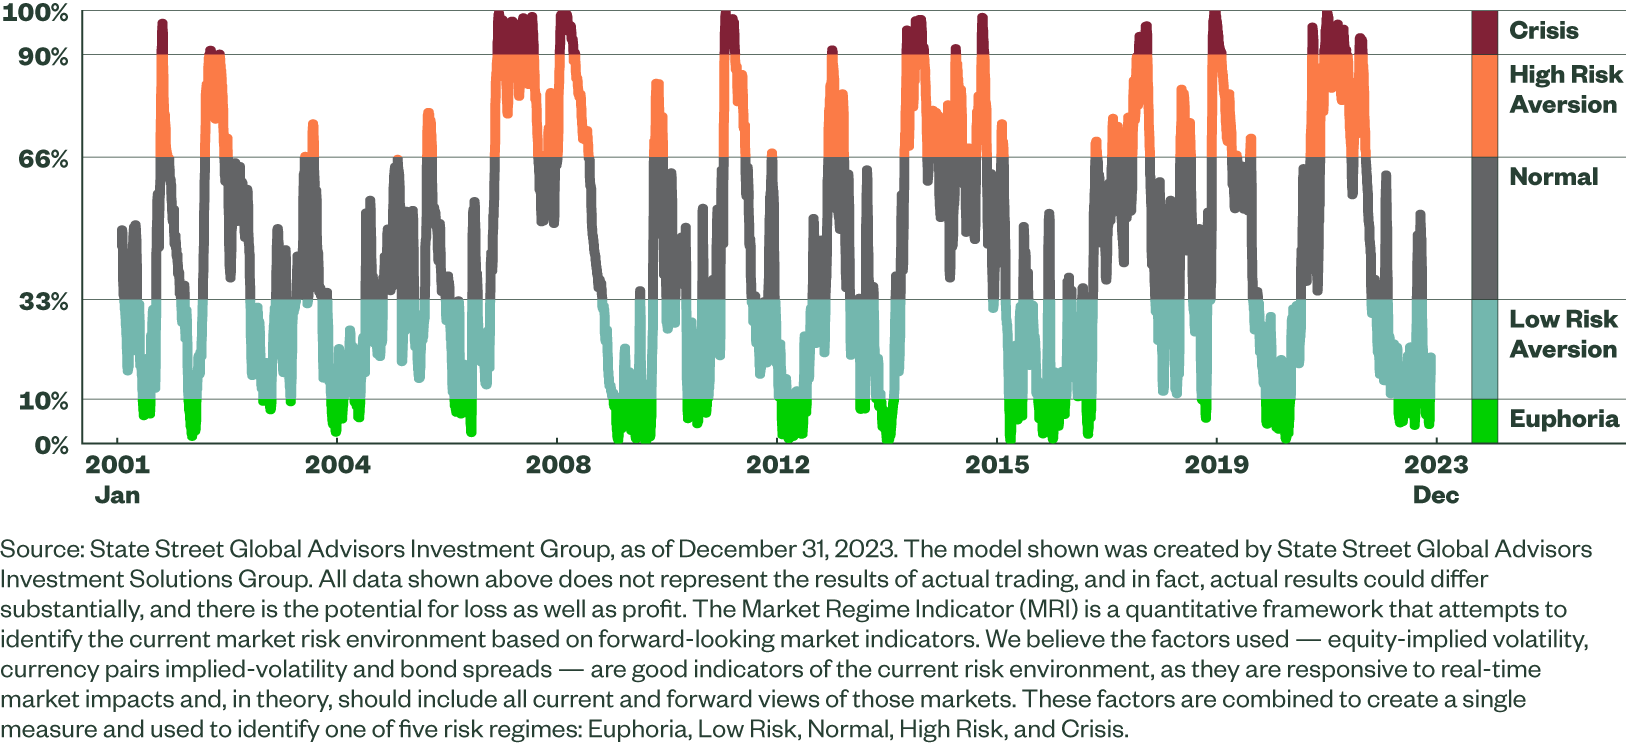
Viewed through the lens of our Market Regime Indicator (MRI), risk appetite has remained positive, but has pushed up against levels that suggest a degree of complacency has entered into market psychology. While this doesn’t suggest that risk-off allocations are the right answer, more moderate risk budgeting generally is effective in this type of environment and we enter 2024 with a meaningful, but less aggressive, equity stance. From a quantitative perspective, our equity research continues to point to a reasonably healthy backdrop for equity markets broadly. Comparatively low debt loads, still strong operating results, and a handful of valuation metrics that showcase fair valuations all point to further equity strength.
At the sector level, we currently favor Energy, Information Technology and Industrials. Energy is our top ranked sector, buoyed by solid balance sheet health, positive macroeconomic indicators, and attractive valuations. Information Technology is expensive based on valuations, but robust price momentum, analysts’ expectations for strong sales and earnings, and sturdy balance sheets buttress the sector. The improved forecast for Industrials was driven by better sentiment indicators and upgraded macroeconomic indicators. Additionally, the sector benefits from solid price momentum.
Market Regime Forecasts
The Market Regime Indicator (MRI) employs a quantitative framework and forward-looking market indicators, including equity- and currency-implied volatility, as well as credit spreads, to identify the current market risk environment. Tracking risk appetite shifts in the market cycle helps frame tactical asset allocation and volatility targets.
A Look at the MRI