2024 Gold Outlook: Can Turning Macro Tides Spur New Gold Highs?
Gold’s trajectory in 2023 surprised many investors as the metal remained resilient against traditional macroeconomic headwinds. Looking ahead to 2024, shifting monetary policy, an economic slowdown, and elevated volatility may create a positive environment for gold. Additionally, growing demand from fundamental factors exogenous to macroeconomic variables should continue to support gold.
Gold posted another resilient year in 2023, continuing to defy many investors’ expectations — both to upside and downside. Gold has risen 11.64% year to date1 and reached US$2,050/oz in May 2023, testing its all-time high of US$2,075/oz.2 Market volatility, geopolitical turmoil, and uncertainty across monetary and fiscal policy all helped push gold higher. Fundamental demand, from record central bank purchases to robust jewelry demand, also helped gold weather a challenging macroeconomic backdrop.
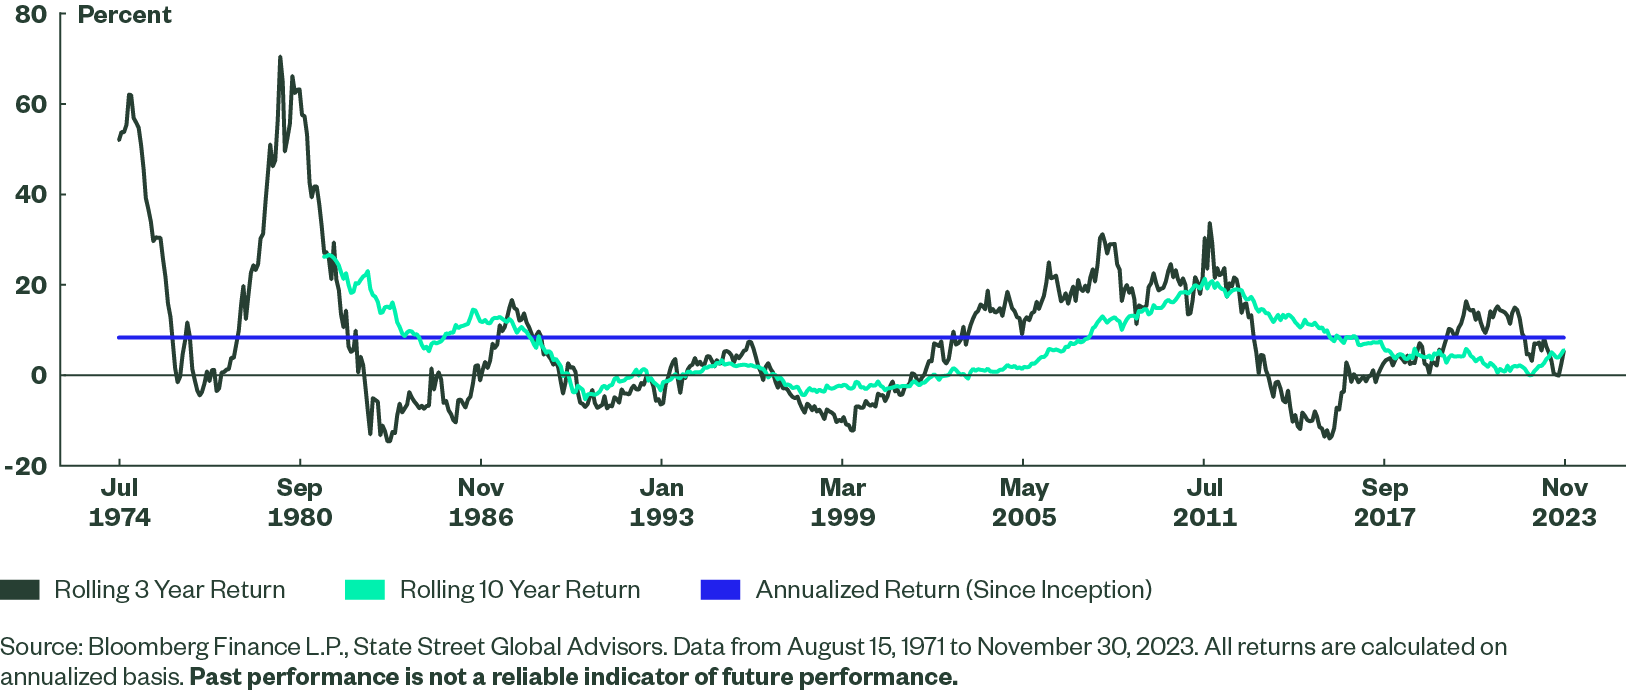
Putting gold’s 2023 performance in a longer-term context, both its trailing 3-year and 10-year returns indicate a potential bottoming relative to its track record. These trailing returns are below gold’s historical annualized return of 7.75%,3 indicating gold may have more room to run, both in the short term and over the longer term.
Figure 1: Longer-Run Performance Cycles May Indicate a Turning Point for Gold
Looking ahead to 2024, investors’ improving perception of gold4 could result in increased global demand and potential new highs. Overall, the outlook for gold may be buoyed by the turning of three macroeconomic tides:
- Dovish monetary policy, as US consumer-led economic growth slows and inflation stabilizes
- A softening US dollar (USD), as the global economy closes the gap to US growth and central bank gold buying continues
- Rising investor sentiment for gold amid heightened risks
Macro Tide #1: Shifting Monetary Policy Supports Gold
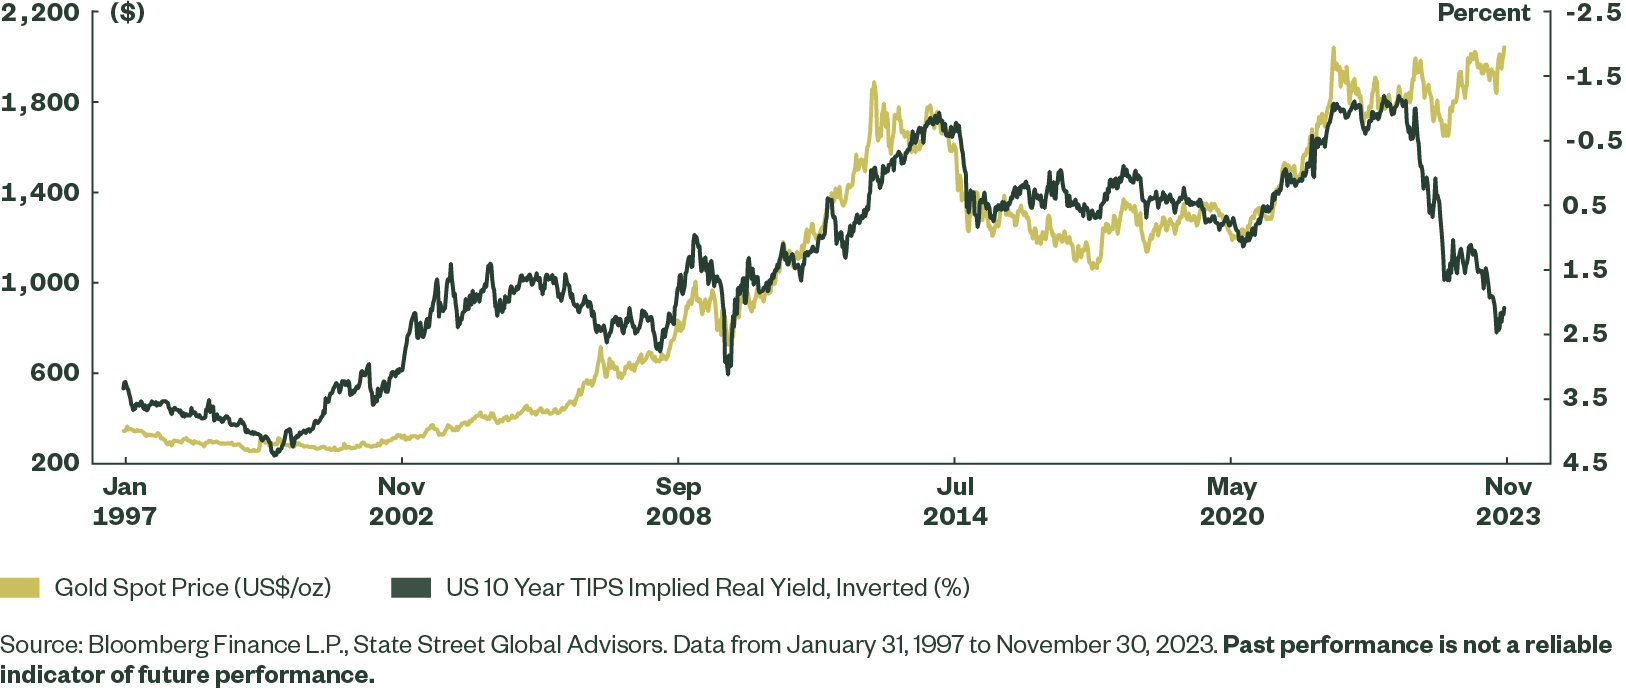
The biggest surprise for gold in 2023 was its continued resilience in the face of rising US real yields led by slowing inflation and higher nominal yields. The US 10-year Treasury yield exceeded 5% in 2023, its highest level since September 2007.5
Since the Federal Reserve (Fed) began its tightening cycle in March 2022, market implied real yields have risen over 350 basis points (bps),6 moving from negative to positive. Based on historical correlations, gold would have been expected to fare much worse than it did over this period. Instead, the gold market was steadied by record central bank gold purchases, increased market volatility, and geopolitical turmoil.
The resulting breakdown of the traditional inverse relationship between US real yields and gold was the largest dislocation on record7 (Figure 2).
Figure 2: Traditional Inverse Relationship Between Gold and Market-implied Real Yields Broke Down in 2023
As inflation levels have trended lower, stabilizing near long-term historical averages, the Fed’s impetus to continue to hike interest rates has largely been removed. In fact, market expectations are currently pricing rate cuts during the first half of 20248 — a potential boon for gold prices.
Despite strong US GDP data throughout 2023, signs of a slowdown to consumer-led growth add to the view that the Fed will begin to cut rates in 2024. Additionally as the impact of pandemic-era fiscal stimulus diminishes and the US savings rate begins to decline due to the current inflationary environment, the US economy may continue to slow with the risk of a recession still possible.
A shift to a more dovish Fed supports gold’s prospects. Gold’s relationship to the Fed funds rate has evolved over time. Since 1971, on average, gold has exhibited strongest performance during months when the Fed’s benchmark discount rate was actually rising, likely an indication of expected economic troubles that would spur gold buying. But gold has become increasingly linked and sensitive to US monetary policy changes since the implementation of zero interest rate policies (ZIRP) in 2008, during the Great Financial Crisis. Since that time, on average, gold has performed even stronger during months when the Fed funds rate is cut and worst during months with interest rate hikes9 — enhancing the inverse relationship between the direction of rates and gold’s price.
Given the anticipated monetary policy shift by the Fed, gold may strengthen throughout 2024.
Macro Tide #2: US Dollar Headwinds Could Benefit Gold
As interest rates on both a nominal and real basis crept higher in 2023, so too did expectations for the USD. But those expectations have so far failed to come to fruition. The greenback is flat year to date10 — dropping 9.48% from its 20-year high in 2022.11
Looking ahead, the USD’s outlook in 2024 is lukewarm. A scenario of interest rate cuts may spur demand for non-dollar currencies as interest rate spreads narrow globally. Additionally, the potential for US government shutdowns, fiscal policy debates, and political standoffs ahead of the 2024 US election cycle persist.
With growing debt burdens and fiscal deterioration having already led to a credit downgrade for the US this year,12 the potential for continued uncertainty on the fiscal policy front could create hurdles for the USD’s prospects. Meanwhile, the outlook of slowing growth or even recession could potentially weigh on the USD over the medium term.
Gold has had a historically negative average correlation to the USD of -0.37 since 1971.13 The current 12-month correlation between gold and the USD remains in line with this historical average. Given the outlook for a flat or weaker USD, gold could find support next year.
While a flight to safety from left-tail market events could bid up the USD in the short term, gold would likely synchronize alongside the greenback during such risk-off events given its role as a potential risk hedge. Furthermore, headwinds of lower rates, slowing growth, and threat of further US credit downgrades due to fiscal uncertainty would likely continue to weigh on the USD, potentially muting any sustained rallies from risk events over the medium term.
Continued gold buying by central banks, led by emerging markets, also may weigh on the USD’s prospects. As of September 30, 2023 the estimated year-to-date gold demand among global central banks is 800 metric tons (t). While below the record 1,082t for the full year 2022, that is still a staggering amount.14
Central banks’ continued purchasing of gold to diversify their reserves away from the USD and other reserve currencies may add more pressure for the greenback. While this is a gradual trend, it’s a strong potential catalyst for gold — especially as emerging market central banks’ share of gold reserve holdings is three times less than that of their developed market peers, on average.15
Macro Tide #3: Investors Turn Bullish on Gold as Volatility Rises
Sentiment among gold investors, particularly ETF investors, has been lackluster in recent years. Despite strong demand for physical gold bars and coins, global gold ETF flows in 2023 are on pace to post their third consecutive year of net outflows.16 Given gold’s price performance over this period, an interesting dislocation between the gold price and gold ETF flows has emerged.
Global gold ETF holdings from 2013 to 2015 declined -44% while the gold spot price dropped -37%.17 This gold bear market also coincided with a shift from quantitative easing to tightening and rising US real yields. Comparatively, since gold ETF holdings peaked in October 2020, net investor outflows dropped -22% while the spot price return increased +6.7%.18
This dislocation, wherein gold ETF holdings are liquidated against a neutral gold price environment, is fairly unique in context to the track record of gold ETFs. This can be partly explained by rising yields attracting yield-chasing investors, alongside tremendous central bank gold purchases in 2022 and 2023 and robust demand among gold consumers for jewelry.
Given gold’s resilience to date, if investors do return to the gold market, it would narrow this dislocation and the correlation between the gold spot price and ETF flows would revert back to historical levels. This could prove a powerful tailwind, as investor buying synchronizes with central bank buying to potentially drive gold prices higher.
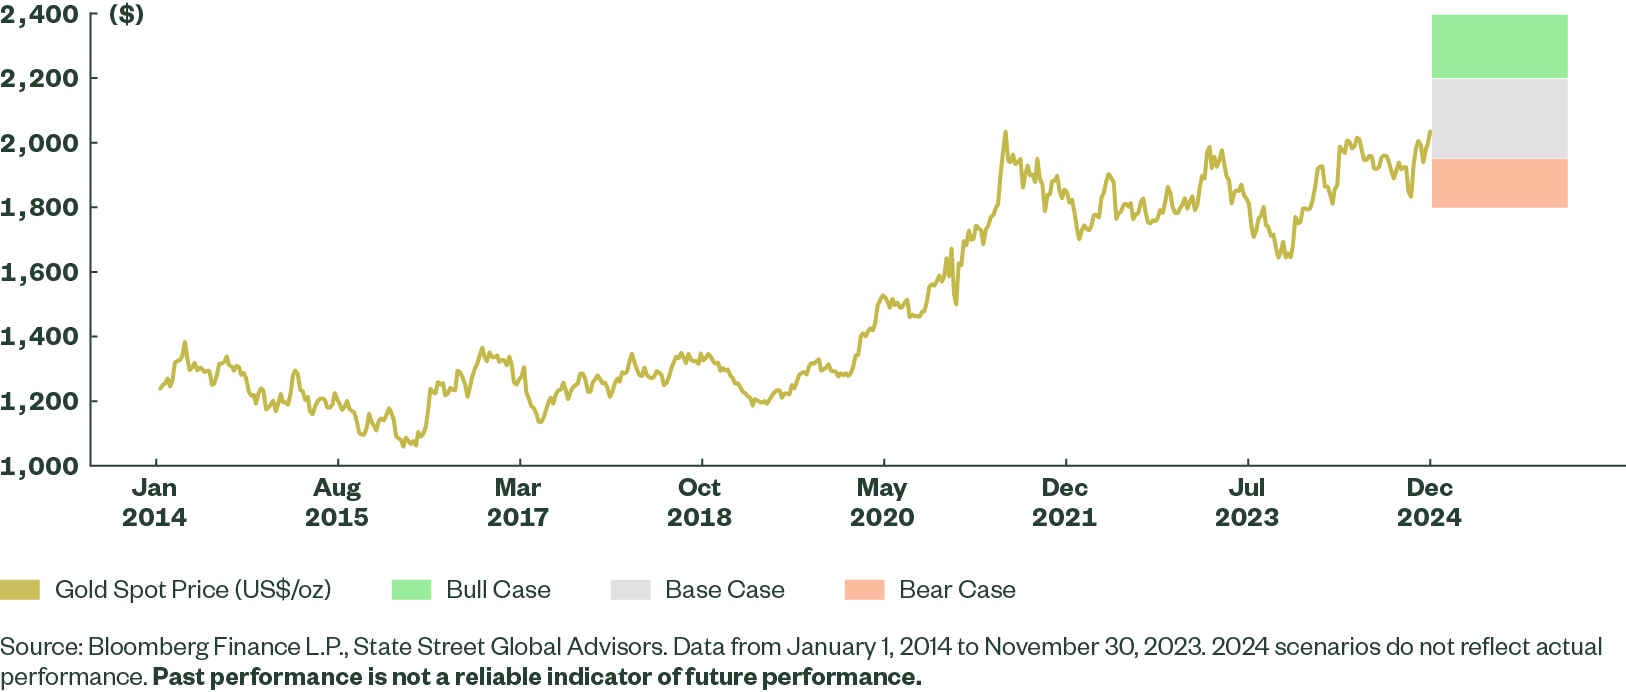
2024 Gold Outlook Potential Scenarios & Trading Ranges
- Base Case (50% Probability): Gold sees a potential trading range between US$1,950/oz and US$2,200/oz. Under this scenario, global and US growth slow while avoiding a recession, the USD is flat to slightly down in response to limited number of rate cuts by the Fed, and interest rates remain “higher for longer.” Consumer demand for gold in emerging markets remains steady, supported by the continued robust gold buying from central banks.
- Bull Case (30% Probability): Gold sees a potential trading range between US$2,200/oz and US$2,400/oz. Under this scenario, the US experiences an economic recession with significant interest rate cuts by the Fed and a weaker USD. Market volatility increases, sparking strong investment demand for gold. China enacts a stimulus program to trigger consumption and offset weak growth — and that triggers a flight to safety which benefits gold purchases in the form of jewelry, bars, and coins.
- Bear Case (20% Probability): Gold sees a potential trading range between US$1,800/oz to US$1,950/oz. Under this scenario, the US and global economies exhibit expansionary growth. In the US, the Fed hikes rates to tamp down rising price and wage inflation from tightening labor markets. Lower market volatility reduces investment demand for gold. A resulting stronger USD increases the price of gold internationally, but emerging market consumer demand for jewelry, bars, and coins remains healthy, supported by rising inflation and weakening currencies.
Figure 8: Outlook for Rate Cuts and Slowing Growth Alongside Robust Fundamental Demand May Push Gold Higher in 2024
How to Add Gold to Portfolios in 2024
Compared to other major global asset classes, gold fared quite well in 2023 — particularly against global bonds and broad commodities, despite elevated yields and commodity prices. Looking ahead to 2024, gold could serve a key utility to mitigate the impact of these growing market risks on portfolios:
1. Protect Against Equity Volatility with Gold
The possibility of greater equity volatility in 2024 remains elevated, with potential market drawdowns stemming from stretched equity valuations and stocks “priced for perfection,” geopolitical tensions, and commodity volatility. Gold may provide significant portfolio protection as a risk management tool in a heightened risk environment. This was the case in 2023, when gold aided in buffering against rising market volatility from the US regional banking crisis, the emerging Israel-Hamas war, and the ongoing Russia-Ukraine war.19
Historically, gold has exhibited positive weekly returns on average during periods of extreme levels of implied equity market volatility.20 Against an increasingly uncertain market and economic backdrop, investors may consider enhancing gold allocations in portfolios to compensate for the elevated risks ahead.
2. Bolster Portfolio Diversification Against Rate Volatility with Gold
Investors seeking to increase portfolio diversification against equity risk exposures during a falling interest rate environment often turn to bonds. Gold offers another diversification option, one that also provides diversification of bond allocations, particularly during heightened interest rate volatility.
When evaluating monthly changes to US real interest rates, gold historically has averaged a slightly higher return than US bonds. Additionally, for moderate rate moves (less than 50 bps higher or lower), gold has outperformed bonds on average, while gold and bonds have performed similarly for extreme decreases (greater than 50 bps) in real yields.21
Given the similar historical performance and gold’s historically low correlation to bonds as well as equities,22 investors may benefit from gold positions, particularly in anticipation of lower rates.
3. Blend Gold with Natural Resource Equities to Position Against Sticky Inflation
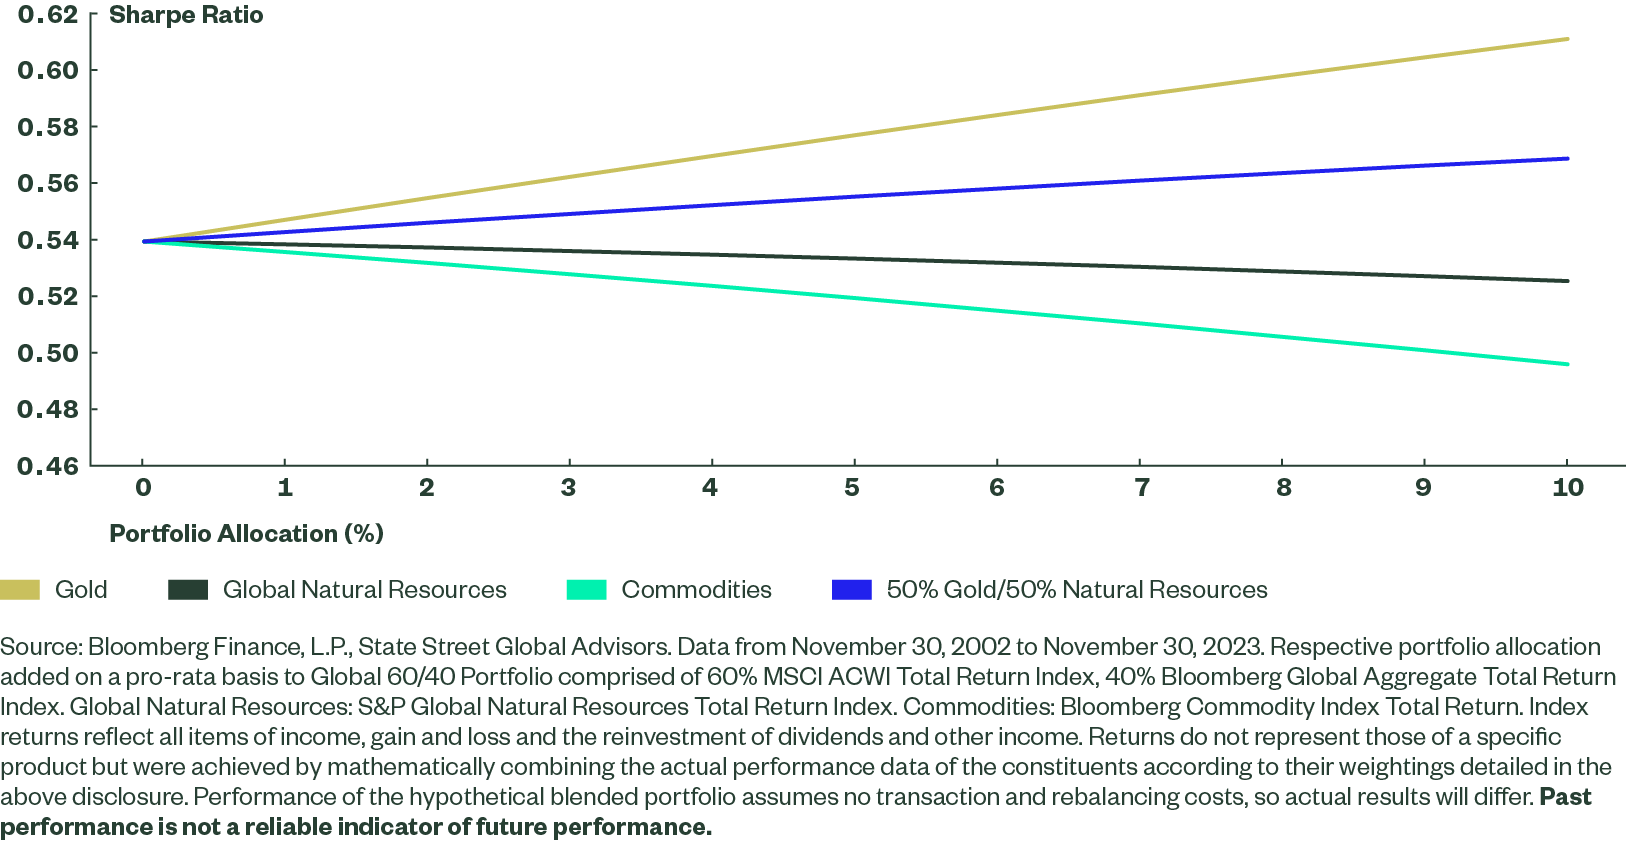
While inflation has trended lower from multi-decade highs, price levels may remain sticky into 2024. The combination of gold with natural resources could be an attractive option for portfolios, because it may also improve a diversified portfolio’s Sharpe ratio.
Gold’s diversification and risk-management characteristics, coupled with the inflation-sensitive characteristics of natural resources, show improved Sharpe ratios, whether allocations to this mix are a percent or two or perhaps more. Gold may not carry a high sensitivity to broad price inflation, but it does provide protection against another form of inflation — monetary inflation — by protecting against currency depreciation and loss of purchasing power over time.23
A standalone gold allocation historically has exhibited a higher Sharpe ratio for the period evaluated (2002-2023),24 however the higher inflation beta from including natural resources may prove valuable against a backdrop of inflation volatility. Additionally, including gold has provided a more efficient option than global natural resources or commodities alone, which historically have exhibited a drag against a portfolio’s Sharpe ratio across various allocations.25
Figure 12: Combining Gold With Natural Resources Provides an Improved Sharpe Ratio With Inflation Protection
Get more insight on gold.