Debunking 5 ETF myths about liquidity
- When it comes to what a fund costs, expense ratios don’t tell the whole story—they’re just the beginning. Bid-ask spreads, rebalancing costs, and the timing of trades all go into your total cost of ownership (TCO).
- Trading volume is the tip of the iceberg: Look below the surface at factors like an ETF’s underlying holdings, size, and primary market where shares are created and redeemed on demand.
- How you trade matters as much as what you trade: The right order type, timing, and trade execution can all make a big difference in what you actually pay.
Solids keep their shape. Gases drift away. And liquids? They flow.
In investing, flow (i.e., liquidity) is very important.
Liquidity refers to how easy it is to turn your investment into cash without getting shortchanged on the price. For individual stocks, that depends on supply and demand. It’s like a grocery aisle with limited shelf space: crowd favorites fly off the shelves, while slower movers might need to be marked down to finally sell.
While ETFs trade like stocks, they work a little differently. When demand rises, new shares can be created. When it falls, shares can be redeemed. That flexibility helps keep trading smooth, even when markets are choppy.
Still, there are plenty of myths about liquidity and what investors should look for. Let’s clear the air by breaking down five of the biggest misconceptions.
5 myths we’re debunking:
Who keeps the system running?
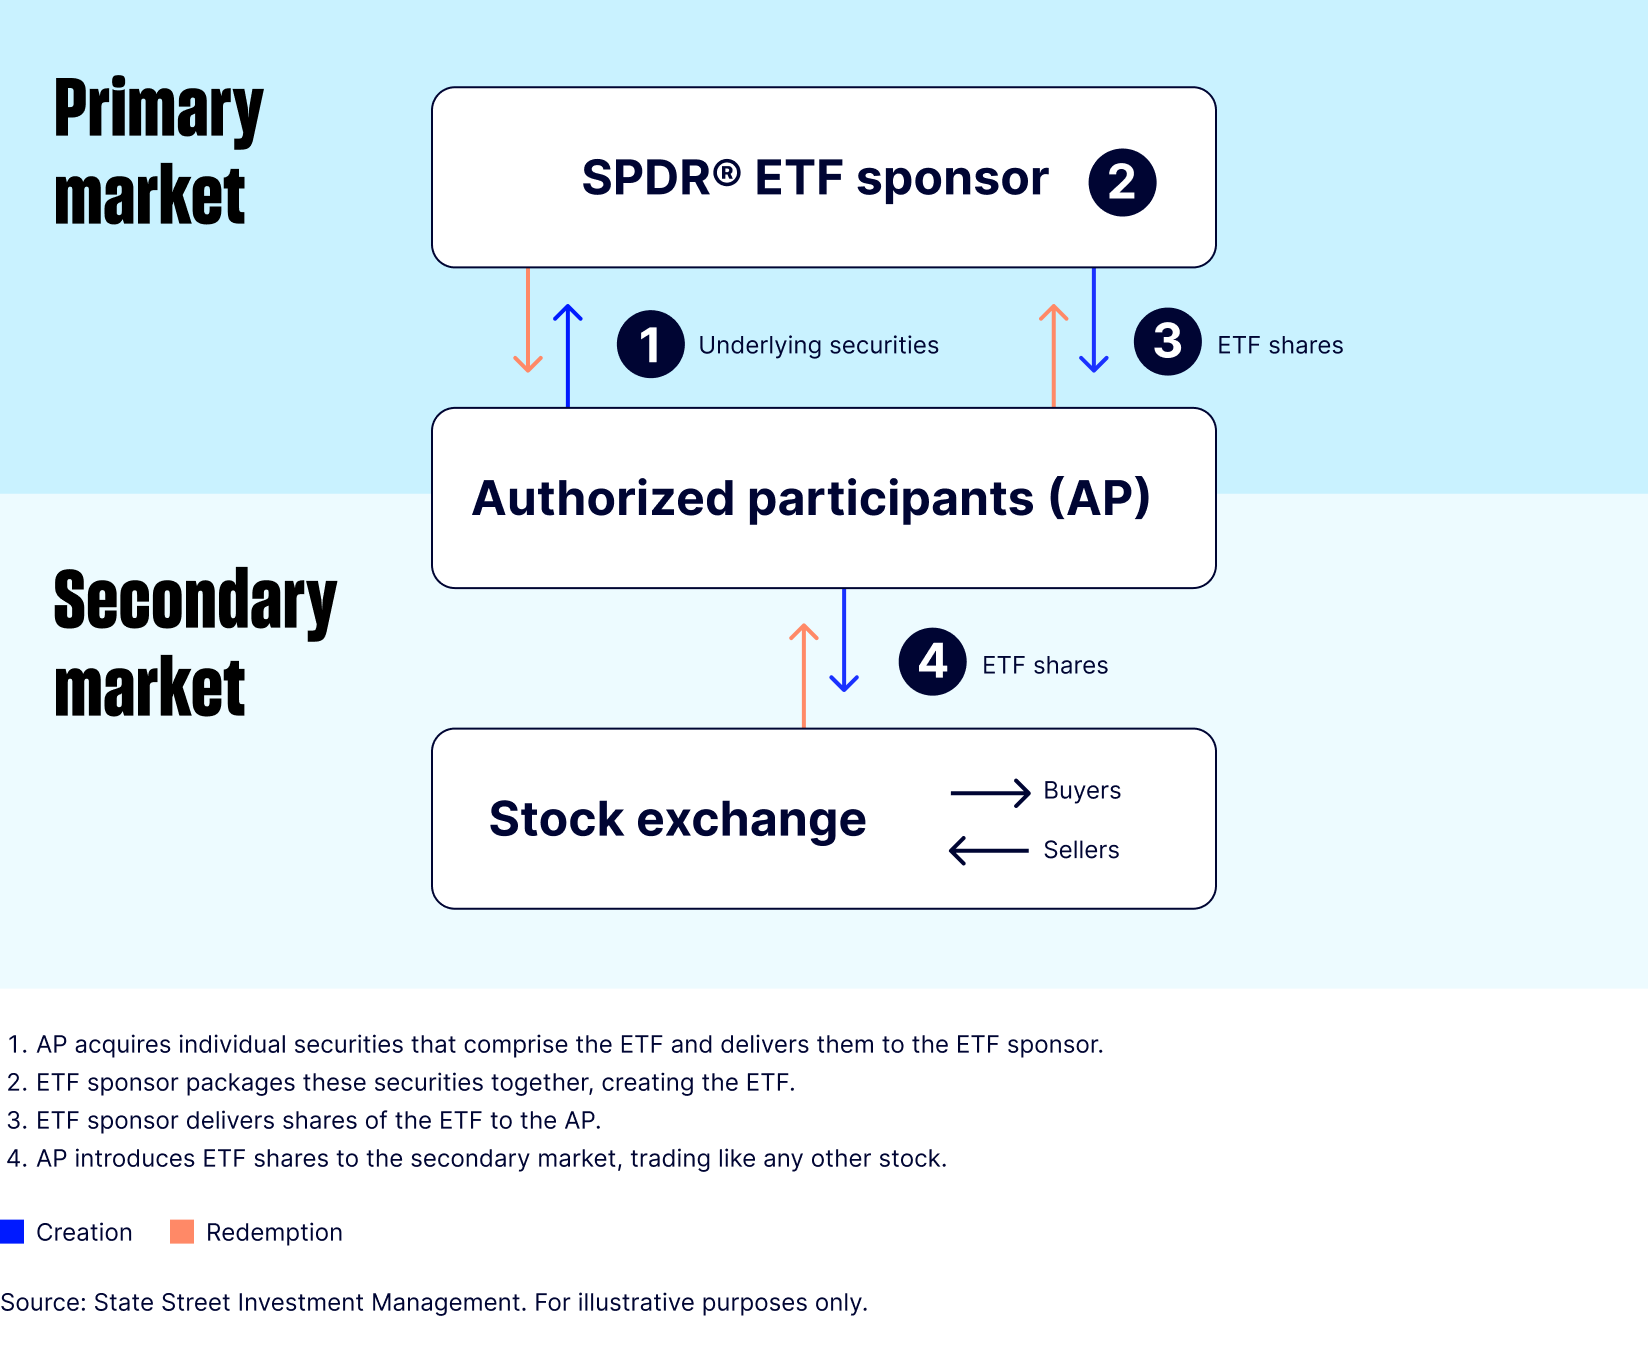
Behind the scenes, authorized participants (APs) and market makers make sure ETFs trade the way they’re meant to. When demand rises, they create new shares. When it falls, they redeem them. This process keeps prices stable and trading smooth for investors.
Figure 1: The ETF’s creation and redemption process
Myth 1: ETFs with the lowest expense ratios have the lowest costs
Fact: Expense ratios are just one piece of the puzzle.
Everyone loves a bargain, especially in investing. But choosing an ETF based solely on its expense ratio is like buying a car because of a cheap sticker price—then realizing it gets three miles a gallon and only takes diesel.
ETFs have other expenses, including:
- Bid-ask spreads: The difference between what buyers are willing to pay and what sellers are willing to accept. Typically, the wider the spread, the higher the ETF’s cost.
- Rebalancing frequency: Funds that reshuffle holdings can often rack up trading costs each time, adding to the cost.
- Trade size and timing: A large order in a thinly traded market can eat into returns.
Together, these costs make up a fund’s total cost of ownership (TCO). They matter most for active traders or those investing large amounts—but even buy-and-hold investors should understand the full picture before choosing an ETF.
How can you analyze the true cost of owning an ETF?
Figure 2: Bid-ask spread versus expense ratio for the 100 largest ETFs focused on US equities

Myth 2: Trading volume is the most important aspect of an ETF’s liquidity
Fact: ETFs have layers, just like an iceberg.
Trading volume only tells you what’s happening in the secondary market—investors buying and selling shares on an exchange. But there’s another layer: primary markets, where new shares are created or redeemed by APs to meet investor demand.
Let’s come back to our iceberg analogy: the activity you see on-screen is only the tip you see above the surface. The much larger portion—the creation and redemption process—sits below the waterline, out of sight but central to how ETFs trade.
That’s also why newer or active ETFs can appear “less liquid” at first glance. Their trading volumes may be smaller, but the structure underneath still gives them plenty of flexibility. And as adoption grows, those bid-ask spreads tend to tighten right alongside their passive peers.
Take a deeper dive into the creation/redemption process—and discover how it can benefit investors’ portfolios.
Myth 3: All ETF trade execution is the same
Fact: How you trade matters just as much as what you trade.
Unlike mutual funds, ETFs give you a choice in how you trade. Think of it like online shopping. You can click “buy now” and pay the listed price. Or you can shop around, look for discounts, and hopefully find a better deal.
That’s the beauty of strategic trade execution—it helps you get the best possible price for the same investment.
Pay attention to:
- Order type: A market order executes right away, while a limit order lets you set your price and avoid unwanted surprises.
- Timing: The middle of the trading day is usually the sweet spot for liquidity. Early and late sessions may be more volatile.
These might seem like trivial details, but they can materially affect what you pay (or get paid) for your trade. Because whether you’re shopping for sneakers or securities, it always helps to know how and when to check out.
Want to know more? Master the mechanics of ETF trading.
Myth 4: Larger ETFs are always easier to trade
Fact: With ETFs, size isn’t everything. What’s inside (or, the ETF’s holdings) can matter more.
At first glance, it seems obvious: a $10 billion ETF must be more liquid than a $500 million one, right?
Not necessarily.
Size doesn’t determine liquidity. The underlying securities do. If the holdings are liquid, the ETF will be liquid too. A massive bond ETF that owns thinly traded debt can actually be less liquid than a smaller fund tracking large-cap US stocks.
That’s why active ETF issuers often build liquidity screens into their processes to avoid illiquid securities. Their flexibility to rebalance means they can exit less-traded names more quickly than a passive fund tracking a fixed index.
Bullish on a specific stock, sector, or country? Explore our ETFs using our Find ETFs by Holdings tool.
Myth 5: ETF liquidity boils down to one single number
Fact: Liquidity isn’t two dimensional. There are multiple numbers and perspectives to consider.
Many investors fixate on average daily trading volume to judge how easy an ETF is to trade. Helpful, yes, but incomplete.
Think of it like assessing a restaurant by how full the parking lot is. It might suggest popularity, but it doesn’t tell you whether the food’s good, the service is fast, or the prices are fair. The same goes for liquidity. Trading volume is one clue, but to understand how efficiently an ETF trades, you’ll want to consider a few key details together:
- Bid-ask spreads: Real-time clues about trading costs.
- Assets under management (AUM): Larger funds tend to be more liquid, though there are exceptions.
- Underlying holdings: If the ETF owns hard-to-trade security, that can affect its liquidity no matter how big the fund is.
And when it comes to average daily volume, make sure to look across multiple periods, not just short timeframes.
Figure 3: A quick comparison of standard ETF liquidity metrics
| Metric | What it measures | Limitation | When to use |
|---|---|---|---|
| Average daily volume | How many shares trade each day | Fluctuates and doesn’t capture full liquidity due to creation/redemption | As a starting point to gauge typical trading activity |
| Bid-ask spread | Cost of entering/exiting a trade | Widens in volatile markets or for large trades | Before placing a trade to estimate what you’ll actually pay |
| Assets under management (AUM) | Size of the fund | Doesn’t guarantee liquidity of underlying holdings | To assess fund stability and scale |
It pays to look beyond on-screen liquidity.
Making sense of ETF liquidity
ETF liquidity isn’t always obvious, and it’s definitely not as simple as a single number on your screen. By looking beyond the myths, you’ll have a clearer view of how ETFs really trade, what it costs to own them, and how to use them effectively in your portfolio.

Level up your ETF learning
Knowledge is the foundation of long-term success. Our ETF Education Hub is your one-stop resource for understanding how ETFs work and how to use them in your portfolio.