Will a New March Surprise Sour ETF Investor Sentiment?
February ETF flows and market returns were like the first leg of the round of 16 in the 2024 UEFA Champions League tournament. Interesting, but no dazzling displays or tense moments.
Just as many of the UEFA tournament favorites looked like they were just trying to make it to the second leg and saving the excitement for then, investors seem to be looking ahead to a pivotal March “leg.” The month will feature Super Tuesday, a crucial Federal Reserve (Fed) meeting after the recent reset of 2024 rate cut forecasts from five to three,1 and an air gap of fundamentals as 98% of firms have already reported.2
But like Lazio beating Bayern in the first leg of this year’s UEFA round of 16, the month of March has been marked by surprises over the past few years. In 2020, it was the pandemic. 2021 featured the Reddit meme stock craze. 2022 saw war in Ukraine. And in 2023 we endured the mini regional banking crisis.
Could a new March surprise derail 2024’s strong start?
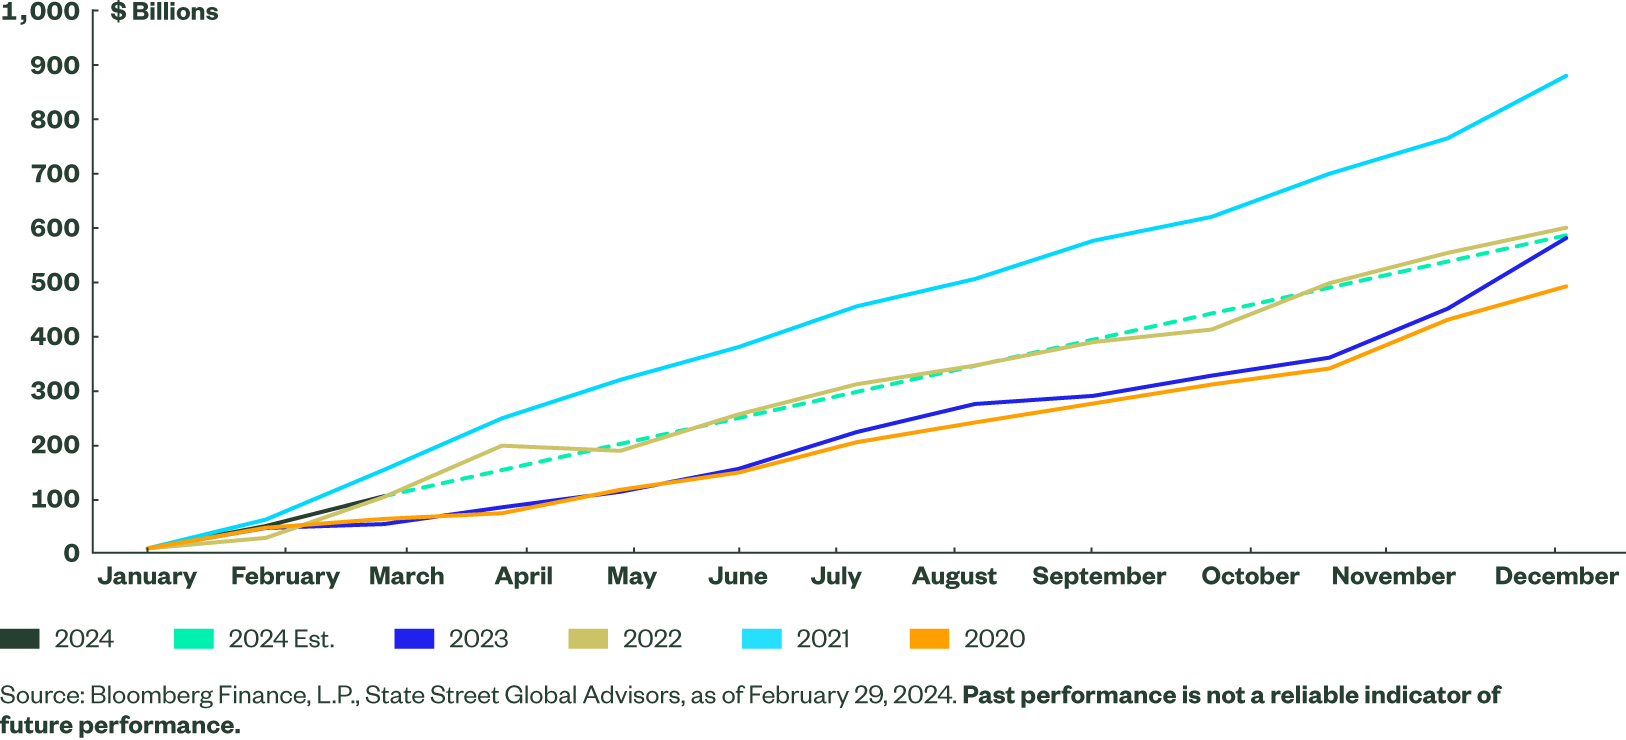
ETFs on Pace to Hit $600 Billion in 2024, with Active Adding $200 Billion
February’s $56 billion of inflows pushed 2024’s two-month total to $100 billion — an average of $50 billion a month. If this pace holds, a $600 billion full-year total is possible.
Of course, you can’t forecast a full year based on just two months. But 2024 is off to a better start than most recent years, except 2021 (Figure 1).
And this current trajectory could accelerate if the mountain of cash allocated to money market mutual funds over the past year (+$1 trillion)3 is deployed once the Fed starts lowering rates — and the returns on those ultra-short duration exposures decline. In that situation, investors are likely to choose ETFs for their tax- and cost-efficiency across a large variety of strategy types and investment focuses.
Figure 1: ETFs on Pace for $600 Billion
So far, active ETFs are driving 2024’s pace. After January’s record of $20 billion in inflows, active ETFs added $18 billion in February, second all-time for the category. Using active ETFs’ monthly average of $15 billion over the past eight months to forecast inflows for the remainder of the year, there is a real chance active ETFs could take in close to $200 billion in 2024.
Equity ETFs: Risk-on, Global Positioning
Equity funds took in $38 billion while bonds registered only $12 billion, dragged down by $2 billion of outflows in short-term government bond ETFs. There likely was some profit taking in high yield (-$1 billion of outflows) while active bond ETFs were a bright spot with a record $6 billion.
Over the past 90 days, equity funds took in $108 billion more than bonds did (Figure 2). While dipping slightly, this rolling 90-day differential is still above the 90th percentile. This risk-seeking behavior is underscored by equity funds posting a record 22 consecutive months with inflows.
US exposures led equity flows in February, but not relative to their asset base. The $30 billion of inflows equated to 0.57% of their start-of-month assets. Meanwhile, the combined non-US equity ETFs’ $9 billion was 0.80% of their start-of-month assets.
Investors adding more than usual to their non-US allocations seems designed to help increase portfolio diversification in response to how concentrated the market has become.
Developed ex-US ETF exposures led the non-US segments in notional terms, taking in $3.4 billion — their 44th consecutive month with inflows. Single-country strategies had the next largest, taking in $2 billion. Those flows were led by $1 billion each into Japan and India. Meanwhile, China-focused ETFs took in $300 million as that market rallied over 8% in February on the hope for reforms to boost the economy.4
Figure 3: Geography Flows Show Higher Relative Interest Overseas
| In Millions ($) | February | Year to Date | Trailing 3 Mth | Trailing 12 Mth | Prior Month Flows (% of AUM) |
|---|---|---|---|---|---|
| U.S. | 29,536 | 45,783 | 130,586 | 356,470 | 0.57% |
| Global | -562 | 82 | 1,363 | 3,298 | -0.30% |
| International-Developed | 3,416 | 6,696 | 17,103 | 48,126 | 0.50% |
| International-Emerging Markets | 1,463 | 2,458 | 7,427 | 9,175 | 0.62% |
| International-Region | 1,578 | 1,490 | 2,101 | -3,907 | 2.11% |
| International-Single Country | 1,956 | 2,973 | 5,656 | 8,039 | 1.89% |
| Currency Hedged | 989 | 1,762 | 1,802 | 4,885 | 5.24% |
Source: Bloomberg Finance, L.P., State Street Global Advisors, as of February 29, 2024. Top two/bottom two categories per period are highlighted. Past performance is not a reliable indicator of future performance.
Chasing Momentum in Sectors
Without the $6 billion inflow for Tech, sectors would have had outflows in February. This is the second month in a row that Tech’s return and earnings-per-share (EPS) trends lifted the broader category. At the end of the month, Tech ranked first on pure momentum scores, and nearly 90% of the firms beat Q4 2023 earnings expectations while witnessing the largest upgrade to 2024 EPS estimates.5
Consumer Discretionary, another sector with outsized returns last month (+7.6%), ranked third on pure momentum scores and had the second-most inflows (+$1.8 billion).6
Communication Services, the second-ranked sector on momentum scores, mustered $200 million of inflows.7
With the top three momentum ranked sectors witnessing a combined $8 billion of inflows in February, sector investors are clearly momentum chasers.
Figure 4: Sector Flows Favor Momentum Plays
| In Millions ($) | February | Year to Date | Trailing 3 Mth | Trailing 12 Mth | Prior Month Flows (% of AUM) |
|---|---|---|---|---|---|
| Technology | 5,860 | 8,719 | 7,066 | 17,004 | 2.41% |
| Financial | -1,405 | -1,387 | 77 | -2,252 | -2.06% |
| Health Care | 501 | 781 | -819 | -7,589 | 0.52% |
| Consumer Discretionary | 1,849 | 1,478 | 2,629 | 6,803 | 5.20% |
| Consumer Staples | -762 | -1,106 | -2,248 | -4,877 | -2.88% |
| Energy | -966 | -1,530 | -2,721 | -6,310 | -1.26% |
| Materials | -720 | -708 | -1,558 | -4,661 | -2.16% |
| Industrials | 442 | 443 | 513 | 1,066 | 1.07% |
| Real Estate | -320 | 123 | 2,209 | 1,180 | -0.44% |
| Utilities | -603 | -1,659 | -1,434 | -2,526 | -2.96% |
| Communications | 204 | -240 | 714 | 3,696 | 0.92% |
Source: Bloomberg Finance, L.P., State Street Global Advisors, as of February 29, 2024. Top two/bottom two categories per period are highlighted. Past performance is not a reliable indicator of future performance.
March Could Bring Challenges
The Fed meeting is the most likely catalyst for a March surprise.
S&P 500 forward implied volatility term structure spikes at the FOMC’s March 20 meeting.8 That’s when the market will find out how real the renewed hawkish stance is and how Fed officials interpret the recent strong macroeconomic data (+3.3% 2023 GDP growth that beat expectations).9
The November 2023 FOMC meeting when the Fed pivoted to a more dovish stance ignited the recent rally. Even a slight pivot back to hawkish rhetoric at the March 2024 meeting could walk all of that back — stoking both rate and equity volatility.
Positioning for what could be another tumultuous March doesn’t mean playing only defense or exiting the market. Remember that equity returns were positive in three of the four years following the “March Surprise.” Ensuring portfolios are resilient by moving up in quality in equities while balancing bond duration risks may help investors get beyond whatever March has in store.
Check out Market Trends for more insight into ETF flows, the latest charts and scorecards, and new investment ideas.