SPDR® Blackstone Senior Loan ETF (SRLN) – Q4 2023 Commentary
Fixed income asset classes experienced positive returns in the fourth quarter. SRLN returned 3.0%, outperforming the Markit iBoxx USD Liquid Leveraged Loan Index by 48 basis points (bps).1
Performance
SRLN outperformed the Markit iBoxx USD Liquid Leveraged Loan Index due to its credit selection within its loan allocation. The Fund’s high yield bond allocation was a positive contributor to returns as bond returns outperformed loans during the quarter.
The top contributors to total return in the fourth quarter were Asurion, Cloud Software Group, and Allied Universal. The top detractors were Cineworld, Quest Software, and Carestream Health.
Retail loans experienced modest net demand during the quarter with loan mutual funds and ETFs posting $0.4 billion in net inflows.2 SRLN experienced net inflows totaling $817 million in the fourth quarter.3
| Top 10 Holdings | Coupon | Maturity Date | Weight(%) |
|---|---|---|---|
| PERATON CORP | 9.1983 | 2/1/2028 | 1.81 |
| MEDLINE BORROWER LP AKA MEDLINE INDUSTRIES | 8.4627 | 10/23/2028 | 1.72 |
| ATHENAHEALTH GROUP INC. | 8.5983 | 2/15/2029 | 1.71 |
| NEW RED FINANCE, INC. AKA BURGER KING 1011778 B.C. ULC/ RESTAURANT BRANDS |
7.5982 | 9/23/2030 | 1.63 |
| CLOUD SOFTWARE GROUP INC AKA BALBOA/CITRIX | 9.99 | 3/30/2029 | 1.57 |
| MCAFEE CORP | 9.1928 | 3/1/2029 | 1.56 |
| HUB INTERNATIONAL LTD | 9.6619 | 6/20/2030 | 1.35 |
| ALLIED UNIVERSAL HOLDCO LLC AKA USAGM | 9.1983 | 5/12/2028 | 1.32 |
| IRB HOLDING CORP. AKA ARBY'S/INSPIRE BRANDS | 8.4483 | 12/15/2027 | 1.29 |
| GAINWELL ACQUISITION CORP. AKA MILANO | 9.49 | 10/1/2027 | 1.25 |
As of December 31, 2023, the top ten holdings accounted for 15.21% of the fund’s investments. The Fund Top Holdings are as of the date indicated, are subject to change, and should not be relied upon as current thereafter.
Fund Performance
| Ticker | Name | YTD | Annualized | Inception Date | Gross Expense Ratio | ||||
|---|---|---|---|---|---|---|---|---|---|
| 1 Year (%) |
3 Year (%) | 5 Year (%) | 10 Year (%) | Since Inception (%) | |||||
| SRLN (NAV) | SPDR® Blackstone Senior Loan ETF | 10.78 | 10.78 | 3.52 | 4.49 | 3.24 | 3.18 | 4/3/2013 | 0.70 |
| SRLN (MKT) | SPDR® Blackstone Senior Loan ETF | 11.56 | 11.56 | 3.34 | 4.59 | 3.22 | 3.18 | - | - |
| Markit iBoxx USD Liquid Leveraged Loan Index | 11.82 | 11.82 | 4.11 | 4.40 | 3.05 | 3.09 | - | - | |
| Morningstar LSTA US Leverage Loan 100 Index | 13.20 | 13.20 | 5.19 | 5.78 | 4.00 | 3.99 | - | - | |
Source: State Street Global Advisors, as of December 31, 2023. Past performance is not a reliable indicator of future performance. Investment return and principal value will fluctuate, so you may have a gain or loss when shares are sold. Current performance maybe higher or lower than that quoted. All results are historical and assume the reinvestment of dividends and capital gains. Visit ssga.com for most recent month-end performance. Performance returns for periods of less than one year are not annualized. The market price used to calculate the Market Value return is the midpoint between the highest bid and the lowest offer on the exchange on which the shares of the fund are listed for trading, as of the time that the fund’s NAV is calculated. If you trade your shares at another time, you returns may differ. Index returns are unmanaged and do not reflect the deduction of any fees or expenses. Index returns reflect all items of income, gain and loss and the reinvestment of dividends and other income as applicable.
The gross expense ratio is the fund’s total annual operating expenses ratio. It is gross of any fee waivers or expense reimbursements. It can be found in the fund’s most recent prospectus.
Quarter in Review
The US loan market’s 2.87% return in the fourth quarter drove the index to its second-highest annual return of 13.32% for 2023. A strong fourth quarter rally of 7.16% powered high yield to an even higher 13.44% annual return.4 This performance was underpinned both by elevated base rates and improving sentiment as hopes grew for a near-term Fed pivot as inflation trended lower.5
The Fed’s dovish tilt as it kept rates on hold for a third consecutive meeting in December re-energized the rally across bonds and equities underway since early November. After a year of wild swings, the US 10-year bond yield returned almost to where it started the year from lows of 3.25% in the wake of March’s banking crisis and a peak at 5% in October.6 The S&P 500 rose roughly 25% through 2023 to end the year close to its all-time high.7
Against this backdrop loan spreads tightened to 459bps, close to long-term averages.
The ongoing supportive supply/demand technical pushed average loan prices to their highest level of the year at $96.23 on December 31. The share of loans priced above par rose to 38% by year-end, its highest level since rate hikes began.8 Limited net primary supply underpinned an ongoing CLO bid for secondary loans, while net inflows into retail loan funds over the final quarter also bolstered appetite.9
CLO issuance rose to $31.9 billion over the final quarter, although the year’s overall supply decreased from 2022 by about $9 billion.10
Primary loan supply decreased to $103 billion over the fourth quarter, dominated by refinancings and extensions for the fifth straight quarter.11 The $137 billion of refinancings in 2023 accounted for 58% of all new-issue transactions,12 while the $97.3 billion of non-refinancing loan supply was the lowest since 2009.13
The secondary strength triggered a fresh wave of repricings in December, a trend we expect to continue in 2024.14 The outstanding universe contracted by 1.2% to $1.39 trillion due limited net loan supply, repayments and private credit takeouts in 2023.15
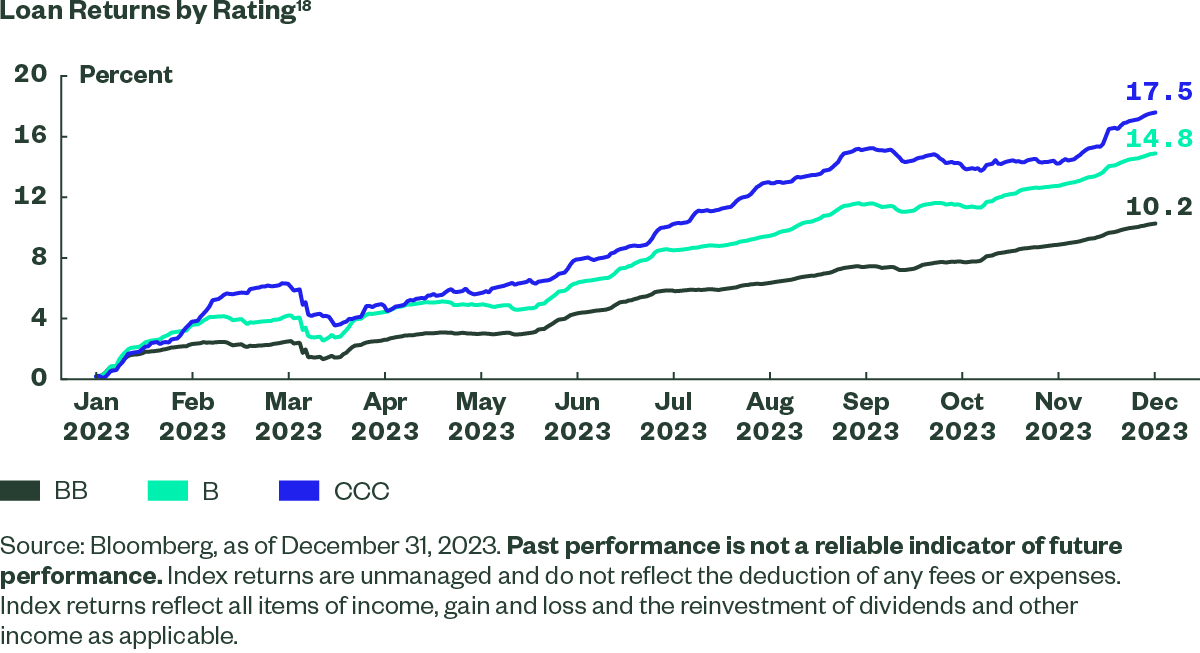
Managers continued to trade up-in-quality over the year, although a concurrent reach for yield enabled lower-rated CCCs to outperform for the final quarter and the year.16
Higher interest burdens have started to erode corporate margins and interest coverage ratios, although a combination of macroeconomic resilience, healthy corporate balance sheets heading into this cycle, and efforts by corporate borrowers to push out the near-term maturity wall have kept loan defaults in line with long-term averages at 3.15%.17
Portfolio Positioning and Outlook
As we move into 2024, we believe floating rate loans and CLO debt, and high yield are likely to remain attractive even if the Fed begins cutting rates, given historically attractive all-in yields, moderate expected default rates, and still-strong technicals.
From a macro perspective, inflation is heading lower, but we don’t expect a smooth path down given ongoing wage growth in the broader economy. As a result, we expect central banks to likely be more patient cutting rates on the way out to ensure inflation is truly tamed.19
The US economy has proved surprisingly resilient to the Fed’s aggressive tightening cycle, but we remain cautious of the potential for elevated rates to cause a slowdown in growth. We also expect higher volatility and a higher average level for rates and inflation over the cycle to feature in the post-downturn environment.20
Loan technicals should prove supportive in early 2024 due to light expected net new issue loan supply given relatively high interest costs, stretched equity valuations, depressed M&A activity. Private credit is also expected to take share from syndicated markets.
There are hopes that pent-up demand, improved valuations (assuming a hard landing is avoided), and large piles of private equity dry powder may spur a pick-up in M&A activity, eventually leading to an uptick in LBO volumes. In the meantime, refinancing exercises are expected to remain the mainstay of supply, as corporate borrowers use ongoing strong demand to extend maturities.
Having largely pushed out 2024 maturities borrowers face a wall of roughly $1.3 trillion of US high yield and leveraged loans due to mature between 2025 to 2027. 21 They will have to refinance these at substantially higher debt costs and we expect private lenders to continue to offer a potential alternative refinancing solution for some the more troubled credits.
CLO creation is forecast to remain near the same levels as 2023, however banks are expecting an increase in private credit CLO issuance from last year’s record $25 billion.22 CLO liability spreads have contracted further in early January, but managers will remain focused on the CLO equity arbitrage dynamics given the potential for loan repricings to reduce overall spreads on the asset side of the equation.
Corporate defaults are expected to reduce from current levels over the coming year, before rising again in 2025,23 although outside of the more cyclical and consumer facing industries we expect credit deterioration to be more idiosyncratic in nature.
We will need to play defense and offense to seek to both preserve and drive performance. That means targeting larger, cash-flow generative businesses in defensive and high-growth sectors, in which managers have built dedicated expertise and where defaults have typically been more muted. It also means identifying the opportunities that will inevitably emerge during periods of elevated volatility, tighter credit conditions and increased credit dispersion. We believe that thematic investing with a strong team which has weathered many cycles should continue to give us an edge during the next part of this cycle.