What’s the Increased Correlation Between Momentum and Minimum Volatility Mean?
- Momentum and Minimum Volatility factors have underperformed the market by the most out of any other factor in 2023.
- Excess return correlations for Momentum and Minimum Volatility factors spiked this year, deviating from historical low to negative correlations.
- Strategy design, rebalancing frequency, and prior-year market trends are the likely causes of the increased correlation.
Momentum stocks are typically viewed as higher risk assets that behave differently than lower risk Minimum Volatility exposures. But this year, Momentum and Minimum Volatility are the only ones across the traditional four factors trailing the market by double digits.1 With only a 3% and 5% gain in 2023, they are down 17% and 14%, respectively.2
As a result, their correlation of excess returns has spiked to an average 71% for all of 2023.3 This compares to a historical excess return correlation of just 9.6%,4 putting this year’s behavior at odds with historical trends and the generalized views of factor frameworks.
Will this correlation continue into 2024?
Momentum and Minimum Volatility Most Correlated Since 2002
The basic premise of factor investing is that certain factors (Value, Momentum, Quality, and Minimum Volatility) represent premia that can add to returns over a long-term horizon. Yet, cyclical shifts can impact short-term returns, leading to periods of underperformance versus the market.
Factor investing also provides potential diversification opportunities. But when return trends break down as a result of cyclical market shifts, so do the potential diversification benefits. That’s happening now with Momentum and Minimum Volatility exposures.
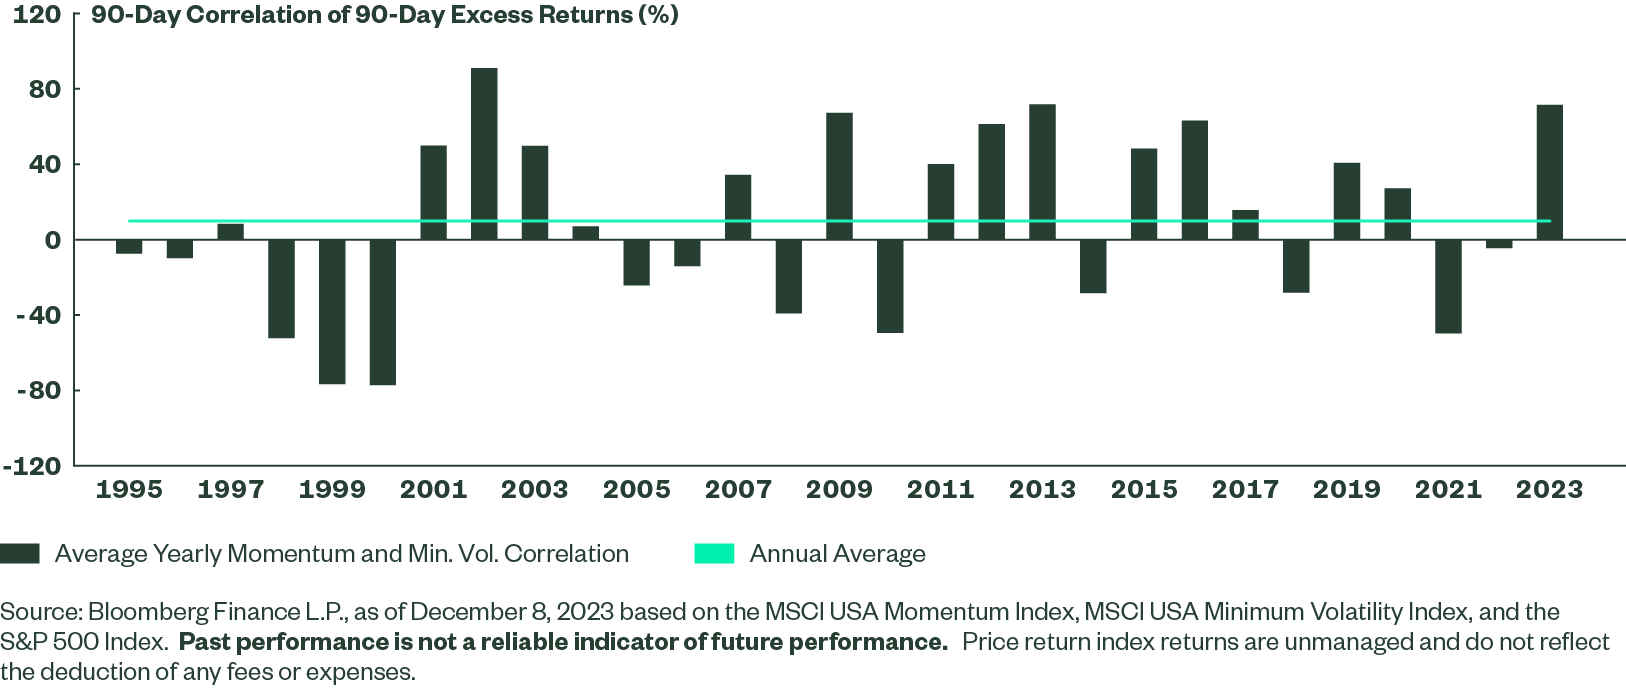
Using rolling 90-day correlation of 90-day excess returns to the S&P 500 Index (removing outliers and general market beta from two long-only exposures), Momentum and Minimum Volatility stocks have not been this correlated in a calendar year since 2002. The average correlation in 2023 has been 71%, compared to long-term average 9.6% (Figure 1).
Figure 1: Momentum and Minimum Volatility Factors Most Correlated in Over 20 Years
The Impact of Factor Construction
Factor construction (e.g., market neutral, beta neutral, long-only, sector neutral, high capacity versus high concentration) alongside attribute selection (e.g., price-to-book versus price-to-sales for value investors) can lead to different profiles, returns, and relationships to other factors. Yet, the same trend for Momentum and Minimum volatility factors exists even if different construction methodologies are used.
The above MSCI-based Momentum and Minimum Volatility exposures are rebalanced semi-annually and use different descriptors for the intended factor focuses than what the S&P 500 USA Momentum Index and the S&P 500 Low Volatility Index use. The latter of which also rebalances annually.
For those two S&P based factor types, the 2023 average correlation is also 71% versus a long-term average of -2%.5 Point being, the factors’ co-movement is consistent across other factor frameworks.
But the co-movement has begun to rollover and mean revert. The rolling 90-day correlation of 90-day excess returns has declined in the last few weeks and is now below the historical median (Figure 2). The same trend exists if we use the S&P-based factors.
Momentum and Minimum Volatility Don’t Move Together for Very Long
Momentum and Minimum Volatility correlation spikes like this most often occur right after the markets go through a significant or lengthy decline, as they did in 2002, 2009, and 2020 (Figure 2). The potential rationale is that when broad-based market declines occur and sentiment turns risk-off, some of the top performers turn out to be the least volatile stocks.
Given that momentum screens like the ones used in the above analysis tend to be backward looking on a relative cross-sectional perspective, Momentum exposures will start to include more of those defensive names. That’s exactly what happened this year. Following broad-based market declines in 2022, single security overlap between the two factors increased in 2023 to a ten-year high from a ten-year low in 2021.6
With more defensive names included in the Momentum basket, correlations can, and did, start to increase. Yet, when sentiment turns and the market becomes more risk-on, the Momentum basket tends to rebalance toward the new market leaders.
As a result, post-rebalance, the correlation between Momentum and Minimum Volatility historically has started to break down and mean revert closer to historical levels. That’s happening now as we head into 2024 after a strong Q4 rally and late November rebalance —not unlike what we saw in 2003, 2010/2011, and 2021 when the market’s trajectory recovered and shifted after a significant decline in the prior year.
Bottom line: Factor investing is meant to be a long-term asset allocation strategy, with premia compounding over an extended period of time. There have been, and will continue to be, cyclical shifts based on market dynamics that alter the short-term behavior of factors from a return and diversification perspective.
Investors with conviction in factors, but who may be discouraged by single factor cyclical shifts, could consider multi-factor strategies that may help reduce the impact of single factor cyclicality on their pursuit of long-term factor premia.
For more insights and market trends, you check out our full Chart Pack.