Gold Midyear Outlook: Interest Rates, Recession, and Risks Propel Gold Higher
- Gold’s prospects in the second half of 2023 remain bright, driven by a shift in monetary policy, the potential for recession, and growing potential for market shocks and volatility.
- Fundamental demand for gold remains robust led by central bank purchases.
- Despite nearing its all-time high price in US$, gold may have more room to run as investors shift back into the metal.
Heading into 2023, gold’s prospects looked positive despite muted performance in 2022 and a similar consensus sentiment among market participants. And gold has certainly shone brightly on an absolute and relative basis thus far in 2023: Year to date, gold posted a 7.61% return compared to 7.68% for global equities and 3.03% for global fixed income.1 Over the last 12 months, gold has outperformed both global equities and global fixed income broad indices. Gold also separated itself from the broader commodities universe which, amid moderating inflation and slowing demand, has seen a drop of -11.42% and -24.78% on a year-to-date and trailing 12-month basis, respectively.2
In our 2023 Gold Outlook, we outlined two key factors as important drivers for gold this year: interest rates and recession. Both factors will continue to impact gold throughout the rest of the year. But the regional banking crisis, the US debt ceiling, and on-going geopolitical turmoil globally have put risk front and center as another catalyst, on par with rates and recession, to continue to support the case for gold for the remainder of this year.
Gold and the Three Rs – Rates, Recession, and Risk
1. Rates: A Shift From Hike to Halt May Benefit Gold
The Federal Reserve (Fed) began its current rate tightening cycle, the most aggressive hiking cycle on record, in March 2022. As the Fed ratcheted up its policy benchmark rates, gold began a sell-off that was exacerbated by four consecutive jumbo hikes of 75 basis points (bps) throughout 2022. But as inflation began to moderate, the Fed slowed the size of its rate hikes in Q4 2022. Gold subsequently bottomed out at US$1622/oz on September 26, 2022, shifted gears, and has since rallied 21%.3
This shift from expected rate hikes to an expected rate halt significantly benefitted gold. The first leg of the current gold rally was driven by expectations of an end to the Fed’s rate tightening cycle. The next leg of the current gold rally likely will come with the rate cut cycle over the near to medium term, pushing real yields lower as inflation remains elevated and sticky. This results in more limited downside for gold as the Fed rate cycle hits pause, expected by the end of this year.
The outlook for the US dollar has softened year to date, following a 20-year high last year. With expectations for slowing US growth and a ceiling for US real interest rates, the dollar may see further headwinds, particularly on a relative basis, with capital flowing to other regions, such as Europe, which continue to increase interest rates.
2. Recession: Slowing Growth May Spur Demand for Defensive Assets
With expectations high not only for a US recession but also a global slowdown, gold may shine. It performed well during the seven US recessions since 1973, with an average return of 20.19% (see Figure 3). As such, gold may benefit from anticipation of a US recession, particularly compared to other asset classes.
Current leading economic indicators are nearing levels experienced during previous recessions with global and US growth trends signaling a slowdown amid sticky inflation. Whether the US economy is heading toward or already in a recession is up for interpretation. But it’s important to highlight that, historically, gold not only performs well during economic contractions but also in the periods immediately leading into a recession.
In the six months preceding a US recession, gold has been a clear favorite. During the last seven US recessions, gold averaged 11.32% in the immediate lead up to an economic recession. This makes intuitive sense as investors seek to build defensive positioning ahead of an anticipated growth slowdown.
As for the six months following a US recession, gold averaged 0.51%. Yet underperforming relative to other asset classes should not overshadow gold’s overall risk management characteristics and diversification benefit to portfolios — particularly during economic recovery periods that may still exhibit heightened volatility and persistent uncertainty.
You can read more about gold and the protection it may provide against recessionary risks in our Midyear ETF Market Outlook, Diversify Recession Risks with Cyclicals and Defensives.
3. Risk: Growing List of Tail Risks Could Help Gold Shine
Market risks are always a focus for gold investors, and 2023 has had no shortage of events to keep investors on their toes. With ongoing uncertainty on the global geopolitical front and recent risk events — including the regional banking crisis and US debt-ceiling debate — driving market volatility, the potential for further unforeseen risk events remains elevated.
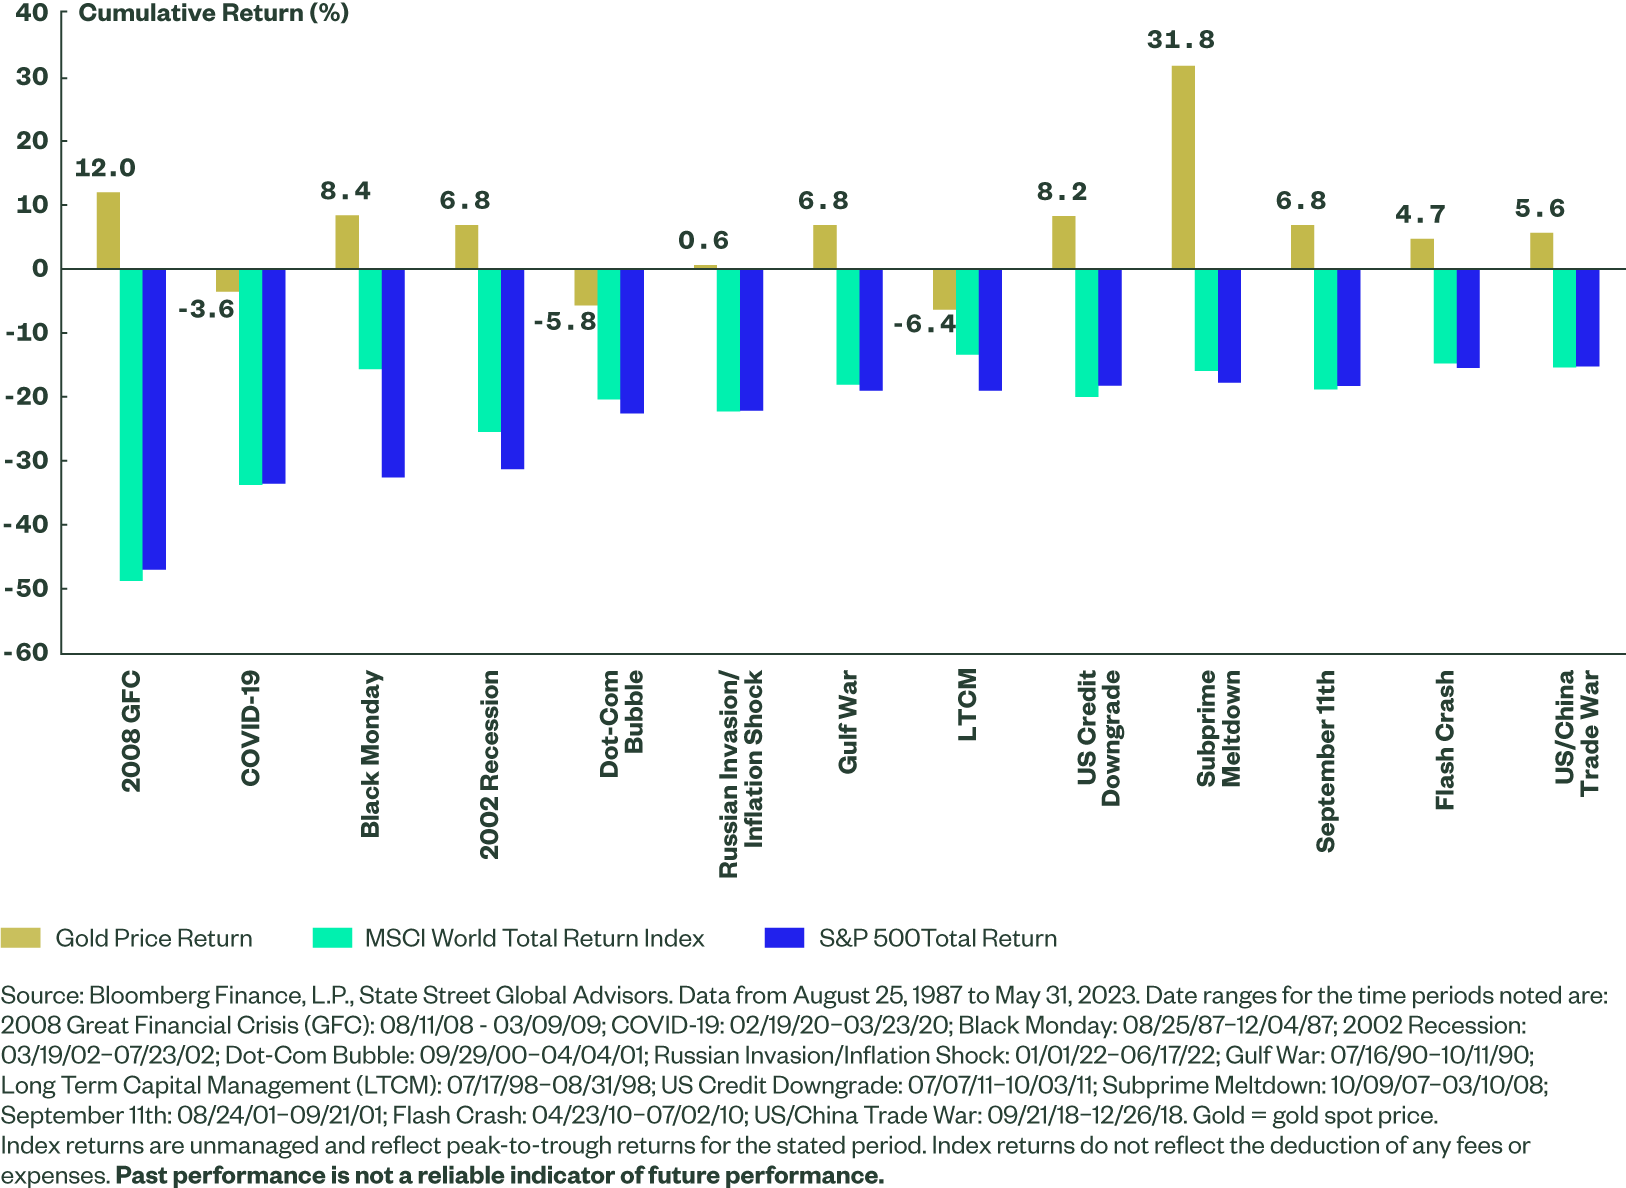
Gold has exhibited low correlations to financial assets over multiple market cycles; it also has a strong track record of protecting against both short- and long-term market volatility. Its ability to help protect portfolios against systemic market shocks and tail events stemming from a variety of crises (see Figure 4) may help reduce portfolio drawdowns resulting in potential portfolio performance improvement over time.
Looking at major drawdowns in US equity markets, gold has not only outperformed US equities on a relative basis, but also on an absolute basis in the majority of cases. During peak-to-trough drawdowns greater than 15% on the S&P 500® Index, gold averaged 5.8% total return versus -24.2% total return on the S&P 500 and -21.9% on the MSCI World Total Return Index.4 And during these 13 drawdown events, gold delivered positive returns in ten of those periods. In the three periods when gold had a negative return, it still reduced portfolio drawdowns and volatility when compared to a portfolio with no gold. Furthermore, gold tends to maintain gains over time even as markets recover.
Figure 4: Gold Stands Out During Market Turmoil Events
Gold Demand Supports a Positive Outlook
The current macroeconomic background remains conducive to a strong gold outlook for the remainder of 2023. Coupling this with a robust and healthy fundamental picture for the global gold market further cements a positive view. The post-pandemic recovery in global gold demand has continued into 2023, led by emerging market consumer demand. China in particular may fuel growing investment and consumer demand throughout the year, following the end of its zero-COVID policy in late 2022. With signs of slowing economic activity emerging in China and other emerging market economies, gold may serve as a potential safe-haven asset.
A key trend to watch is continued gold purchases by central banks. 2022 saw the highest-ever level of net gold purchases by central banks. Data from the World Gold Council shows that central banks purchased a net 1,079 metric tons (t) for their official reserves, marking the 13th consecutive year of net official sector buying. Purchases have continued into Q1 2023, with 228 metric tons purchased by central banks.5 This increase in official sector buying may also help explain gold’s rally in recent months, which has remained strong despite tepid flows from global gold ETF investors over the same period.
China’s central bank has also resumed reporting its gold purchases since it reopened its economy. In December, the People’s Bank of China (PBOC) reported an increase of 32 metric tons of gold in November, the first increase since September 2019. PBOC has continued reporting gold purchases in every subsequent month through April,6 with other central banks such as Singapore and Poland exhibiting notable gold purchases so far in 2023.
Record High Price in Sight, Now What?
On May 4th this year, the gold spot price reached an intra-day high of US$2063/oz.7 This was just 0.58% shy of the all-time intra-day high of US$2075/oz set on August 7, 2020.8 A new all-time high for gold seems within reach, and with it, questions have been raised about the efficacy of gold’s sustained outlook.
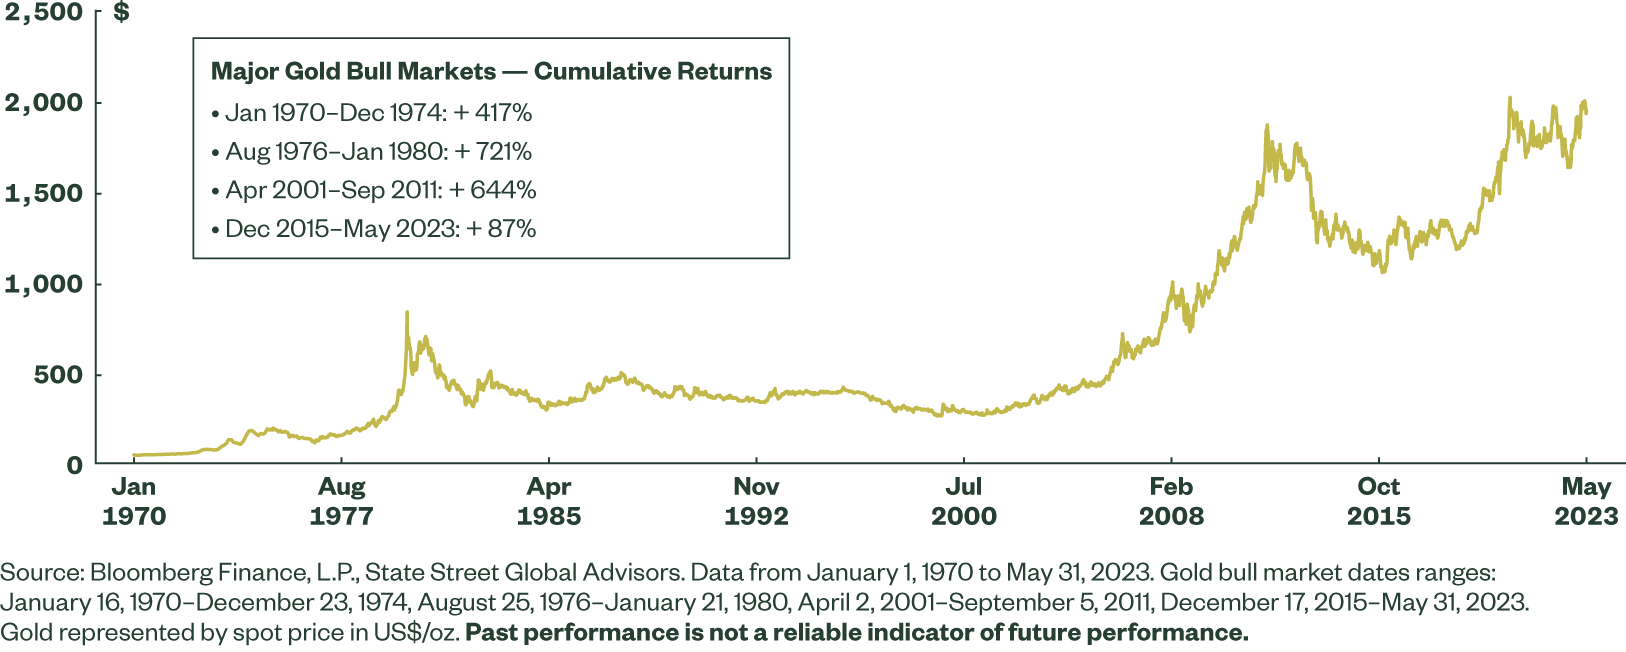
Investors shouldn’t be overly concerned about gold nearing — or exceeding — its previous nominal high in US dollar terms. In fact, gold has already hit new all-time highs in recent years in several other currencies. Put into historical context, the current high becomes arbitrary since the current gold rally remains relatively tame in comparison with historical performance.
Looking across other major gold bull markets in the last 50 years shows that the current structural bull market for gold (which began in December 2015) has yet to exhibit concerning characteristics. This doesn’t guarantee that gold will reach the same levels of performance as in the past; gold did experience several short-term corrections during previous structural bull markets. But it does show that gold has the capacity to continue performing well over the medium to longer term, despite nearing its previous record price now.
Figure 7: Gold Nears All-time High, but May Still Have Room to Run
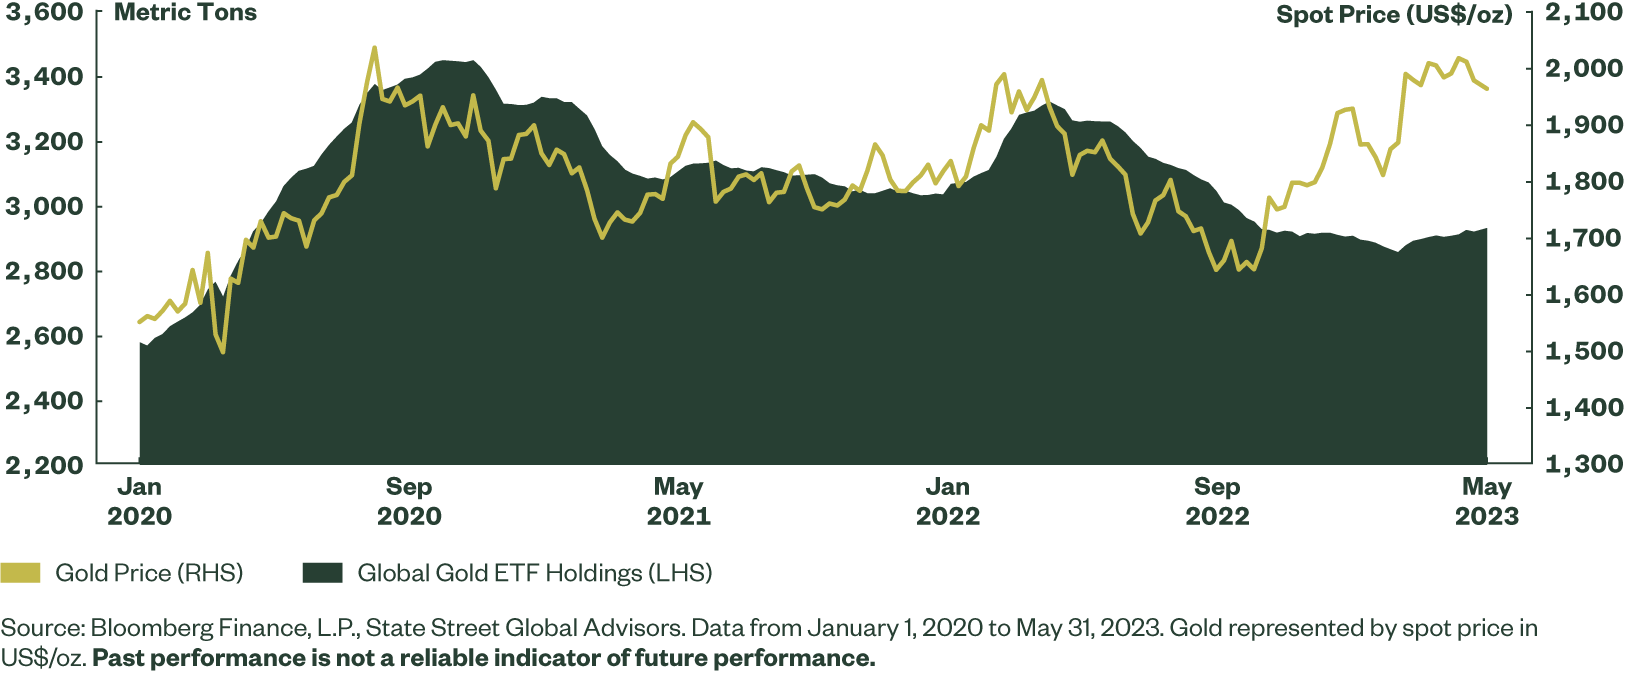
Interestingly, we’ve seen a divergence between the gold price and global ETF holdings this year. Historically, these tend to track fairly closely. But since Q4 2022, the gold spot price has rallied absent any comparable boost from ETF investor flows. This rise in gold’s price could be attributed to increased central bank purchases and short-term higher yields pushing investors to cash. However, global retail bar & coin investment demand remains healthy and robust, signaling that investment appetite for gold in the current environment is strong. In fact, a sustained rally driven on fundamentals and absent significant ETF flows points to a healthy rally for gold.
Figure 8: Global ETF Investors Remain on Sidelines Despite Price Rally
A shift in investor sentiment driven by the three Rs could quickly propel investor flows into gold. That could close the gap between the spot price and gold ETF holdings, resulting in further support for the gold outlook beyond the current all-time-high price.
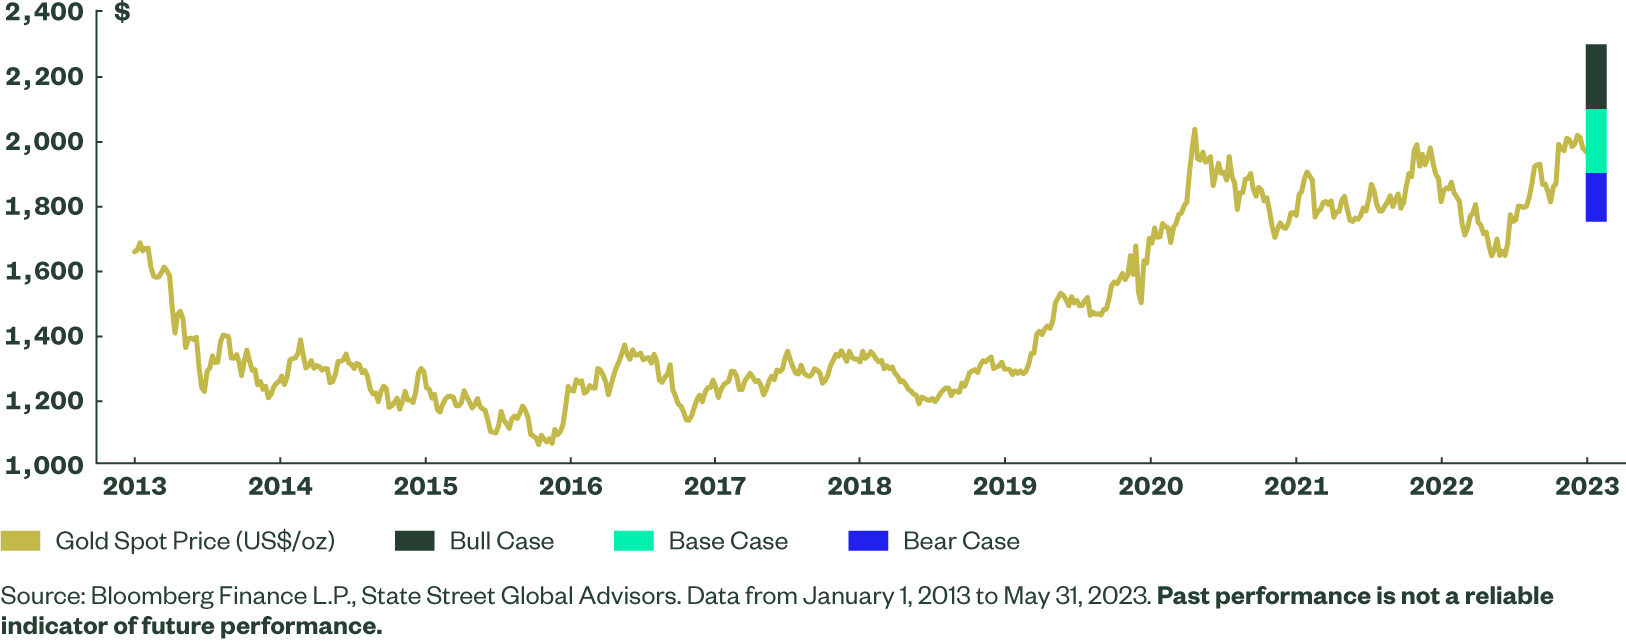
2023 Gold Midyear Outlook Scenarios
Taking all of this into consideration, we see a shift toward a greater possibility for either the bull or base case scenario for gold and limited downside with a bear case. As such, the potential trading ranges across all scenarios are revised upward from our original 2023 outlook.
- Base Case (40% Probability): Gold’s potential trading range is between US$1900/oz and US$2100/oz. In this scenario, the Fed pauses its current interest rate tightening cycle, capping real rates. US growth slows resulting in a shallow recession and the US dollar remains flat to slightly down. As a result, the investment demand for gold rises along with continued central bank purchases and steady jewelry demand globally.
- Bull Case (40% Probability): Gold sees a potential trading range between US$2100/oz and US$2,300/oz. In this scenario, the Fed begins easing with at least one rate cut by yearend amid worsening labor and economic data, and the risk of a deeper recession than anticipated. Exogenous shocks, escalating geopolitical tensions, and continued stress from tighter financial conditions spur market volatility. Gold investment flows increase dramatically alongside the US dollar as demand for safe-haven assets increases.
- Bear Case (20% Probability): Gold’s potential trading range is between US$1750/oz and US$1900/oz. In this scenario, the Fed implements small incremental rate hikes as inflation grinds higher and economic growth slows, but avoids recession with the US dollar rising alongside rates. Investment demand for gold remains flat; central bank and jewelry demand rises amid bargain buying from a lower gold price.
Figure 9: Gold’s Resilience in H1 May Lead to Strength Throughout H2
For insights on the broader market, access our 2023 Midyear ETF Market Outlook: Investing with Caution and Courage. You can also access more commentary from the Gold Strategy team here.