Target Growth with Quality US Equities
As high rates hinder growth and volatility increases, look to quality US equities — which we expect to outpace broad developed ex-US and emerging markets — for potential upside with stability.
Global equities climbed a wall of worry in 2023: the US regional bank crisis, elevated inflation, recessionary fears, earnings slowdowns, steady tightening by global central banks, and a war in the Middle East. US equity gains — driven by a handful of large-cap technology leaders and a better-than-feared earnings downturn — have dominated thanks to the resilient US consumer and growing AI-related demand.
Heading into 2024, we expect US equities to continue to outpace broad developed ex-US and emerging markets given their higher growth prospects, stronger earnings and economic resiliency, and greater exposure to near-term beneficiaries of fast development in AI.
But because US economic growth is expected to slow, the margin expansion assumption embedded in the current consensus 2024 estimates will be challenged by higher financing costs, above-average inflation, and a weaker demand outlook. Therefore, 11% forecasted 2024 earnings growth in the US is not a given, and revision risks skew to the downside.
As higher rates take a larger bite out of economic growth and equity volatility increases, targeting growth with quality in equity portfolios may help to deliver potential upside coupled with stability.
Investors should consider the following:
- A core multi-factor US strategy that blends Quality, Value, and Minimum Volatility to capture a quality-centric upside with a defensive bias.
- The insurance industry's strong pricing power, to target areas with reliable growth.
- Tech leaders across Information Technology, Communication Services, and Consumer Discretionary sectors to capture AI-related tailwinds.
- Dividend growth strategies, to lower volatility when pursing upside.
Favor the US Over Europe and Emerging Markets
Overcoming recessionary fears in 2023, global equities, led by US large-cap growth names, registered double-digit gains, rewarding those who stay invested. But those gains were driven mainly by multiple expansion, as earnings growth was flat or negative across most regions. With global earnings expected to rebound in 2024 and the high interest rates keeping multiple expansions in check, earnings growth is likely to be the key driver of regional returns.
Among developed regions, the US is expected to lead annual earnings growth in 2024 (Figure 1). If this 11% growth rate is achieved and valuation multiples are little changed, investors may be looking at another year of gains. After all, the US has shown greater economic resilience so far amid the monetary tightening. Thanks to strong consumer spending supported by the resilient labor market and lingering effects from the CHIPS Act and Inflation Reduction Act, US 2023 GDP growth estimates have been upgraded throughout the year from 0.3% to 2.3%.1
On the other hand, European economic momentum has weakened since Q1 2023. Eurozone Purchasing Manager Indices (PMIs) contracted for both the manufacturing and services sectors over the summer, as weak demand for their goods from China spilled over to services sectors.2 The EU Economic Sentiment Indicator has steadily declined to its lowest level since October 2022.3 European earnings sentiment has also been weaker than in the US lately, with sales and earnings beats surprising to the downside, while US companies continued exceeding expectations.
While 2024 emerging market (EM) earnings growth projections are higher than the US, those numbers are more vulnerable to downgrades during a global economic slowdown. EM earnings revisions have been negative throughout the year due to deteriorating earnings prospects in China and the spillover effects of a sluggish Chinese economy on other EM countries. Given ongoing challenges faced by the Chinese government to stimulate the economy and weaker demand from developed countries, emerging markets' earnings growth projection of 18% looks too optimistic.
The impacts of high interest rates have also started to show on EM companies’ balance sheets, with interest coverage ratio (EBIT/Interest Expense) declining to its lowest level since Q2 2021. Although their valuations relative to US equities are trading in the bottom decile of the past 15 years,4 considering the record wide gap between EM and US return on equity (ROE), their cheaper valuations are less attractive.
The Path to Gains in the US Won’t Be a Straight Line
Below-average sales surprises and downbeat revenue guidance from companies in the Q3 earnings season underscored the soft demand outlook. Much weaker top-line growth relative to bottom-line growth in 2024 (5% vs. 11% for S&P 500 companies) implies operating margins will expand to a record high of 17% in 2024.5
The last time we saw such strong margin expansion was in 2012, when economic growth rose from 1.6% in 2011 to 2.3% and the interest rate was close to zero. For 2024, US GDP growth is expected to decelerate to below trend of 1.0%, while interest rates likely will be above 4.0%. Therefore, margin expansion will be challenged, making 2024 consensus earnings-per-share (EPS) subject to further downgrades.
Higher rates also have started to bite into corporate profits and balance sheets. The excess corporate cash holdings that companies accumulated in 2020 and 2021 to finance operations, growth, and share buybacks in the current rate hike cycle are depleting.6 As corporate debt refinancing starts rolling in at yields north of 6% or 9% (depending on credit quality), the effects of higher interest rates on companies’ balance sheets will gain traction in the coming quarters.
That’s one of the reasons why companies with strong cash flow and low debt burdens performed well in 2023. Firms in the top quintile of free-cash-flow-per-share had an average 9.2% return in 2023 compared to -9.0% loss for the bottom quintile. Similarly, top quintile firms based on net-debt-to-EBITDA produced an average return of 2.3% versus bottom quintile firms recording an -8.0% loss.7
Large caps are also better positioned than small caps for a slowing economy with high financing costs. Large caps’ debt-weighted average maturity is ~12 years (ex-Financials) vs. small caps at ~7 years due to their greater exposure to floating rate debt.8 Additionally, small caps tend to be more economically sensitive with less pricing and wage negotiation power — and therefore may face more challenges in a softening economy and strong labor market.
Quality US Equities Deliver Growth
With a mix of macroeconomic and earnings fundamental tailwinds and headwinds, high quality companies with strong pricing power, stable earnings, and healthy balance sheets are more likely to withstand margin pressure and high financing costs in order to meet growth expectations.
Indeed, US high quality companies are expected to grow their earnings by 15.9% and revenue by 7.3% in 2024, exceeding the broad market by 4.3% and 1.8%, respectively.9 Their operating margins are expected to continue expanding at a faster pace than the broad market. This is consistent with historical trends observed in 2019, when the US economy slowed from the previous year and the Federal Reserve (Fed) held interest rates at the cycle’s peak. During that period, quality companies outpaced the broad market in earnings growth and managed to expand their operating margins when the broad market experienced a margin decline.10
As a factor, Quality has historically outperformed the broader market in seven out of eight economic slowdowns, and by an average of 6.5% on a cumulative basis since 1988.11 Quality’s track record of consistently outperforming the broad market in every recession since 1988 highlights its resiliency in challenging economic environments.
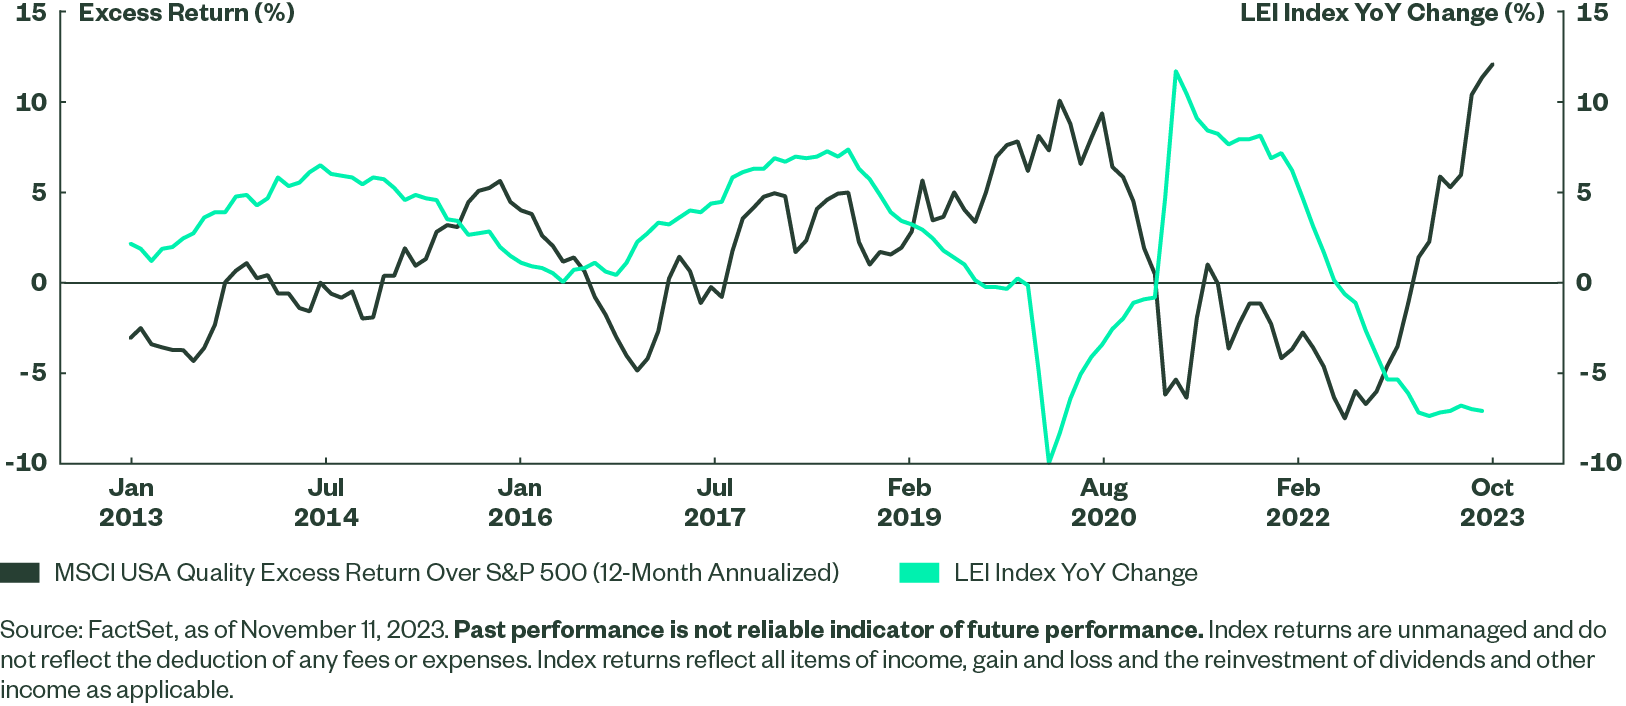
Quality struggled to outperform in 2022 (Figure 2) as markets re-priced its expensive valuations to their lowest level since 2018, amid the Fed’s aggressive rate hikes. But with the Fed closer to its terminal rate, Quality’s reasonable valuations and the regional bank crisis rekindled investors’ interest in 2023.
Figure 2: Quality Has Outperformed During Economic Slowdowns
After the recent run-up, high quality companies’ valuations indeed have become more expensive compared to the beginning of 2023. However, their price-to-forward-earnings and price-to-cash-flow are still 16% and 31% below their historical peaks, respectively. Further, their profitability, as measured by ROE increased to near a record high of 39% in the second half of 2023.12 Given lower ROE (25%) and weakness in earnings trends in the broad market and peaking interest rates, Quality’s current valuations are not too stretched.
Insurance Industry’s Pricing Power Pays a Premium
Insurers have been raising premiums to catch up with increasing underwriting expenses, using strong pricing and underwriting actions to confront inflationary pressures and significant losses from natural catastrophes in the first half of 2023. P&C insurers’ net written premium, a key indicator of earned premium for the following year, increased by 9% over the same period. And it’s expected to increase by high single digits for the fourth straight year in 202413 — well above the industry’s 10-year average. Adverse auto claim trends are poised to improve, as used vehicle prices declined 7% below their level one year ago, and CPI inflation in maintenance and repair fell steadily to 9% in 2023.14
Meanwhile, the higher-for-longer interest rate environment supports insurers’ investment income — the second-largest part of their revenues. Life insurance companies, in particular, will generate more income from the difference between investment income and the amount paid out on annuity guarantees and other liabilities.
With new higher premiums taking effect and improved investment returns driven by higher rates, the insurance industry’s 2024 earnings estimates have been raised by 3.6% over the past six months, compared to a 0.7% decline for the broad market.15 And the industry’s EPS growth is projected to be above 20.0% again next year, outpacing the broad market for the second straight year.16
The insurance industry also has shown financial strength. Despite inflationary pressures and increased natural catastrophes in 2023, the industry maintained positive net income, boosting capital levels and keeping the net writings leverage at a healthy level. The industry’s aggregated policyholders’ surplus increased close to a record high of $1.07 trillion last year, indicating sufficient financial protections for policyholders in the event of unexpected or catastrophic losses.17
Technology Leaders Shine
We have seen similar earnings resilience in the Communication Services, Information Technology, and Consumer Discretionary sectors, which have led 2024 positive earnings revisions among the S&P 500 sectors, barring Energy, since June (Figure 3). Earnings sentiment among tech leaders across these sectors has been even stronger than individual sectors as the NYSE Technology Index — an index composed of 35 leading US-listed technology-related companies across the three sectors — has seen higher earnings upgrades for 2024.
In addition, AI-related tailwinds may continue to provide growth opportunities in 2024 and beyond for companies well positioned to take advantage of AI technologies. To capture these potential growth opportunities, investors need to take a broad view of the AI ecosystem and look beyond the traditionally defined Information Technology sector. For example, online retail platforms that have large amounts of customer data to train the large language models are in a strong position to leverage AI technologies to improve efficiency in marketing and sales and provide curated customer experiences.
The current AI technology cycle is driven by the world’s largest technology leaders who invest heavily in building the foundational large language models and who have plenty of customer data to train the models. Early monetization of gains from AI technology could come more easily for them by offering differentiated high-value-add products to their customer bases, resulting in higher revenue per customer. AI enablers, such as advanced chip makers and cloud computing companies that provide the infrastructure needed to deploy AI at scale, are also able to monetize gains in the beginning stage of AI development.
The significant year-to-date gains in large-cap tech leaders has prompted some investors to question if AI hype has created a valuation bubble. But the NYSE Technology Index’s earnings and sales price multiples are still well below their pandemic peaks and dot-com bubble levels, and they’re trading around their five-year median thanks to the valuation pressure from higher rates.18 In addition, these companies have lower financial leverage than the broad market and positive free cash flows, meaning their operations are less impacted by higher financing costs.
As rates peak and investors search for high quality growth companies in a slowing economy, large-cap tech-related leaders likely will continue to attract investors’ interest.
Dividend Growers’ Quality Traits Offset Volatility
Equity volatility trended lower in 2023, despite elevated rates’ implied volatility and episodic volatility driven by the regional bank crisis, debt ceiling negotiation, and the Israel-Hamas war. Year to date, there were only 44 days when the VIX Index was above 20, compared to 236 days for 2022 and 93 days for 2021.19 As monetary tightening enters its third year and the effects of pandemic-era fiscal and monetary stimulus diminish, equity implied volatility is likely to move higher.
Dividend growers’ quality traits may help lower the impact of volatility when pursuing upside in equities.
Companies that have historically increased their dividends for years have shown their ability to balance returning capital to shareholders and reinvesting capital for future earnings growth. Achieving this balance over a long period of time requires financial strength and disciplined capital management. That usually translates into high quality traits, such as lower financial leverage and more stable earnings than the broader market and higher-yielding companies.20
Thanks to their track record of returning capital to shareholders and maintaining financial stability, on average, dividend growers have outperformed low dividend payers, high dividend payers, and the broad market when equity volatility jumped double digits for the month. Even when volatility increased to a lesser extent, dividend growers still outperformed low dividend payers by a large margin (Figure 4).
Implementation Ideas
With higher rates taking a larger bite of economic growth, target quality growth with: