Core Portfolio Construction Principles
A strong flexible portfolio begins with the core. It provides a stable foundation to pursue specific investment goals. An effective core may differ from one investor to the next, but four construction principles apply to all.
A strong, flexible portfolio depends on how you allocate assets in the core. That’s because the core is the largest part of a portfolio and research has long shown that asset allocation decisions explain over 90% of the variance in portfolio returns.1 Simply put, it all starts with asset allocation. And today’s low return expectations make building a low-cost, diversified core more important than ever, as costs accumulate over time, eroding a portfolio’s total return.
While an effective core may look different for each investor, we believe that there are four principles to core construction:
- Broaden Your Reach
- Customize to Your Client’s Needs
- Control Costs
- Impose Discipline
1. Broaden Your Reach
We believe today’s core should reflect an expansive investment universe, including US equities, international equities and fixed income. Investors have a well-documented tendency to exhibit a home bias (a heavier allocation to domestic stocks).2 Given how globalized the economy has become, where countries outside the US represent 75% of nominal global GDP,3 international equities are essential to broaden reach, mitigating any home bias tendency.
Yet, while a portfolio concentrated in equities has historically generated strong returns over the long term, these returns merely compensate for the higher risks assumed. And not all investors can tolerate the significant drawdown risk inherent within equities. Diversifying your core by allocating to bonds may help mitigate portfolio drawdowns and improve returns per unit of risk.4 As shown in Figures 1 and 2, relative to a pure equity portfolio, a hypothetical portfolio comprised of 60% equity and 40% fixed income reduced drawdowns and more quickly recovered its maximum losses after stock market crashes.
Figure 1 : Broaden Reach for Potential Diversification Benefits
|
20 Year |
||||||
|---|---|---|---|---|---|---|---|
Annualized Return |
Annualized Standard Deviation |
Return per Unit of Risk |
Max Draw Recovery Period |
Max Drawdown |
Worst Return 1 Year |
Best Return 1 Year |
|
S&P Composite 1500 Index |
9.75 |
15.08 |
0.65 |
37.00 |
-50.84 |
-43.18 |
58.73 |
60% Equity + 40% Bond Portfolio |
6.85 |
9.63 |
0.71 |
20.00 |
-32.67 |
-27.88 |
38.77 |
Source: FactSet, for the period from December 31, 2003 to December 31, 2023. The 60% Equity + 40% Bond Portfolio consists of 36% of the S&P Composite 1500 Index, 17% of the S&P Developed ex-US BMI Index, 7% of the S&P Emerging BMI Index, and 40% of the Bloomberg US Aggregate Bond Index, rebalanced annually, without considering transaction costs. The returns were achieved by mathematically combining the actual performance of the indexes listed above. Past performance is not a reliable indicator of future performance. Index returns are unmanaged and do not reflect the deduction of any fees or expenses. Index returns reflect all items of income, gain and loss and the reinvestment of dividends and other income.
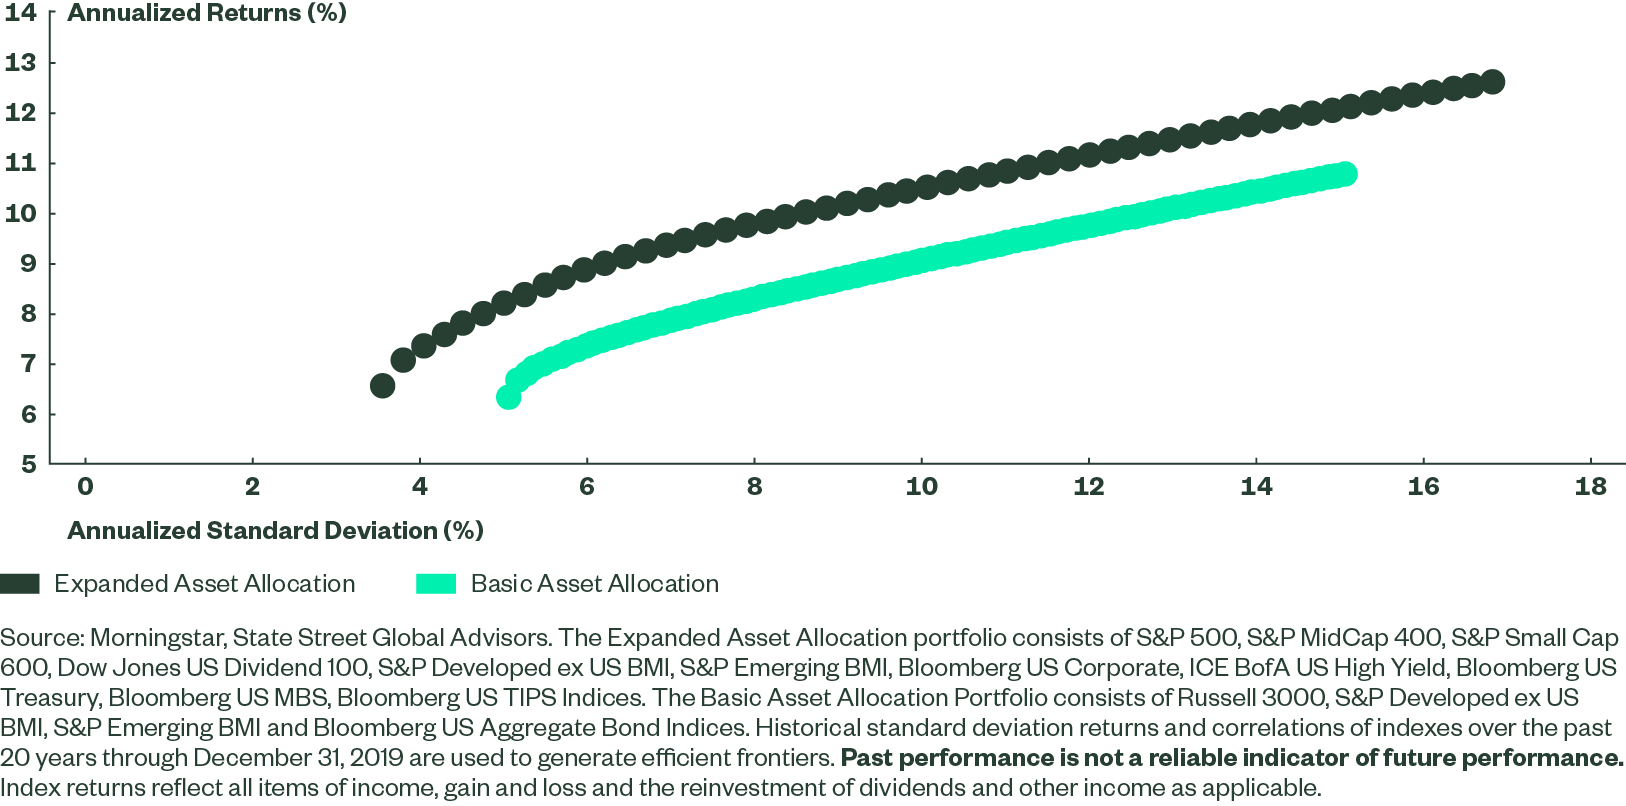
The sample 60% global equity and 40% US bond portfolio is only a starting point for diversification. The diversification benefits could be enhanced if investors include more asset categories that are less or negatively correlated to each other. As shown in Figure 3, by including more granular asset classes, such as small and mid caps, dividend stocks, high yield and investment grade bonds of different duration, inflation-protected securities, etc., the portfolio has the potential to improve returns across all risk spectrums without taking additional risks.
Figure 3: Efficient Frontiers
2. Customize Your Client’s Needs
Your client’s risk tolerance, return expectations and time horizon inform a blueprint for constructing a core with the necessary foundational support. And, obviously, a core that’s appropriate for one client may not be appropriate for another.
In general, longer investment horizons tend to result in greater risk tolerance and higher return expectations. For example, young investors just starting their careers likely have longer investment horizons and greater risk tolerance than retirees who rely on the income from their portfolio to fund their retirement. A young couple preparing to buy their first home may have different risk and return expectations than a middle-aged couple saving for their kids’ college.
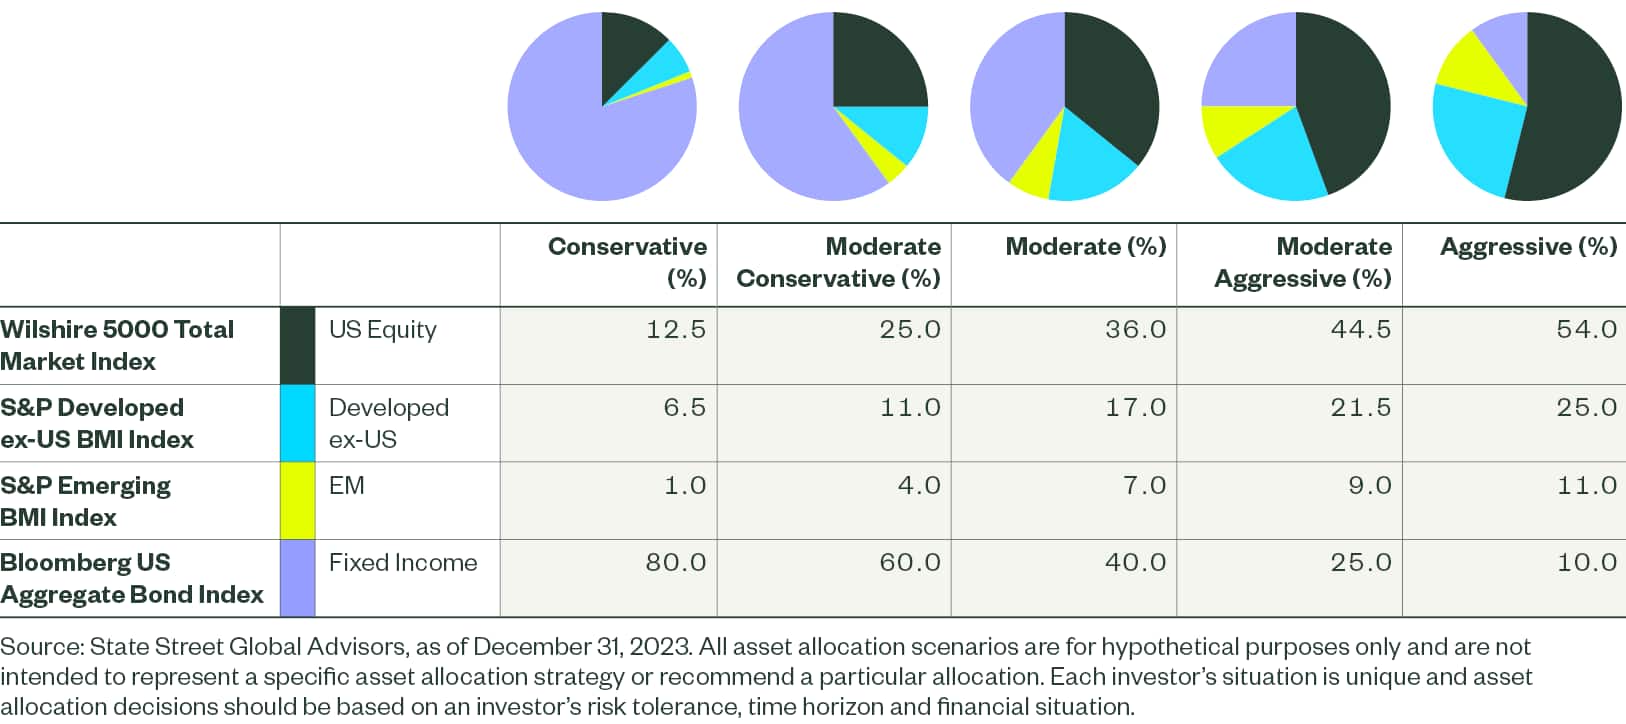
Again, the combination of core asset classes can create a portfolio core tailored to clients’ risk and return requirements. As shown below, five hypothetical core examples calibrate the risk level by adjusting the broad allocations to US equities, international equities and fixed income. A more conservative investor should have a higher allocation to bonds. If your client needs to access principal relatively soon, making withdrawals during one of those equity drawdowns shown in Figure 2 simply won’t work. On the contrary, a more risk-seeking investor might be more willing to ride out those drawdowns to seek higher total returns over the long term.
Thus, as shown in Figure 4, as you move up the risk tolerance scale, you take on exposure to equities, both domestic and international.
Figure 4 : Match Core Allocations to Client Risk Profiles
It’s all about underlying exposures. If a client is more focused on capital growth over the longer term, a portfolio can be tailored to move up the risk spectrum and allocate more to equities, becoming more equity-like, as measured by the beta to the S&P 500® Index, and less bond-like, as measured by the beta to the Bloomberg U.S. Aggregate Bond Index.
Equity market fluctuations typically have a larger impact on more risk-seeking portfolios, while shifts in the bond market typically impact more risk-averse allocations. The difference is most stark when examining the worst 1-year return periods, as more bond-sensitive portfolios experienced less significant drawdowns.
However, the risk and return relationship is generally asymmetrical. The Conservative allocation with 20% equities does have some sensitivity to the stock market, while as allocation to bonds decreases, portfolio sensitivity to the bond market changes slightly. This underscores how even slight asset allocation differences can impact risk and return, as shown in Figure 5.
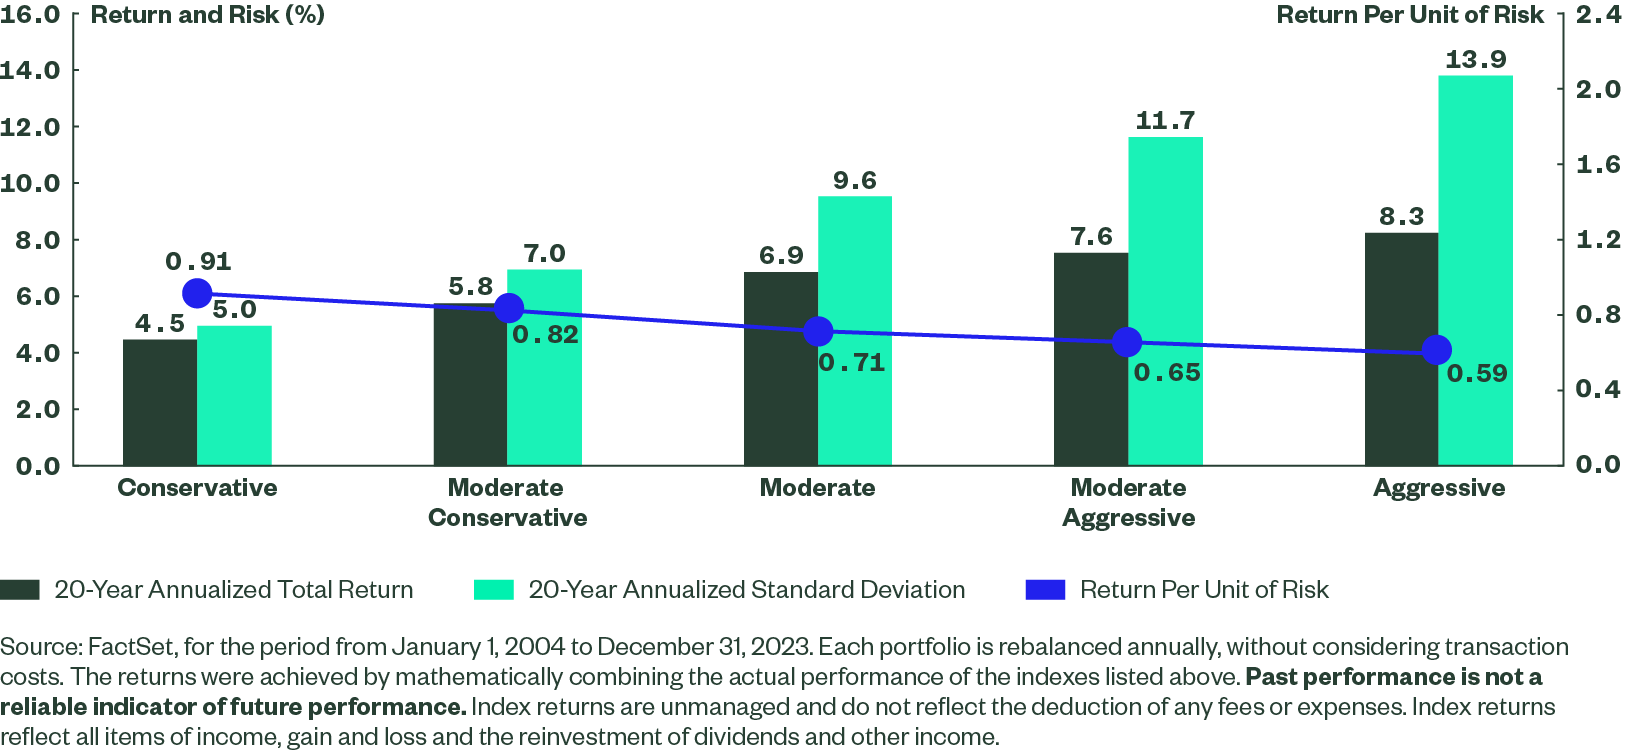
Figure 6 also illustrates the impact of moving up and down the risk spectrum and how modest adjustments to an allocation can dictate risk sensitivities.
Figure 6: 20-Year Risk and Return Profile
3. Control Costs
It’s this simple: high costs erode portfolio returns. And, as the largest part of your portfolio, the core should never be the most expensive component. So, as you add asset classes to the core to help improve stability, generate income or pursue performance, it’s important to ensure your portfolio’s cost profile remains under control.
How can high costs impact portfolio returns over the long term? Consider that the expense ratio of the median US-listed mutual fund is 0.98% a year.5 While that doesn’t seem like much, assuming an industry standard return target of 7%6 was met each year over a decade, investors consistently using mutual funds to gain core exposures would end up paying cumulative fees of 9.8% of starting principal. That’s more than 2% higher than one year of portfolio returns.
4. Impose Discipline
Once a strategic allocation is set, we believe investors should continue to manage it through systematic and disciplined portfolio rebalancing. Keep in mind that performance of different asset classes may shift the portfolio allocation over time. As shown in Figure 8, after two decades a buy-and-hold portfolio had a greater allocation to equities, exhibiting lower return per unit of risk. Therefore, it’s important to have a disciplined rebalancing program in place to ensure your portfolio doesn’t deviate significantly from your initial allocation and expose you to additional risk.
Figure 8: Rebalancing Can Impact Returns and Risks
Asset allocation of a 60/40 portfolio after 20 years
| Portfolio as of 12/31/2002 | Portfolio as of 12/31/2023: Annual Rebalance |
Portfolio as of 12/31/2023: Buy and Hold | |
|---|---|---|---|
S&P Composite 1500 Index |
36 |
36 |
58 |
S&P Developed ex United States BMI Index |
17 |
17 |
15 |
S&P Emerging BMI Index |
7 |
7 |
8 |
Bloomberg US Aggregate Index |
40 |
40 |
19 |
|
Annual Rebalance |
Buy and Hold |
|
20-year Annualized Return |
6.76 |
7.04 |
|
20-year Annualized Standard Deviation |
8.73 |
10.93 |
|
Return per Unit of Risk |
0.77 |
0.64 |
|
Source: FactSet as of December 31, 2023. The performance does not reflect any transaction costs. Past performance is not a reliable indicator of future performance. The returns were achieved by mathematically combining the actual performance of the indexes listed above. Index returns are unmanaged and do not reflect the deduction of any fees or expenses. Index returns reflect all items of income, gain and loss and the reinvestment of dividends and other income.
Invest with SPDR® Portfolio ETFs: Low-Cost Building Blocks
For investors seeking to expand their toolbox for diversification, we provide a comprehensive suite of low-cost ETFs covering detailed segments of the broad equity market and fixed income exposures. Our family of 23 SPDR Portfolio ETFs covers domestic and international equity and fixed income categories, making it easy to construct cost-efficient customized cores. Whether you seek to generate income, manage risk or grow capital, you can build a core with funds that have a median expense ratio of just 4 basis points.7
Figure 9: SPDR Portfolio ETFs
Exposure |
Fund Name |
Ticker |
Gross Expense Ratio (%) |
|---|---|---|---|
US Equity |
|||
Broad Market |
SPDR® Portfolio S&P 1500® Composite Stock Market ETF |
SPTM |
0.03 |
Large Cap |
SPDR® Portfolio S&P 500® ETF |
SPLG |
0.02 |
Mid Cap |
SPDR® Portfolio S&P 400TM Mid Cap ETF |
SPMD |
0.03 |
Small Cap |
SPDR® Portfolio S&P 600TM Small Cap ETF |
SPSM |
0.03 |
Growth |
SPDR® Portfolio S&P 500® Growth ETF |
SPYG |
0.04 |
Value |
SPDR® Portfolio S&P 500® Value ETF |
SPYV |
0.04 |
Dividend Income |
SPDR® Portfolio S&P 500® High Dividend ETF |
SPYD |
0.07 |
Dividend Income |
SPDR® Portfolio S&P Sector Neutral Dividend ETF |
SPDG |
0.05 |
International Equity |
|||
Global Stock |
SPDR® Portfolio MSCI Global Stock Market ETF |
SPGM |
0.09 |
Developed ex-US |
SPDR® Portfolio Developed World ex-US ETF |
SPDW |
0.03 |
Europe |
SPDR® Portfolio Europe ETF |
SPEU |
0.07 |
Emerging Markets |
SPDR® Portfolio Emerging Markets ETF |
SPEM |
0.07 |
Fixed Income |
|||
US Aggregate |
SPDR® Portfolio Aggregate Bond ETF |
SPAB |
0.03 |
Short Corporate |
SPDR® Portfolio Short Term Corporate Bond ETF |
SPSB |
0.04 |
Intermediate Corporate |
SPDR® Portfolio Intermediate Term Corporate Bond ETF |
SPIB |
0.04 |
Long Corporate |
SPDR® Portfolio Long Term Corporate Bond ETF |
SPLB |
0.04 |
Broad Corporate |
SPDR® Portfolio Corporate Bond ETF |
SPBO |
0.03 |
Short Government |
SPDR® Portfolio Short Term Treasury ETF |
SPTS |
0.03 |
Intermediate Government |
SPDR® Portfolio Intermediate Term Treasury ETF |
SPTI |
0.03 |
Long Government |
SPDR® Portfolio Long Term Treasury ETF |
SPTL |
0.03 |
Mortgages |
SPDR® Portfolio Mortgage Backed Bond ETF |
SPMB |
0.05 |
High Yield |
SPDR® Portfolio High Yield Bond ETF |
SPHY |
0.05 |
TIPS |
SPDR® Portfolio TIPS ETF |
SPIP |
0.12 |
Source: State Street Global Advisors, as of February 29, 2024. A fund’s net expense ratio includes waivers and reimbursements. It is the actual expense ratio that investors paid during the fund’s most recent fiscal year. Some of the funds listed may have current fee agreements in place that reduces fund expenses and if removed or modified will result in higher expense ratios and reduce fund performance. Complete details can be found in each fund’s prospectus on our website ssga.com.
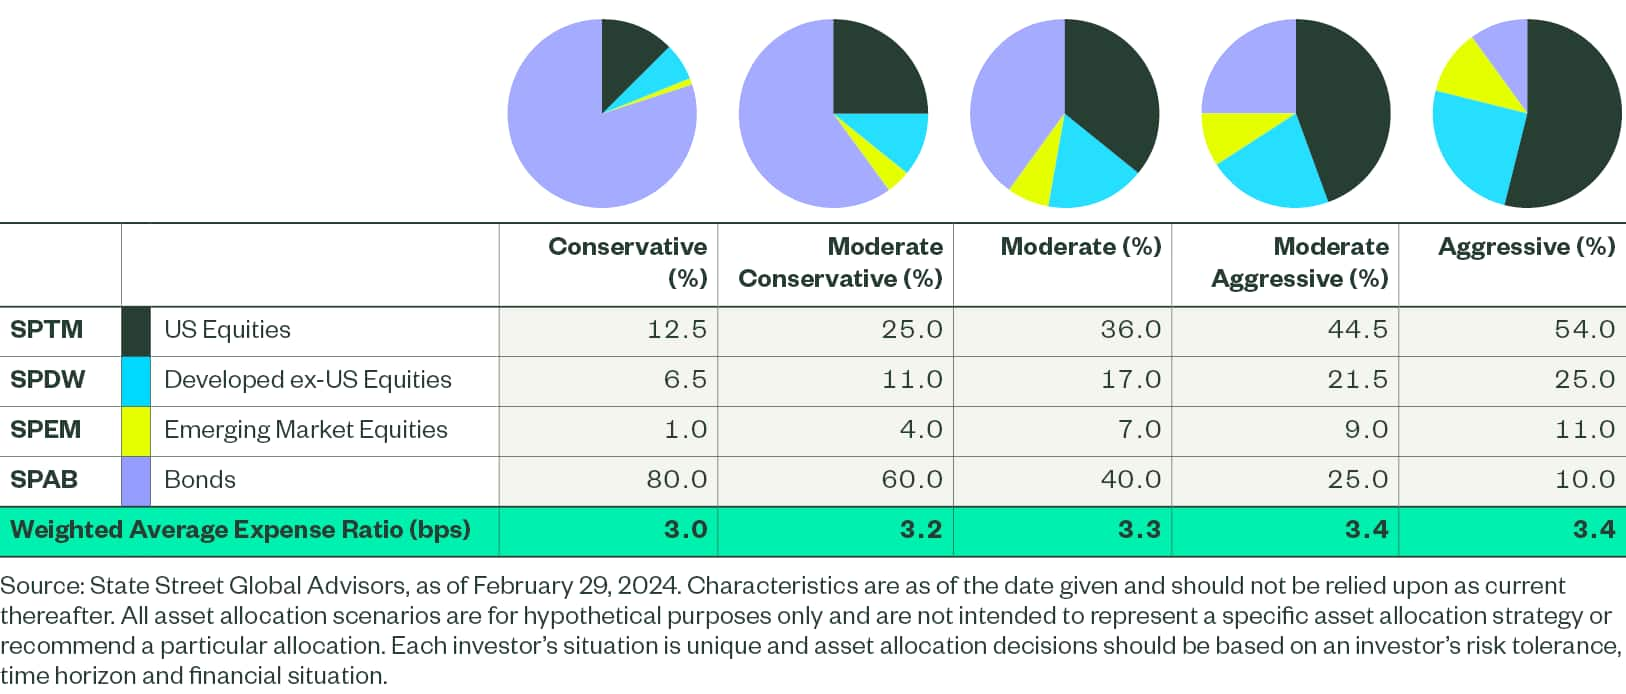
For thoughts on how you can build portfolios that match your clients’ risk/return objectives, check out five illustrative allocation examples. From conservative to aggressive allocations, each of these portfolios seeks to enhance diversification by offering exposure to thousands of securities across more than 90 countries.8 And all have a weighted average expense ratio between 3.0 to 3.5 basis points.
Figure 10 : 5 Hypothetical Risk-based Core Portfolio Examples for Around 3 Basis Points
Prefer to outsource portfolio management? Consider our State Street Strategic Asset Allocation ETF Portfolios, six risk-based models all with a weighted average expense ratio under 10 basis points.
Do More with Your Core – For Less
While constructing a core with a long-term strategic view, you also want to be able to adjust your allocations with more targeted allocations to address client-specific needs and respond to shifts in market regimes.
A core built with SPDR Portfolio ETFs provides the support you need to pivot confidently in any direction. Our line-up of 23 funds can help you expand your toolkit to pursue outcome-oriented objectives, such as:
Seek Growth and Income
Consider allocating a portion of your core equity exposure to segments focused on stocks with higher-than-average earnings growth and/or higher than average dividend yields.
- SPYG SPDR Portfolio S&P 500® Growth ETF
- SPYD SPDR Portfolio S&P 500® High Dividend ETF
- SPDG SPDR Portfolio S&P Sector Neutral Dividend ETF
Seek Capital Appreciation
Consider allocating a portion of your core equity exposure to segments that represent long-term opportunities due to expanding growth rates, improving valuations and demographic shifts.
- SPYV SPDR Portfolio S&P 500® Value ETF
- SPSM SPDR Portfolio S&P 600TM Small Cap ETF
- SPMD SPDR Portfolio S&P 400TM Mid Cap ETF
- SPEM SPDR Portfolio Emerging Markets ETF
Manage the Impact of Fluctuating Interest Rates
Consider tailoring your core fixed income exposure to either shorten or lengthen duration depending on your view of rate movements, without taking on additional credit risk.
- SPTS SPDR Portfolio Short Term Treasury ETF
- SPTI SPDR Portfolio Intermediate Term Treasury ETF
- SPTL SPDR Portfolio Long Term Treasury ETF
- SPIP SPDR Portfolio TIPS ETF
Balance Income and Risk Within Bonds
Consider augmenting core aggregate bond allocations with precise credit exposures across different maturity ranges and credit quality brackets that represent a potential source of income.
- SPMB SPDR Portfolio Mortgage Backed Bond ETF
- SPSB SPDR Portfolio Short Term Corporate Bond ETF
- SPIB SPDR Portfolio Intermediate Term Corporate Bond ETF
- SPLB SPDR Portfolio Long Term Corporate Bond ETF
- SPHY SPDR Portfolio High Yield Bond ETF
Choosing low-cost SPDR Portfolio ETFs may help you keep more of your return. Because when building your clients’ portfolios, every little bit counts. Visit the Low-Cost Core Portfolio homepage or call 866-787-2257 for more information.