Can the Top 3 Performing Sectors Continue to Lead?
Eight out of 11 sectors have posted gains in 2023. But three sectors — Communication Services, Information Technology, and Consumer Discretionary — have registered gains greater than 30% and outperformed the broader S&P 500 Index.1
What makes these sectors winners? And can the streaks continue? Look to our sector scorecard’s fundamental data and earnings trends insights for answers.
Scoring Sectors on Value, Momentum, and Sentiment
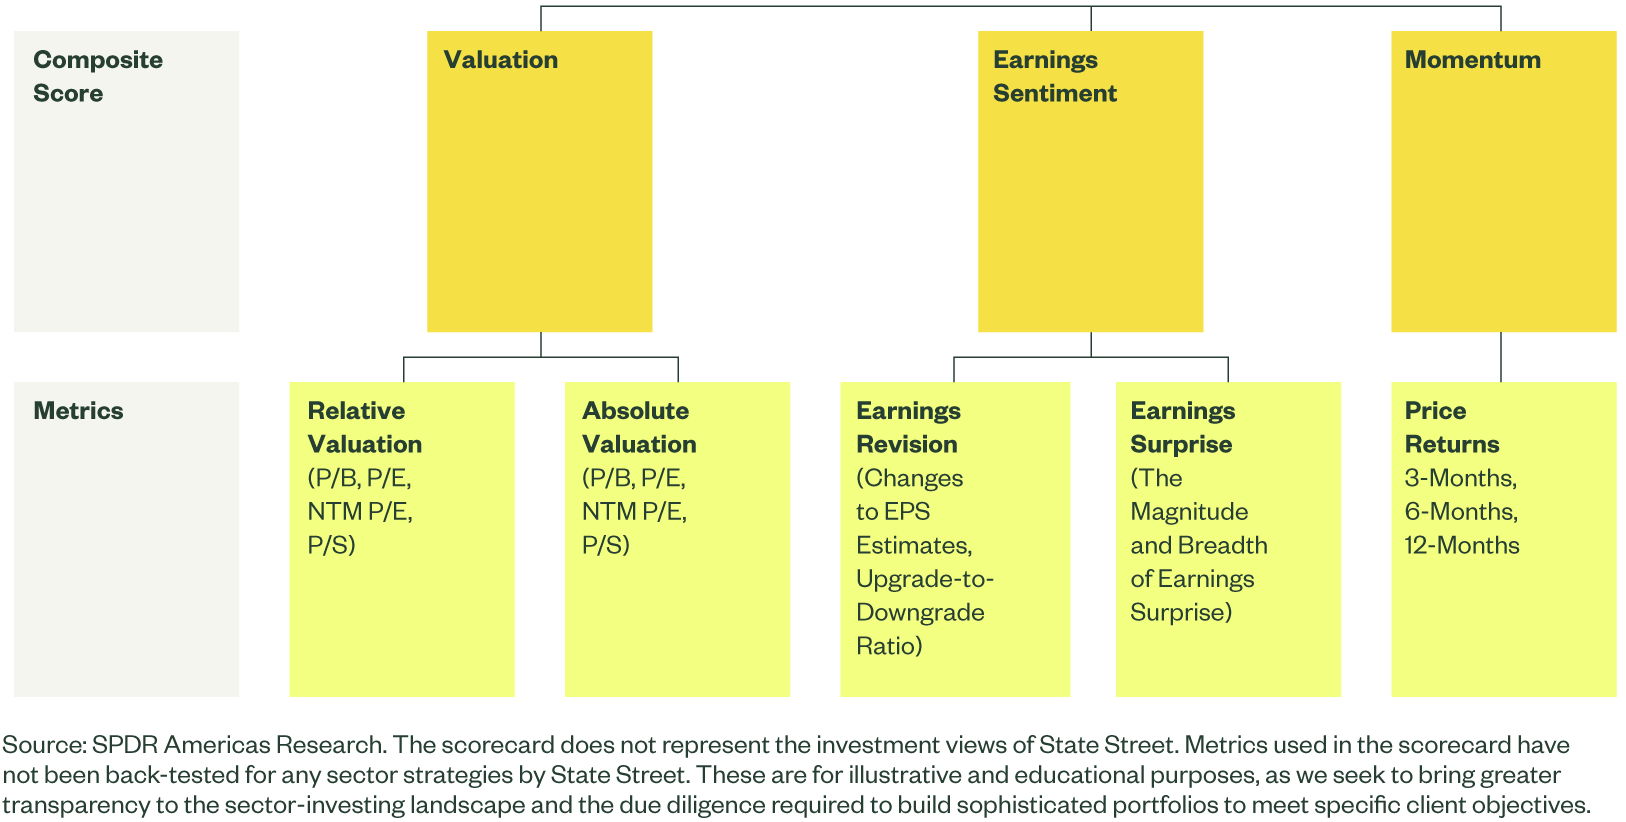
Each month our sector scorecard ranks S&P 500 sectors based on their prevailing valuations, price momentum, and earnings sentiment. We use each factors’ sub-metrics to create an aggregate score for the factor.
- For Value, each sector is ranked according to an absolute and relative valuation composite score. Both scores rank a sector’s trailing price-to-earnings (P/E), next-12-month price-to-earnings (NTM P/E), price-to-book (P/B), and price-to-sales (P/S) over the past 15 years. The absolute metric compares each ratio to a sector’s history, while the relative score compares a sector’s ratio to the S&P 500’s.
- For Momentum, each sector is ranked based on a blended Momentum factor calculated by combining recent — (not including the most recent month) 3-months, 6-months and 12-months — price performance.
- For Sentiment, each sector is ranked according to changes to the NTM EPS estimates over the prior three months, the EPS upgrade-to-downgrade ratio, and the magnitude and breadth of earnings beats in the current earnings season.
We then calculate z-scores, using the mean and standard deviation of the relevant metrics within the sectors. The z-score standardizes results across all sectors, making relative assessments easier. A composite score is created by equally weighting each metric’s z-score in the same category.
Sector Scorecard Overview
Momentum Leaders Top Sentiment
This framework reveals that the sectors with strongest technical price momentum also have the strongest earnings sentiment and most positive fundamental trends.
Communication Services, Information Technology, and Consumer Discretionary rank in the top three in both factors, as shown below. Industrials, the fourth ranked sector on Momentum, is the fourth-ranked sector on Sentiment as well.
| Sector Composite Z-Score | ||
|---|---|---|
| Momentum Composite Score | Earnings Sentiment Composite Score | |
| Communication Services | 1.01 | 0.51 |
| Consumer Discretionary | 1.21 | 1.22 |
| Consumer Staples | -0.66 | 0.07 |
| Energy | -0.62 | -1.59 |
| Financials | -0.35 | -0.45 |
| Health Care | -0.57 | -0.29 |
| Industrials | 0.32 | 0.34 |
| Information Technology | 1.92 | 0.97 |
| Materials | -0.15 | -0.8 |
| Real Estate | -0.9 | 0.32 |
| Utilities | -1.22 | -0.3 |
Source: FactSet, as of July 31, 2023. Top three sectors are in green, bottom three sectors are in orange. Past performance is not a reliable indicator of future performance.
This indicates investors are buying growth at a time when earnings growth is scarce. Expected Q2 growth is forecast to be negative for the third consecutive quarter, and Q3 expectations point to just 0.2% growth.2
And the four sectors in the right-hand upper quadrant of the earnings sentiment chart below have strong growth and strong surprises and also rank the also highest in Momentum. This buying behavior also aligns with pure factor exposures, as Growth stocks have outpaced Value stocks by 23% this year.3
The takeaway? Sectors that deliver above average results are being heavily rewarded — leading to elevated Momentum.

Valuations a Concern for the Leaders
But the valuation scores of sectors with high Momentum and Sentiment rankings have taken a hit. Only Communication Services escapes the bottom three based on valuations. Industrials, the fourth-ranked Momentum and Sentiment sector, completes the bottom three.
Growth Sectors Score Poorly on Value
| Sector Valuation Composite Z-Score | |
|---|---|
| Communication Services | 0.11 |
| Consumer Discretionary | -0.99 |
| Consumer Staples | 0.11 |
| Energy | 1.05 |
| Financials | -0.28 |
| Health Care | 0.36 |
| Industrials | -0.36 |
| Information Technology | -1.56 |
| Materials | 0.58 |
| Real Estate | 1.11 |
| Utilities | 0.38 |
Source: FactSet, as of July 31, 2023. Top three sectors are in green, bottom three sectors are in orange. Past performance is not a reliable indicator of future performance.
Digging into the score reveals that Communication Services’ NTM P/E is in the top three on both an absolute and relative basis. In fact, Communication Services doesn’t rank in the bottom three sectors across any metric (absolute or relative). The same cannot be said for Information Technology. Tech ranks as the most expensive in all four relative and all four absolute metric screens.
A time series of the NTM P/E and P/S of Information Technology illustrates how stretched this sector has become, even though earnings and sales have been strong recently. In fact, those two metrics relative to the sector’s history are now near 15-year highs.
Momentum and Sentiment Overpower Valuations
Given that the z-score process standardizes the results, all scores can be combined to create an overall aggregate score to ascertain the sectors with the strongest Sentiment and Momentum — as well as constructive valuations.
Despite the poor valuation rankings, the overwhelmingly strong Sentiment and Momentum readings push Consumer Discretionary and Information Technology into the top three. And Communication Services, based on the combined rank of all the scores, is the top-ranked sector, as shown below.
Communication Services Ranks Highly
| Sector Composite Z-Score | ||||
|---|---|---|---|---|
| Valuation Composite Score | Momentum Composite Score | Earnings Sentiment Composite Score | Aggregate Score | |
| Communication Services | 0.11 | 1.01 | 0.51 | 0.54 |
| Consumer Discretionary | -0.99 | 1.21 | 1.22 | 0.48 |
| Consumer Staples | 0.11 | -0.66 | 0.07 | -0.16 |
| Energy | 1.05 | -0.62 | -1.59 | -0.39 |
| Financials | -0.28 | -0.35 | -0.45 | -0.36 |
| Health Care | 0.36 | -0.57 | -0.29 | -0.17 |
| Industrials | -0.36 | 0.32 | 0.34 | 0.1 |
| Information Technology | -1.56 | 1.92 | 0.97 | 0.44 |
| Materials | 0.58 | -0.15 | -0.8 | -0.13 |
| Real Estate | 1.11 | -0.9 | 0.32 | 0.17 |
| Utilities | 0.38 | -1.22 | -0.3 | -0.38 |
Source: FactSet, as of July 31, 2023. Top three sectors are in green, bottom three sectors are in orange. Past performance is not a reliable indicator of future performance.
If the markets keep rewarding growth and these sectors continue delivering strong results, they may keep their place at the head of the sector table. And as of right now, Communication Services has the most attractive quantitative foundation to build on its 40% gain4 — and it could land as the year’s top performer.
For more insights on market trends, check out our Chart Pack.