Gold 2026 Outlook: Can the structural bull cycle continue to $5,000?
- The 2025 gold price rally—the strongest annual performance since 19791—likely will moderate in 2026, with gold possibly consolidating higher at $4,000–$4,500.
- Structural bull cycle forces supporting gold include US Federal Reserve (Fed) easing, robust central bank and retail demand, ETF inflows, elevated stock/bond correlations, and global debt concerns.
- Strategic reallocations and geopolitical factors could create a tailwind for gold to reach $5,000/oz.
Five forces driving gold’s bull cycle
When asked if $5,000/oz gold is in play for 2026, we think back to August 1994 and the debut studio album title for legendary British rockers Oasis (who went on an epic world tour in 2025): Definitely Maybe.
In the middle innings of a structural bull cycle, five structural forces continue to shape the gold market. These trends are unlikely to reverse in 2026 and, collectively, point to a supportive backdrop for prices. Importantly, these drivers are separate from short-term factors such as volatility spikes, risk-asset sell-offs, or stagflation fears that could temporarily boost gold demand:
1. Alternative fiat and global debasement trade. Global sectoral debt rose to $340T in mid-2025 and, notably, the government share of that debt also reached a record 30%.2 At 3-4x global GDP, debt levels raise concern for investors. As record debt and stubborn inflation push long-term yields higher, gold becomes an attractive hedge against duration risk and currency debasement.
2. Elevated stock/bond correlations. US stock/bond correlations soared to 30-year highs during the post-COVID inflation spike and Fed tightening cycle.3 While correlations eased somewhat in 2025, it is unclear whether they will return to the inverse relationship that dominated the 2000s and 2010s. Meanwhile, the gold/US dollar (USD) correlation remains anchored. If stock/bond correlations remain historically elevated, gold’s role as a diversifier and left-tail hedge becomes even more important as investors seek alternatives to traditional 60/40 or 70/30 portfolios.
3. ETF re-stocking and global reallocation cycle. Gold is both a financial and physical asset. Gold ETF holders redeemed shares—providing physical gold supply to the market—for nearly four years following the 2020 recession. The 2025 rebound in investor demand for gold ETFs supports the underlying financial price and tightens physical balances. And there should be significant room to run in 2026 (see ETF demand section). Gold ETF inflows compete with other sources of gold consumption and can require higher spot prices to rationalize demand.
4. Fed easing and US policy impact the USD. The Fed has shifted to an easing bias and will likely have a more dovish chairperson appointed in 2026. Combined with Trump administration rhetoric and post-Liberation Day US retrenchment, this points to a weaker USD. Lower policy rates reduce the opportunity cost of holding a non-yielding asset, while Fed cuts may trigger some reallocation from money market funds, which hold a record $7.5T as of November 2025.4 Fed easing also tends to weaken the USD by narrowing cross-border interest rate differentials and expanding liquidity (see Fed easing section). Fed easing and a weaker USD create a dual tailwind for gold, both directly through lower real yields and via denomination effects.
5. Robust physical demand. Although below the record pace of 2023-2024, Chinese retail demand and robust emerging market (EM) central bank gold purchases remain tailwinds for gold (see central bank and APAC sections). In 2H 2025, China’s physical demand surprised to the upside, despite record prices. Official sector buying has proven price-inelastic, signaling resilience. Strong pockets of physical demand that are non-cyclical (central banks) and idiosyncratic (China retail) add to gold price support and dampen downside risks.
How gold’s price regime shifted post-pandemic
The post-pandemic regime shift is rebasing gold markets to a higher range. Framing the price cycle over the past half-decade reveals three distinct phases.
Figure 3: Anatomy of a gold bull cycle
| Phases | Years | Price driver | Price range (US$/oz) |
| Phase 1 | 2021-2023 | Physical demand surge: Central bank buying + Chinese retail rebound post-2020 recession | Established $2,000/oz support |
| Phase 2 | 2024-2025 | Return of ETF investors: Inflows from US & Western markets reversing 3.5 years of de-stocking | Solidified $3,000/oz level |
| Phase 3 | 2025-2026 | Global debasement trade: Strategic reallocation to gold, demand for liquid alternatives and diversification | Potential $4,000–$5,000/oz baseline |
Source: State Street Investment Management, as of November 20, 2025.
The reallocation story gains credibility when we consider the relative size of markets. We estimate nearly $14T is invested in gold5—including central bank holdings, physical bars and coins, ETFs, and OTC positions. This compares with more than $100T in global government debt6 and roughly $150T equity market capitalization as of 4Q’25.7
A modest 1.0% reallocation from government bonds and equities into gold would represent about $2.5T—an 18% increase in outstanding gold investments—in what is already a tight physical gold market.
Such a shift could both support prices and create a tailwind to $5,000/oz.
ETF demand: The next leg of gold’s rally
As we anticipated in the beginning of 2025, gold ETF inflows have materially tightened gold supply/demand balances and have been a primary driver of this year’s outperformance, with the current accumulation cycle poised to contribute further.
To date, gold ETFs have:
- Posted five consecutive months of inflows globally
- Lifted the year-to-date total to a milestone of US$72B (674 tonnes (t))
- Beat 2020’s record year of ~US$50B (893t) with two months to spare.8
North American funds are leading the charge with:
- Record year-to-date inflows of US$43B9
- Inflows to US funds of US$16B (137t) in 3Q10
- US accounting for 62% of global inflows11
India’s ETF investor base has also accelerated by:
- Reaching a record year-to-date total of nearly US$2.9B
- Nearly matching 2020 to 2024’s cumulative total of US$3B.12
We expect ETF inflows to remain resilient. Even on the market’s largest single-day decline in 12 years, the leading US-listed gold ETFs did not report outflows.13 In fact, North American funds recorded positive inflows of US$334M (2.3t), highlighting the strength of gold ETF demand.14
Figure 4: ETF re-stocking cycles & 2026 flow scenarios
| Cycle | Period | Duration (weeks) | Build (tonnes) |
| Cycle 1 | Late 2008 – Late 2012 | 221 | +1,823t |
| Cycle 1 | Early 2016 – Late 2020 | 253 | +2,341t |
| Current cycle | May 2024 - | 77 | +825t (to date) |
Source: World Gold Council, and State Street Investment Management, as of 10/31/2025.
Notably, the current cycle’s duration ranks 35% and 31% of prior cycles in length and 45% and 35% of prior cycles’ build.15 Based on an average historical pace of ~8.75t/week, a 2026 run-rate and 2026 inflow estimates amount to:
- 25% 114t
- 50% 228t
- 75% 341t
- 100% 455t
Source: State Street Investment Management, as of 10/31/2025.
Even 100% is 543t short of the 2008–2012 total and 1,061t short of 2016–2020 total.16 So, while 2025 gold inflows are the strongest since 2020,17 total ETF holdings in tonnage terms remain below the pandemic peak, suggesting the sector is not over-allocated.
Fed easing: A dual tailwind for gold
The Fed’s Summary of Economic Projections (SEP) serves as a compass to where policymakers believe rates to settle over time. While headlines often focus heavily on the next rate decision, the SEP provides insight into the Fed’s long-term thinking.
Historically, the fed funds rate fluctuates in cycles but tends to converge toward the SEP’s long-run projection (Figure 6). Today, the policy rate is well above that target, suggesting continued easing in 2026, especially if labor market conditions weaken.
Slower growth and a softer labor market could reinforce the need for stimulus. Rate cuts historically support gold by lowering the opportunity cost of holding a non-yielding asset.
The upcoming change in Fed leadership adds further uncertainty to markets. Chair Powell’s term ends in May, and that could mean heightened volatility in interest rate expectations. Early indications suggest the successor may be more dovish and respond more quickly to weakening economic data.
Another key factor is the Fed’s shift in balance-sheet strategy. Its decision to halt Quantitative Tightening (QT) marks an inflection point from balance sheet contraction toward a more supportive stance.18 Recent use of liquidity facilities, including a roughly $50B draw on repo backstops,19 shows the Fed is willing to inject reserves when funding stress appears. While though these operations aren’t referred to as Quantitative Easing (QE), they work similarly by increasing liquidity in the system.
Gold typically rallies when the Fed shifts from tightening to adding liquidity.
Tariff rulings pressure bonds, could support gold
While Fed policy continues to create a supportive backdrop for gold, fiscal dynamics—shaped by recent tariff rulings—introduce a new layer of pressure on bonds that could further enhance gold’s appeal.
The Supreme Court’s decision limiting tariff authority has led investors to reassess the federal government’s revenue outlook. If tariff-related income declines in 2026, the Treasury likely will need to issue more debt to cover the gap, increasing supply at the long end of the curve.
That means the term premium may move higher even as the Fed cuts rates. This policy mismatch—tightening from the long end, and easing from the short end—could push the Fed to lower rates more aggressively to stabilize financial conditions. Such an environment tends to weaken real yields, reinforcing gold’s role as a store of value.
Rate cuts, a lower neutral rate under new Fed leadership, rising term premiums from fiscal stress, and more supportive balance sheet management all point to a weaker USD in 2026. As seen in the first seven to eight months in 2025, a soft USD tends to boost gold sentiment.20 Because gold is priced globally in USD, a weaker dollar, all else equal, raises gold prices and enhances global purchasing power, creating a strong tailwind for gold demand.
Strong central bank buying, especially in emerging markets
Price inelastic central banks continue to provide a steady source of gold demand, lifting the price floor and dampening downside price volatility. We expect continued accumulation, marking a 17th consecutive year of net official sector purchases since the Global Financial Crisis.
After two quarters of moderation, central bank buying reaccelerated in 3Q’25 to ~220t of net purchases, up:
- 28% vs. the prior quarter (172t)
- 6% above the five-year quarterly average (207t)
- 10% higher year-over-year (199.5t).21
Year-to-date demand stands at 634t—below the same period in each of the past three years but well above the pre-2022 norm of 400-500t.22
Emerging market central banks remain the engine of official sector demand. For example:
- Poland: The Narodowy Bank Polski, the largest gold buyer year to date, resumed its purchases in October with a 15t addition.23 This lifted total reserves to 530t, 26% of its overall holdings, as it moves toward a 30% target.24
- Brazil: Banco Central do Brasil re-entered the market after a two-year pause, accumulating 31t over the past two months.25 That raised its gold reserves to 161t, accounting for 6% of total holdings.26
- China: The People’s Bank of China extended its buying streak to 12 consecutive months, adding 25t since the end of 2024.27 Gold now accounts for 8% of China’s foreign exchange reserves, up from 5.5% a year ago.28
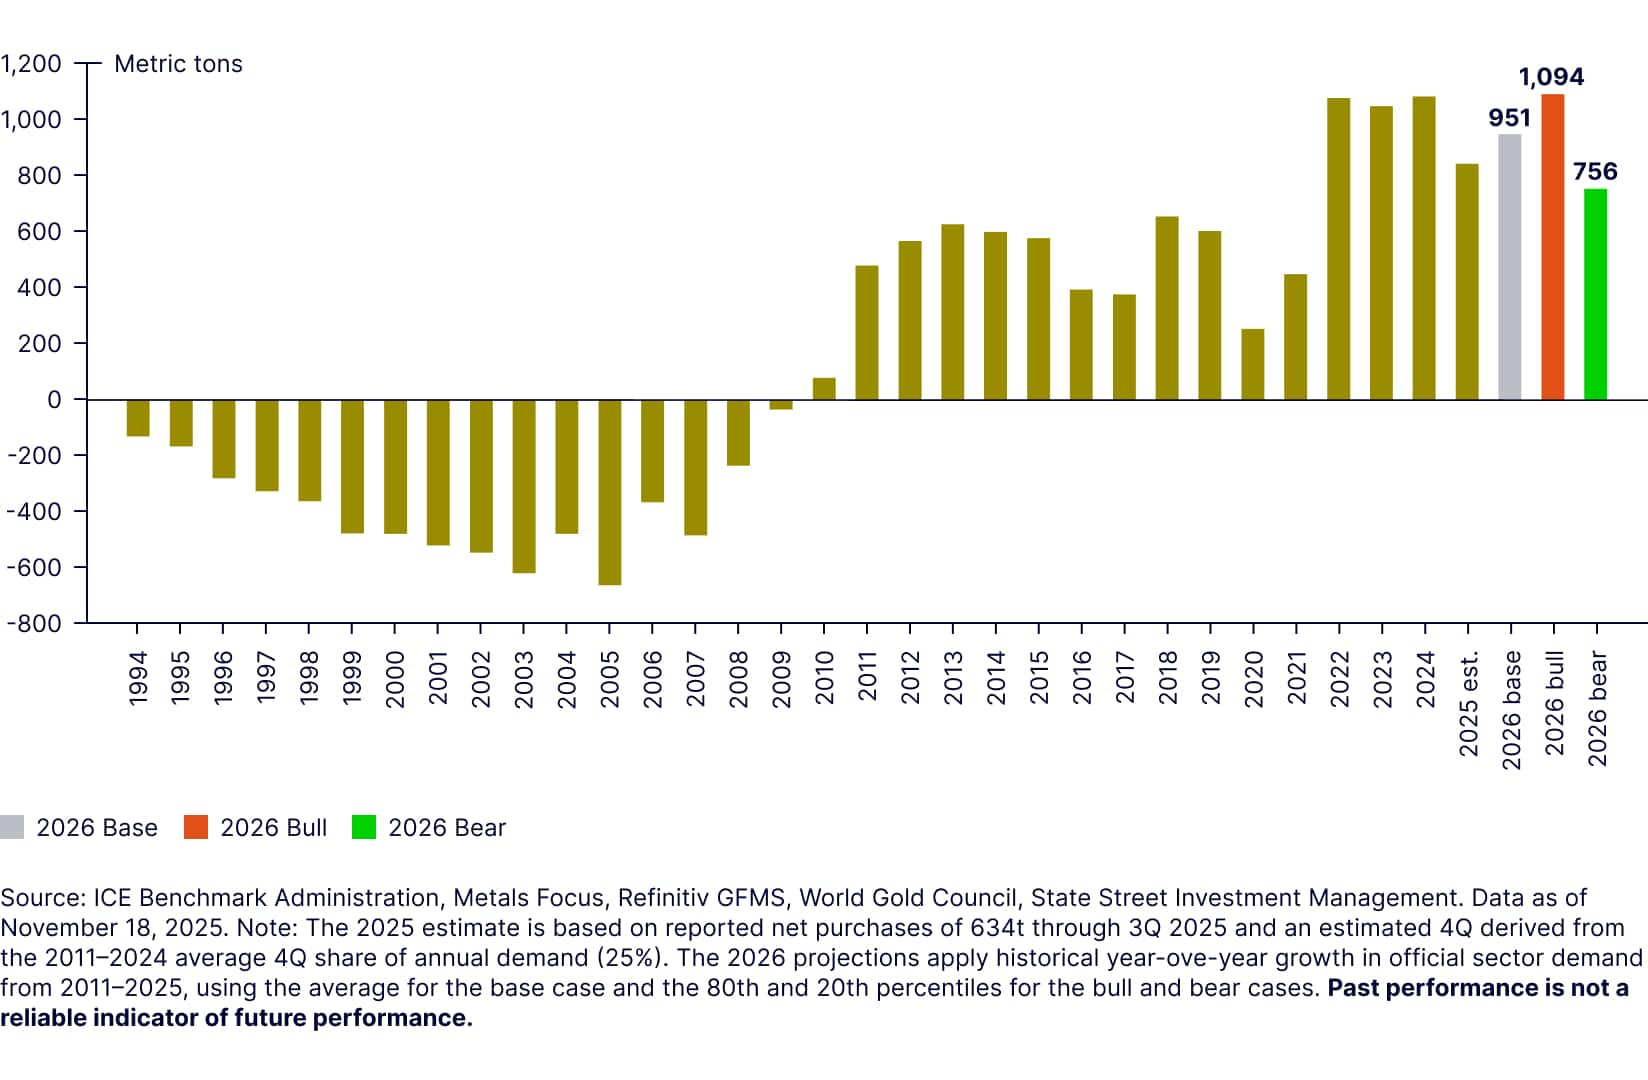
To estimate 2026 central bank demand, we began with 634t reported through 3Q’25 and projected 4Q using historical seasonal patterns, giving a full-year estimate of 845t.29 Based on historical year-over-year trends, 2026 demand could range from 756t to 1,100t. This would make 2026 one of the top five years for gold demand since 1971 gold.30
Figure 7: Central bank net purchases since 1994, with 2026 projections
Policy-driven and idiosyncratic support in APAC
APAC’s gold market is poised for strong growth in 2026, fueled by ETFs and broad retail and institutional demand. Geopolitical shifts and de-dollarization are driving diversification, with China, India, and Japan leading the trend.
China: Institutional demand and policy shifts
Gold investment demand in China has surged in recent years, driven by weakness in equity and property markets. Amid economic uncertainty and trade tensions, gold has served as a portfolio hedge.
In early 2025, a pilot program allowed 10 insurers to allocate up to 1% of their assets to gold. So far, six insurers have opened accounts with the Shanghai Gold Exchange.31 If the People’s Bank of China raises these limits, institutional demand could grow further.
China’s plan to serve as custodian for foreign sovereign gold reserves,32 announced in September, could spur new central bank buying from emerging markets seeking diversification and protection from sanctions. This move aims to create fresh demand rather than shift holdings from London or New York and reflects geopolitical strategy and push for renminbi-driven de-dollarization. While high local prices may dampen jewelry sector demand, strong interest in ETFs and the popularity of bean-shaped gold bars33 among young buyers should keep investment demand robust in 2026.
India: Economic growth and retail trends
With India’s economy on a rapid growth trajectory, asset managers are increasing their exposure to gold. Demand is supported by structural drivers such as rising incomes, inflation hedging, a weaker rupee, and cultural traditions like weddings and festivals. Recent regulatory reforms have further enhanced the appeal of gold-based financial instruments by simplifying the tax structure.
India’s gold ETF assets under management have soared to US$10.9B—up 15.5x since 2020, outpacing global AUM growth.34 Multi-asset funds that include gold are also fueling retail flows. Jewelry demand may soften as local prices rise, but structural drivers and increasing financial literacy should keep investment demand strong.
Japan: Investment demand and currency dynamics
In 2025, gold demand in Japan shifted toward investment, fueled by yen (JPY) weakness, NISA tax incentives, and record gold prices. Despite the Bank of Japan signaling a December rate hike, the JPY is the weakest G10 currency relative to the USD, down 4.3% this quarter.35
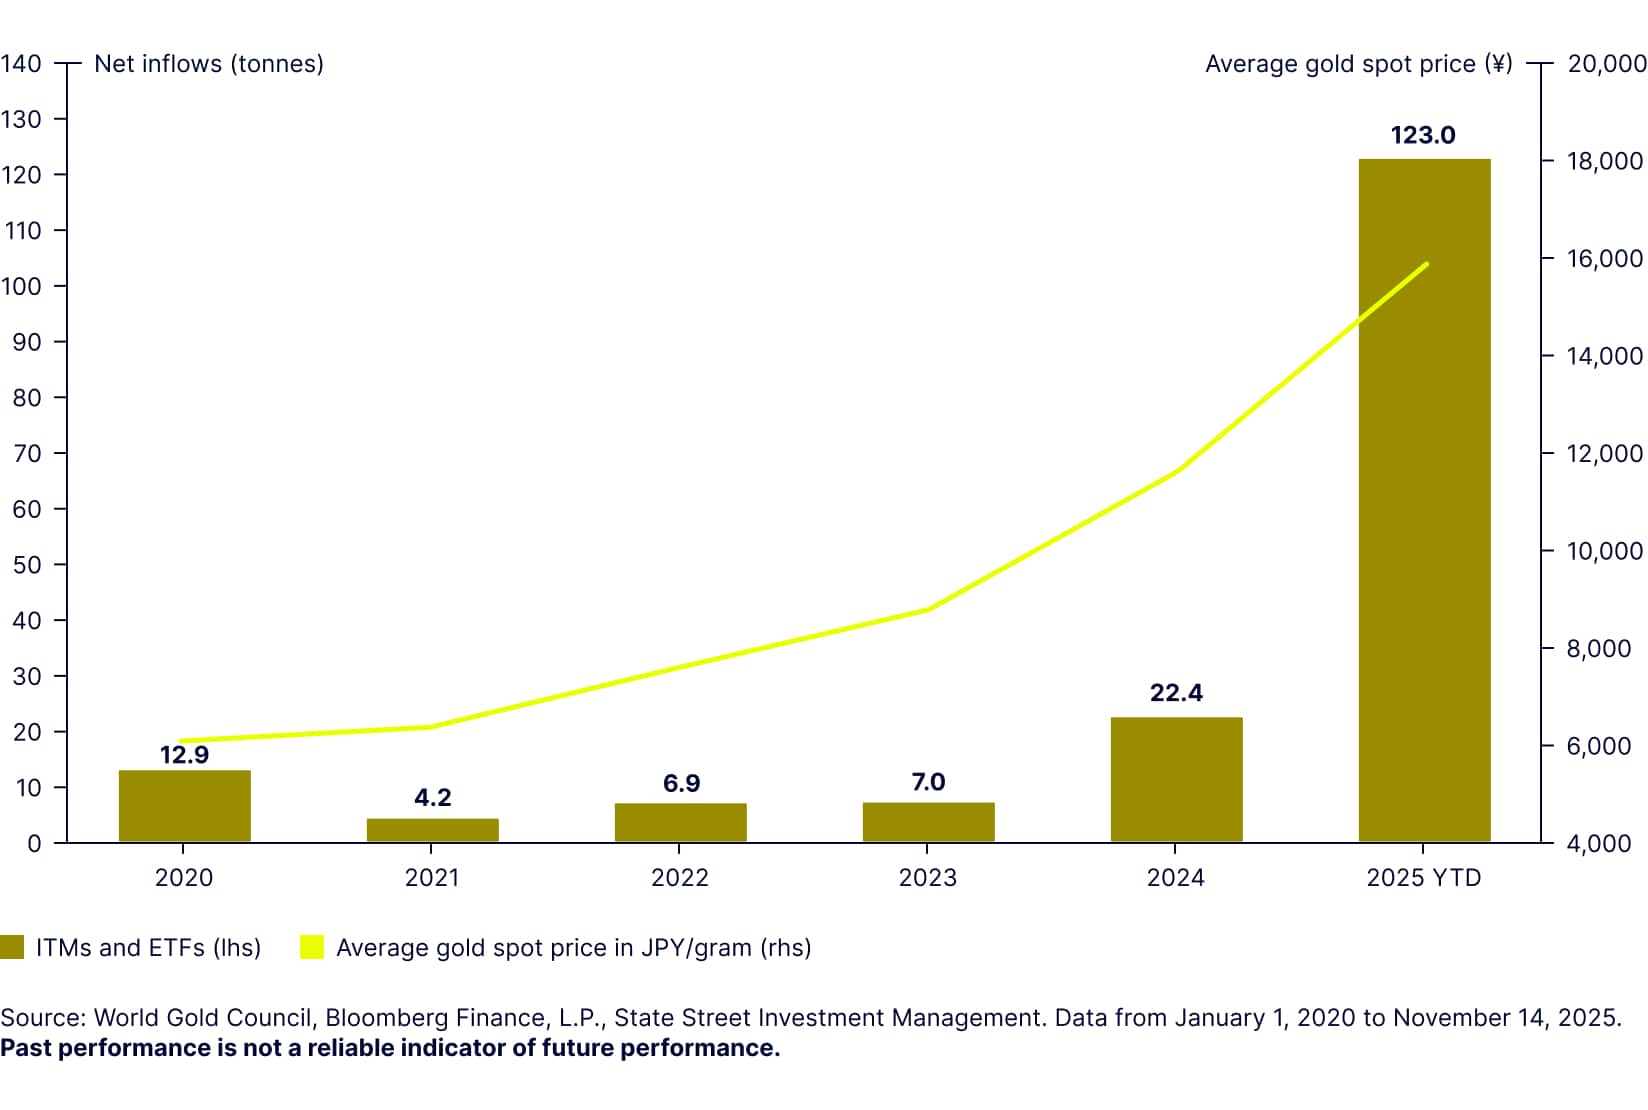
Jewelry demand looks muted, but investment channels—especially investment trust management funds (ITMs) and ETFs—saw strong inflows as households and institutions hedged against currency depreciation and macro uncertainty. Locally domiciled gold ITMs and ETFs have recorded net inflows of 123t year to date in 2025, up 5.5x versus full-year 2024—despite record prices.36
Japan’s pro-growth policies and monetary easing under Prime Minister Sanae Takaichi point to sustained JPY weakness and low real rates, which could support gold demand growth in 2026. Limited institutional ownership may spur strategic allocations, keeping demand structurally above pre-2024 levels even if the pace of growth moderates from a feverish 2025.
Figure 8: Strong inflows into ITMs and ETFs are fueling Japan’s investment demand
2026 gold price outlook: Base, bull, and bear cases
While the 2025 gold price rally will likely moderate in 2026, gold reaching $5,000/oz next year seems more likely than prices declining to $3,000/oz. And $4,000/oz could be the new $2,000/oz in a post-pandemic regime.
Base case (50% probability): $4,000-$4,500
Gold prices consolidate and grind higher in 2026, probably in the high single digits or low double digits price return area as a conservative baseline. This would be consistent with the gold price rally in 1980 following the outsized returns of 1978-1979.
The base case suggests the Fed could stay on pause after the December FOMC until 2H 2026 and the appointment of a new Fed chair. The USD grinds lower, but US growth also rebounds from a particularly lackluster 1H 2025. Central bank and China retail demand are within 3% of 2025 levels while gold ETF inflows are at 25-75% of the 2025 pace.
Bull case (30% probability): $4,500-$5,000
We maintain a bullish skew and see a 30% chance of gold prices hitting $5,000/oz. In this upside scenario, central bank and China retail demand are steady in 2026 versus 2025, and ETF flows are 75%-100% the pace of 2025. Any reacceleration of the USD downtrend, volatility/liquidity shock in risk assets, or fear of US stagflation could accelerate an eventual move above $5,000/oz.
The structural themes behind the global alt-fiat and debasement trade, potential widening of US fiscal debt/deficits, and US retrenchment suggest $5,000+ gold is viable in 2026—especially if physical demand stays unencumbered by record global prices and the reallocation theme favors increased gold exposure.
Bear case (20% probability): $3,500-$4,000
We acknowledge the potential for the USD rebound/stabilization and improved growth in 2026, especially if AI delivers productivity gains and ROI. While structural factors like US and global debt loads show no signs of resolving even in this bearish gold scenario, denomination effects from a USD slide and a return to “growth exceptionalism” would likely hit gold sentiment and prompt profit-taking.
Record-high gold prices hindering APAC physical demand (there were no meaningful signs for this on the aggregate in 3Q 2025) is also a risk. But we think there is plenty of cash on the sidelines to “buy the dip” at $3,500-$3,700/oz.
Get more insights from our Gold Strategy Team.