SDG Integration into Systematic Portfolios
The UN Sustainable Development Goals (SDGs) continue to form the framework for many sustainable equity portfolios. Our research shows that SDGs can be integrated into robust systematic equity portfolios that use quantitative, rules-based approaches for investment decisions.
A longer version of this article was published by The Journal of Impact and ESG Investing in the fall 2025 edition. Download the full research paper here.
Background: What are the SDGs?
The United Nations (UN) introduced the SDGs as a “blueprint to achieve a better and more sustainable future for all. They address the global challenges we face, including poverty, inequality, climate change, environmental degradation, peace and justice” (United Nations 2024b). There are 17 goals with 169 underlying targets, which specify a global understanding of sustainable development. Although the SDGs were primarily designed for nations, sustainable investors are increasingly aligning their investment strategies with the UN’s SDGs, with SDG funds growing from less than EUR 30 billion in January 2020 to EUR 74 billion in September 2023 (Balitzky and Mosson 2024).
The importance of SDG scores
Van Zanten and Huji (2022) suggest that SDG scores appear to align with the climate-related sustainability preferences of most asset owners and seem to be consistent with the EU taxonomy. Their findings indicate that companies with very high emissions generally receive lower scores, which reflects the importance of reducing greenhouse gas emissions to combat climate change.
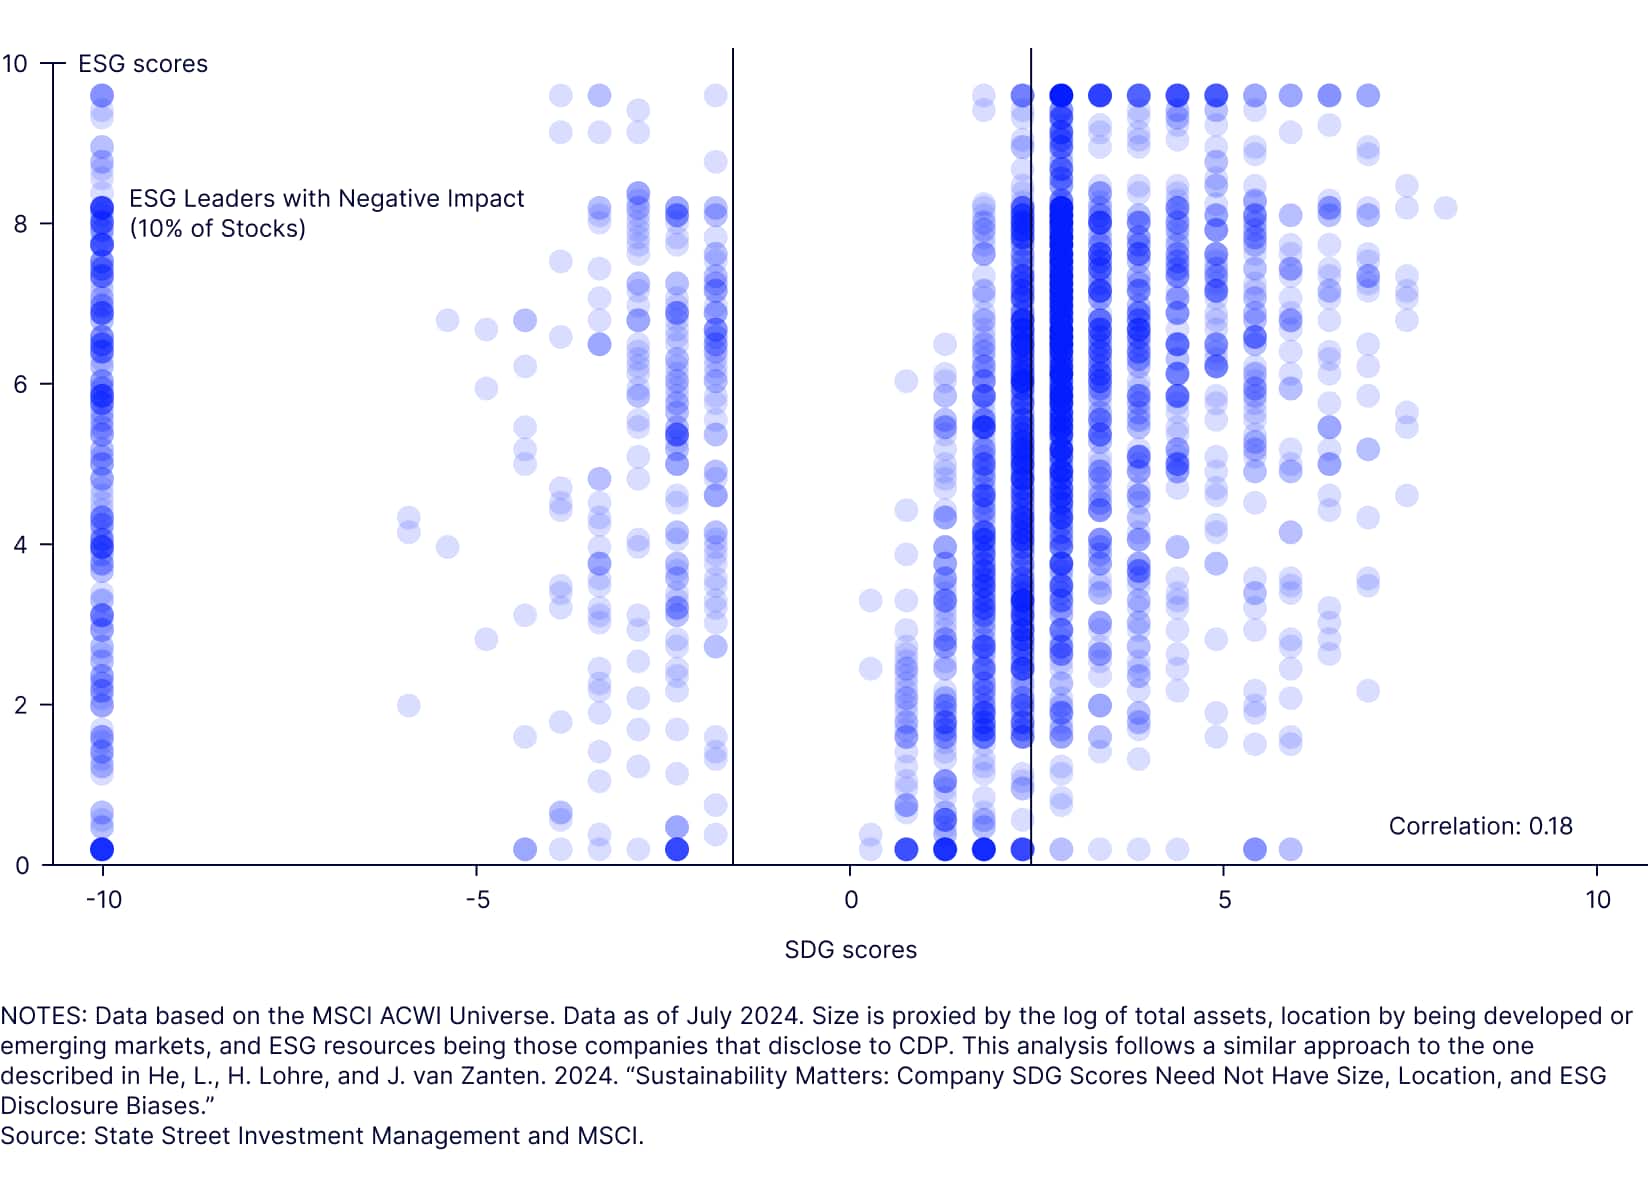
A further study by Van Zanten (2025) critically examines the alignment between environmental, social and governance (ESG) ratings and SDG scores, with a particular focus on the comparative performance of MSCI and Robeco’s SDG assessments. The analysis reveals a fundamental disconnect between ESG ratings and SDG scores (Figure 1). Specifically, the study finds no statistically significant correlation between the two, suggesting that ESG ratings do not reliably reflect companies’ actual contribu¬tions to sustainable development. This finding challenges the assumption1 thatESG metrics can serve as effective proxies for corporate sustainability impact.
From this research, the authors conclude that ESG ratings, SDG scores, and broader corporate sustainability assessments represent distinct yet complementary constructs. As such, investors and policymakers are advised to avoid conflating these measures and instead to adopt a more integrated approach that leverages the unique insights each framework provides.
1a: SDGs & ESG: Weakly Correlated
1b: SDG Scores Need Not Have Size, Location & ESG Resource Bias
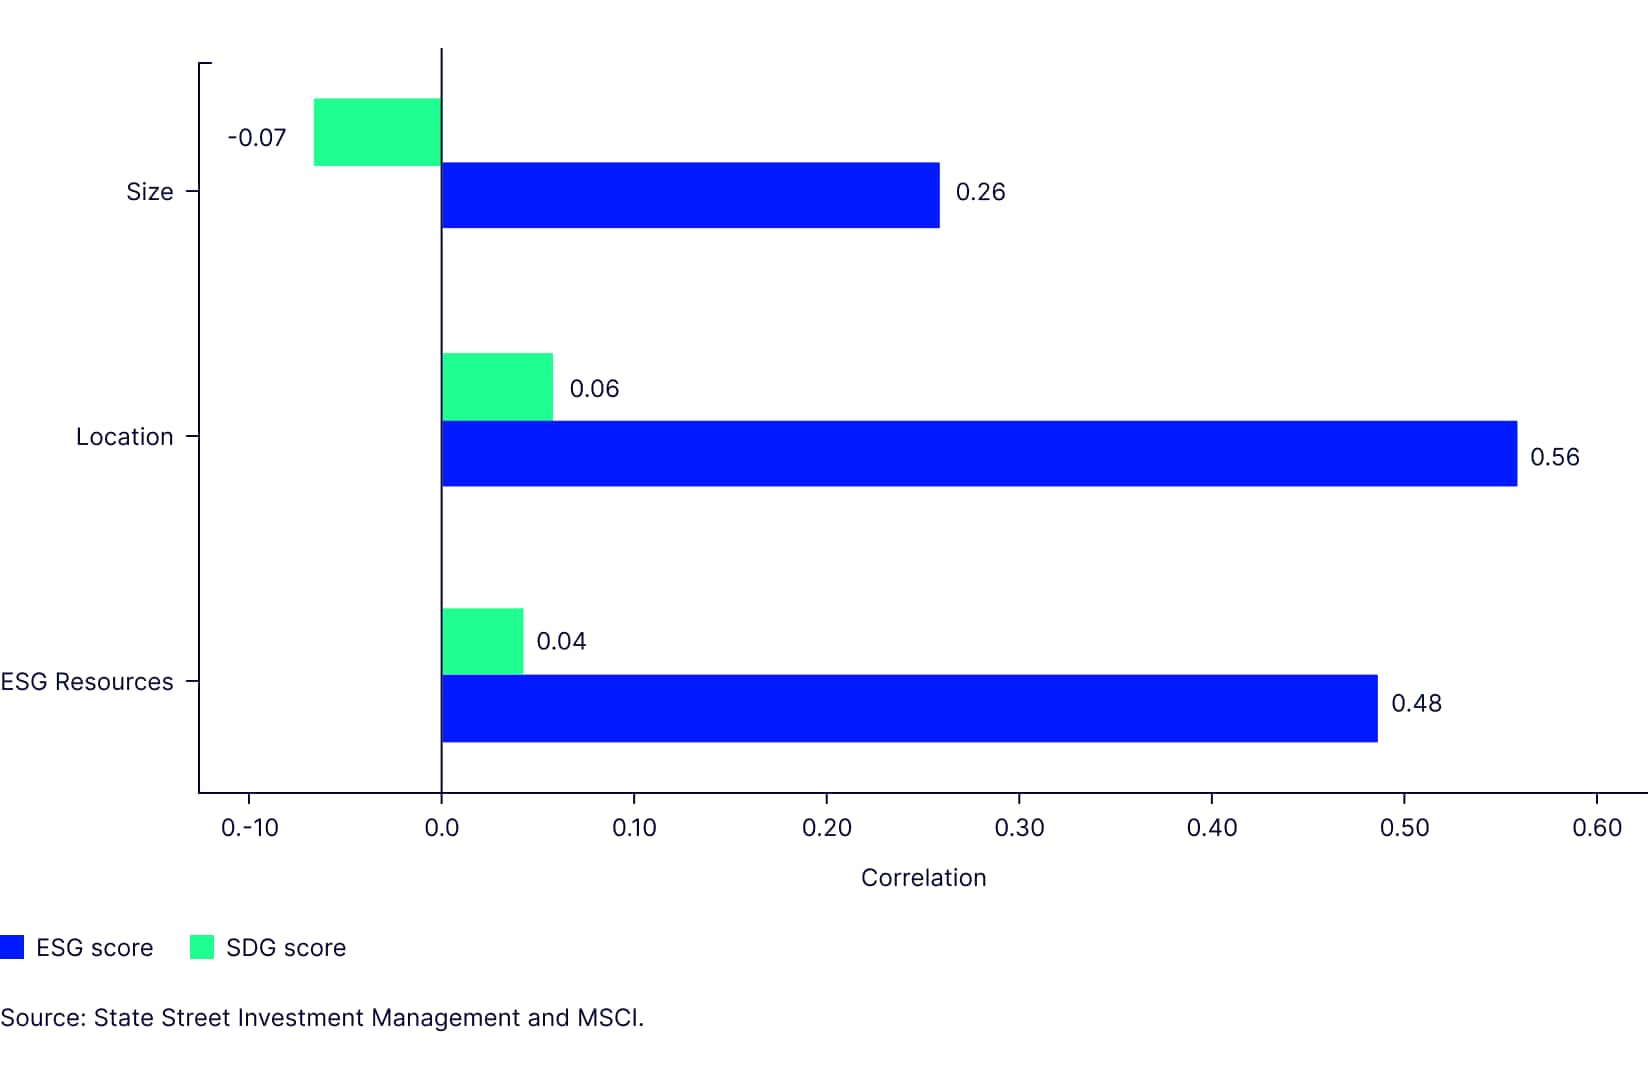
NOTES: Data based on the MSCI ACWI Universe. Data as of July 2024. Size is proxied by the log of total assets, location by being developed or emerging markets, and ESG resources being those companies that disclose to CDP. This analysis follows a similar approach to He et al. (2024).
SOURCES: State Street Investment Management and MSCI.
More on data
SDG data is collected by a wide range of data providers, such as MSCI, ISS, Robeco, SDI AOP, Inrate, Moody’s, Sustainalytics, and Impact Cubed. The data providers use the data in various ways, such as aggregating them into scores or providing raw data, and they incorporate controversies differently. For example, MSCI includes controversies in their operation scoring approach, whereas ISS treats controversies as a distinct pillar. Ultimately, although there are differences, there is meaningful overlap in methodology and intention of the data.2
Challenges to integrating SDG criteria into systematic equity strategies
When it comes to incorporating SDG data into investment portfolios, recent research from Impact Cubed (2024) and Blitz et al. (2024) demonstrates how SDG data can be systematically incorporated into investment portfolios using the same mean–variance optimization framework (see shaded box) as in constructing factor or sustainability portfolios. However, it is worth considering whether the resulting systematic equity portfolios are robust. In the realm of portfolio optimization, it is important to recognize that although theoretically any dataset can be optimized to construct a portfolio, this does not necessarily translate to practical utility for investors. We believe the true value of a portfolio lies in its relevance and alignment with investor goals.
Portfolios that consider SDG criteria face several challenges that could undermine their practical implementation, including:
- The data: both measuring company SDG impacts and aggregation across the SDGs
- Portfolio construction: to balance across the SDGs, provide an efficient solution and minimise unintended risks
- Robustness of portfolio outcomes
- Customisation: the ability to customise to client specific needs
What is mean-variance optimization?
Mean–vari¬ance optimization, originated by Harry Markowitz in 1952, assumes investors maximize their expected utility function consisting of expected returns (mean) and the risks (variance). The traditional return–risk objective function can be summarized as:
Max w^' r-λw^'∑w
In the above equation, w is the vector of security weights, r is the vector of expected returns for all securities, λ is the risk aversion, and ∑ is the covariance matrix for all securities. When investors do not have views on forecasted returns, the mean variance optimization is reduced to risk (or active risk) minimization problem.
In practice, we often apply additional investability and risk-miti¬gating constraints such as constraints on sectors, coun¬tries, liquidity, turnover, etc. in order to help mitigate the limitations of mean-variance optimization and refining the solutions.
Employing the mean-variance optimization framework, we constructed hypothetical portfolios designed to align with the SDGs while addressing the challenges above. The goal was to maintain an active risk-controlled portfolio while making meaningful improvements in the SDG profile.
Our starting point was the MSCI World Index, although this framework can be applied to other underlying universes as well. We then optimized this universe to minimize tracking error and transaction costs, ensuring alignment with the SDGs on a weighted average basis, targeting an aggregated SDG score of two or higher—the level MSCI deems to be SDG aligned.
Figure 2: Our SDG portfolio showed improvement across various sustainability criteria
Figure 2a: SDG Portfolio Outcomes
| Low Active Exposures, Similar Concentration | ||
| Benchmark | SDG Portfolio | |
| Ex-Ante Tracking Error (bps) | 0 | 48 |
| Predicted Beta | 1 | 0.9975 |
| Active Share (%) | 0 | 28.24 |
| Sector Active Share (%) | 0 | 2.73 |
| Country Active Share (%) | 0 | 2.04 |
| Stock Count | 1409 | 799 |
| Effective Number of Stocks | 108 | 113 |
| Weight in Top 10 Stocks (%) | 23.59 | 22.47 |
| Weight in Top 50 Stocks (%) | 41.3 | 40.77 |
| Sustainability Improvements | ||
| Benchmark | SDG Portfolio | |
| SDG Score | 0.44 | 2.01 |
| Environmental SDGs | 0.06 | 1.5 |
| Social SDGs | 0.12 | 1.5 |
| MSCI ESG Score | 6.94 | 7.2 |
| Carbon Intensity | 98.35 | 89.18 |
| Brown Revenues | 5.14 | 3.2 |
| Green Revenues | 8.4 | 10.1 |
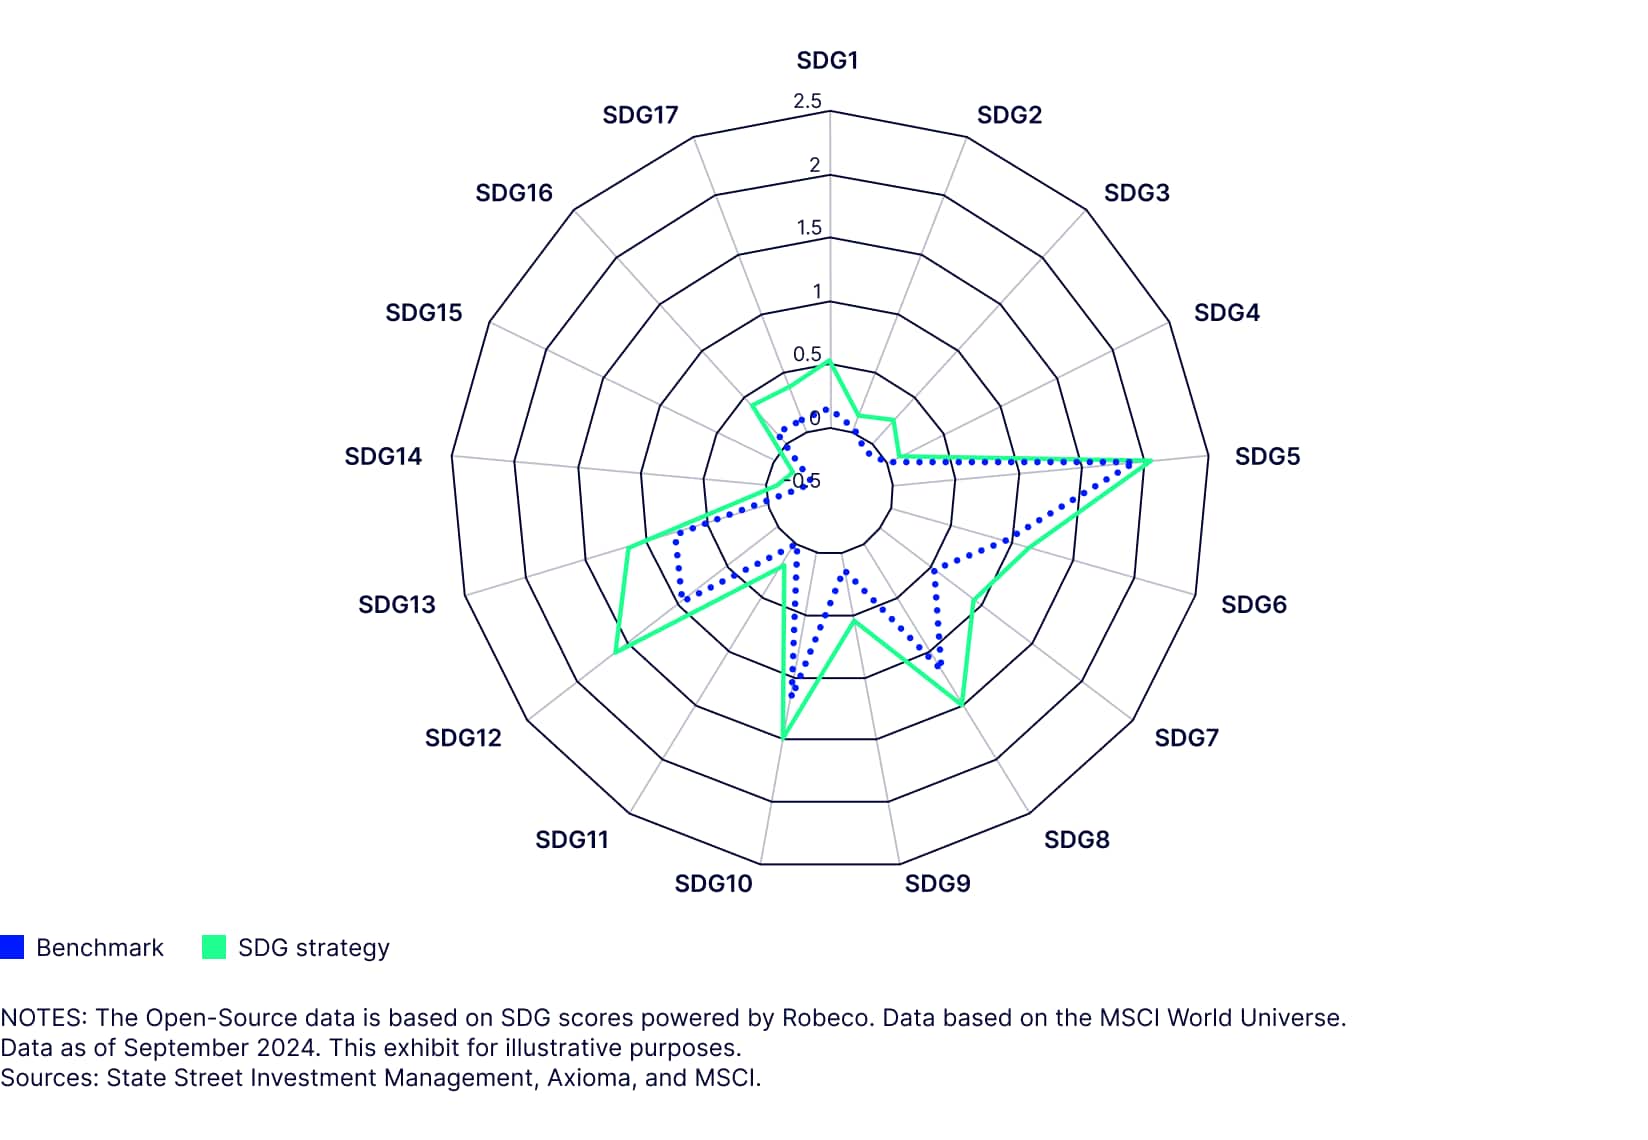
Figure 2b: Balanced improvement across SDGs
Portfolio robustness tests
To understand the robustness of our SDG portfolios, we consider three objective measures that are external to the portfolio itself (Figure 3), in which each of these tests require certain assumptions.
Firstly, we evaluate the portfolio by comparing it against the holdings of actively managed SDG funds (the “active managers test”). This yardstick can provide insight into how the simulated SDG portfolio stands relative to those managed by experienced professionals in the field.
Secondly, the portfolio is assessed against elements of the principles of adverse impact and the EU taxonomy (the “regulators test”). This regulatory framework aims to ensure that the portfolio adheres to stringent ESG, thereby aligning with broader sustainability goals.
Lastly, we utilize open-source data, specifically from Robeco, to further validate the portfolio. This independent data source offers an additional layer of transparency and accountability, potentially reinforcing the portfolio’s alignment with recognized sustainability metrics (the “open-source data test). Figure 3 explains how these tests can be used to measure robustness..
Figure 3: Understanding the rationale behind our robustness tests
| Portfolio Test | Description | Assumptions for Validity of Test |
| 1. Active Managers | Assess portfolio against the holdings of actively managed SDG funds. | '-Active portfolio managers can well assess corporate alignment with the SDGs -Active portfolio managers aim to allocate towards companies aligned with the SDGs within SDG labelled funds |
| 2. Regulators | Assess portfolio against elements of the principals of adverse imapct and the EU Taxonomy. | '-Regulators, and the scientists that have informed them, are able to, and desire to, build regulation that accurately reflects corporate impact towards the SDGs -Data utilised well captures the regulation |
| 3. Open-Source Data | Assess portfolio against open source Robeco data. | '-Robeco data is robust in design and implementation |
Note: This exhibit for illustrative purposes.
Source: State Street Investment Management.
Exploring our findings
From our observations, as illustrated in Figures 4a, 4b, and 4c, we noted several key findings:
Firstly, there is a meaningful alignment between the stocks preferred by active managers and those that are overweighted in the portfolio. This suggests that the preferences of active managers are reflected in the composition of the SDG portfolio, indicating a level of consistency in stock selection criteria.
Secondly, the SDG portfolio exhibits greater exposure to the EU taxonomy across various financial metrics, including revenue, CAPEX, and OPEX. Conversely, it has less exposure to Paris-Aligned Benchmark (PAB) exclusions.
Thirdly, the SDG strategy’s preferred stocks have a positive median Robeco SDG score, which Robeco defines as SDG aligned. In contrast, the least preferred stocks within the SDG strategy have a negative median Robeco SDG score. This differen¬tiation highlights a level of robustness of the SDG strategy in selecting stocks that align with the SDGs even when utilizing an alternative data source to measure, and avoiding those that do not meet these criteria.
Figure 4: Portfolio pass robustness tests
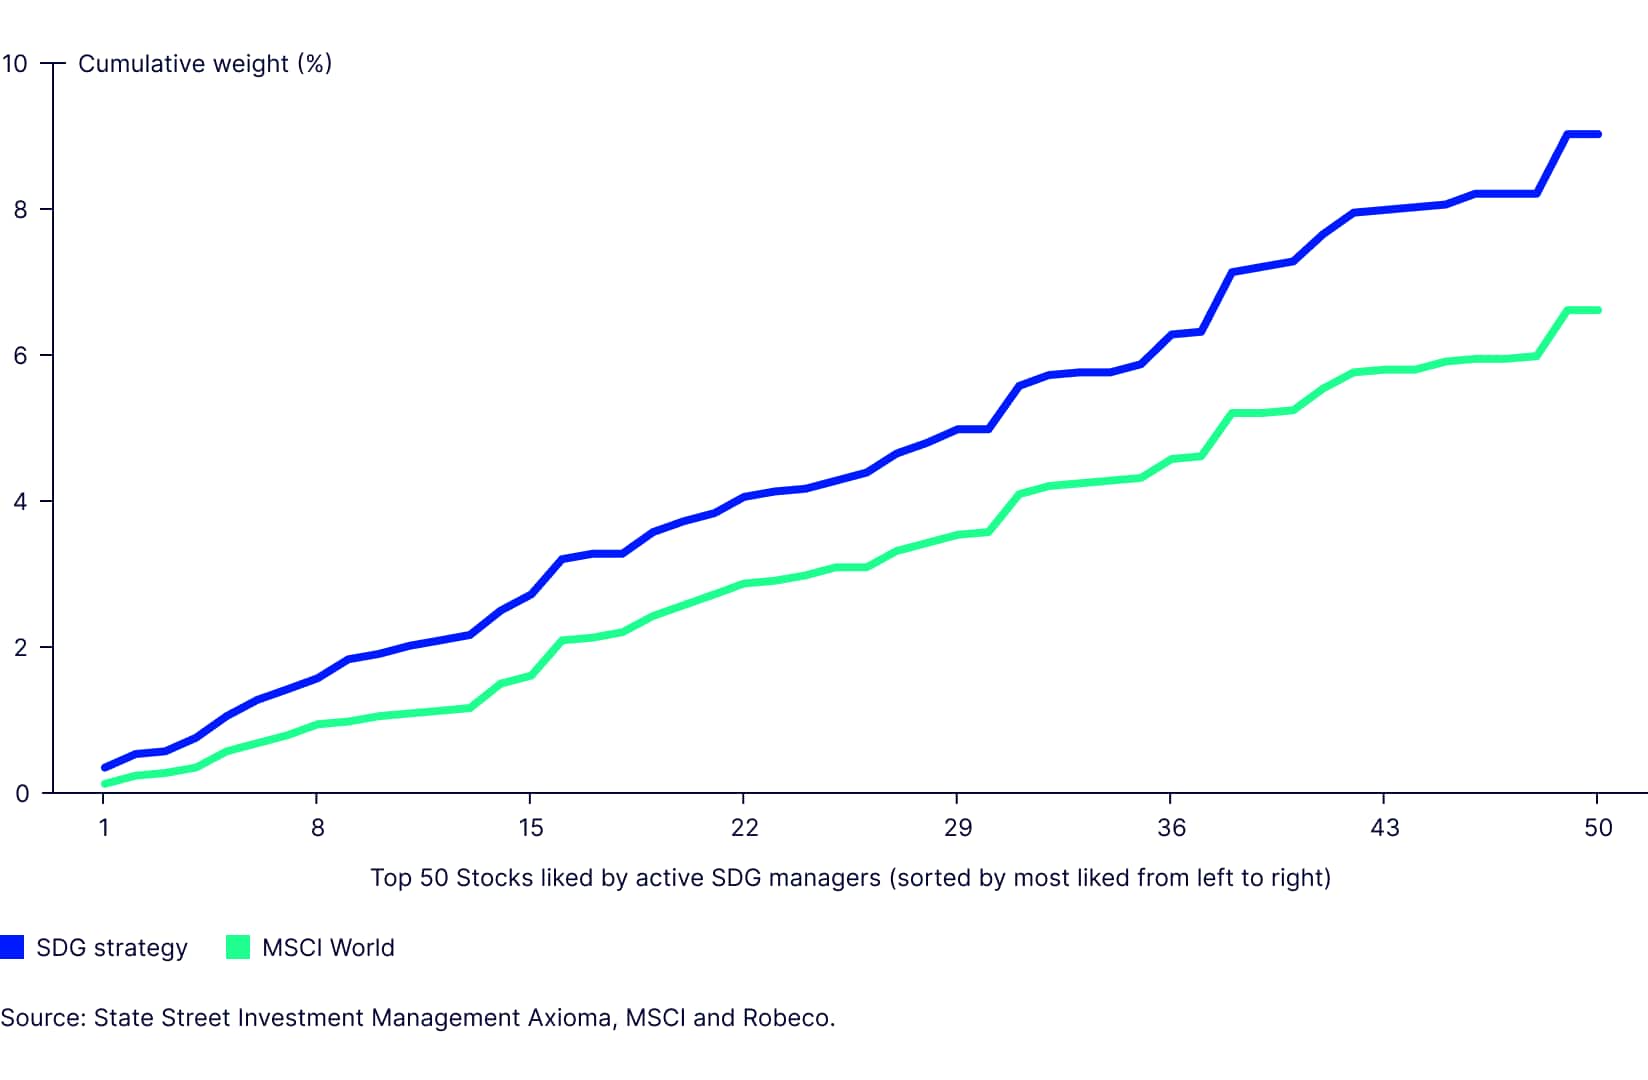
Based on the results of our study, we find evidence to suggest robust systematic SDG portfolios can be built in alignment with actively managed SDG portfolios and regulatory standards (specifically the EU taxonomy and PAB exclusions). We also find evidence to suggest alignment with open-source data from Robeco.
The bottom line
In conclusion, we have discussed the adoption of SDG strategies by investors, reflecting a significant shift toward aligning investment practices with the SDGs. This trend is supported by a growing body of research that explores various aspects of SDG integration into investment strategies. Our research builds on these foundations by evaluating the robustness of system¬atic equity portfolios constructed using SDG data. We believe this is a natural evolution from the work of van Zanten (2025), which assessed the suitability of SDG scores in meeting investor requirements. We find that it may be possible to construct risk-controlled SDG portfolios with meaningfully different SDG profiles. These portfolios could show improve¬ments in SDG alignment while limiting active risks and incentivizing stocks to be compared with those that are best in class.
To validate the robustness of these portfolios, we conducted several tests. Firstly, we compared the SDG portfolios with an aggregate actively managed SDG portfolio (see full piece for methodology), finding a strong alignment in stock selection preferences. Secondly, we assessed the portfolios against regulatory guidelines also defined in the full piece, specifically the EU taxonomy and PAB exclusions, to help ensure their compliance with strin¬gent sustainability criteria set forth by the PAB and under the taxonomy. Lastly, we validated the portfolios using open-source SDG data from Robeco, further reinforcing their alignment with recognized sustain¬ability metrics.
Overall, this article provides evidence that robust systematic SDG portfolios can be constructed in alignment with some actively managed SDG portfolios, regulatory standards, and open-source SDG data.