How gold hedges policy uncertainty when Fed leadership changes


When Jerome Powell’s term as Federal Reserve (Fed) chair ends in May, his successor will take the wheel of an economy in late-cycle expansion with limited policy flexibility. The US debt burden is elevated, and policymakers are operating in a credibility-sensitive environment.
While this leadership shift echoes prior transitions, the margin for error appears tighter this time. In 2026, unlike recent analogs, a new Fed chair will inherit a US economy facing a lingering inflation impulse, high wealth inequality, uncertain AI-driven labor dynamics, and ballooning fiscal deficits.
In such a setting, a change in Fed leadership has the potential to become another important tailwind for gold.
How policy uncertainty during Fed transitions impacts gold
When Fed leadership changes, investors typically spend the following six to 18 months reassessing the Fed’s tolerance for inflation, its growth tradeoffs, and its approach to financial stability risks. With the Trump administration signaling a preference for a more dovish Fed (and lower interest rates),1 policy uncertainty could impact yields and elevate demand for monetary hedges.
In fact, potentially looser financial conditions and uncertainty around the long term path of monetary policy could help extend gold’s move beyond the US$4,500/oz - US$5,000 range level.
Recent Fed leadership changes have occurred in late cycle or post stress periods
The previous five Fed leadership transitions (1979-2018) occurred in late-cycle or post-stress environments. This pattern is especially evident during the three most recent leadership changes—arguably the most relevant in the era of gold and commodities financialization:
- Ben Bernanke (Feb 2006) followed Alan Greenspan at the end of a long expansion and shortly before the Global Financial Crisis
- Janet Yellen (Feb 2014) assumed leadership in the aftermath of quantitative easing and balance sheet repair
- Jerome Powell (Feb 2018) took over as balance sheet normalization was beginning2
- In each case, the incoming chair had to deal with some combination of elevated private or public debt, financial vulnerabilities, and late-cycle dynamics.
Gold posts strong performance with new Fed chairs
Looking back to 1979, gold performed well in the six to 24 months following the appointment of a new Fed chair (Figure 1).
Notably, the 1979 transition to Chair Volker meaningfully boosts the average return profile, but it’s relevant to include given the current gold bull cycle where 2025 returns nearly matched those of 1979. Ex-Volker, the average return is more muted through the first 18 months with stronger gains around the 24-month mark.3
We think this reflects the natural lag between a leadership change and the macro effects that follow, as markets slowly adjust expectations for growth, easing cycles, and real yields. Gold doesn’t need policy shocks to perform; it usually needs time, uncertainty, and real rate compression. And the four most recent Fed chairs delivered on those factors to varying degrees.4
With another leadership change in store this spring, gold’s historical pattern suggests it can serve as a strategic hedge during policy handoffs—especially if investors question the independence of the Fed.
Diverging Fed views reinforce policy uncertainty
The distribution of Fed views is currently wider than usual, with the base case suggesting that further easing is conditional on data regarding its dual mandate. The hawkish/pause camp of Williams, Hammack, Goolsbee, Bostic, and Schmid emphasizes inflation persistence and possible technical distortions in employment data, while Waller and dissident Miran argue that monetary policy is still restrictive and that underlying inflation is likely closer to target than headline measures imply.5
Regardless of the divide, gold historically has appreciated during policy pauses and rallied once monetary easing cycles conclude.
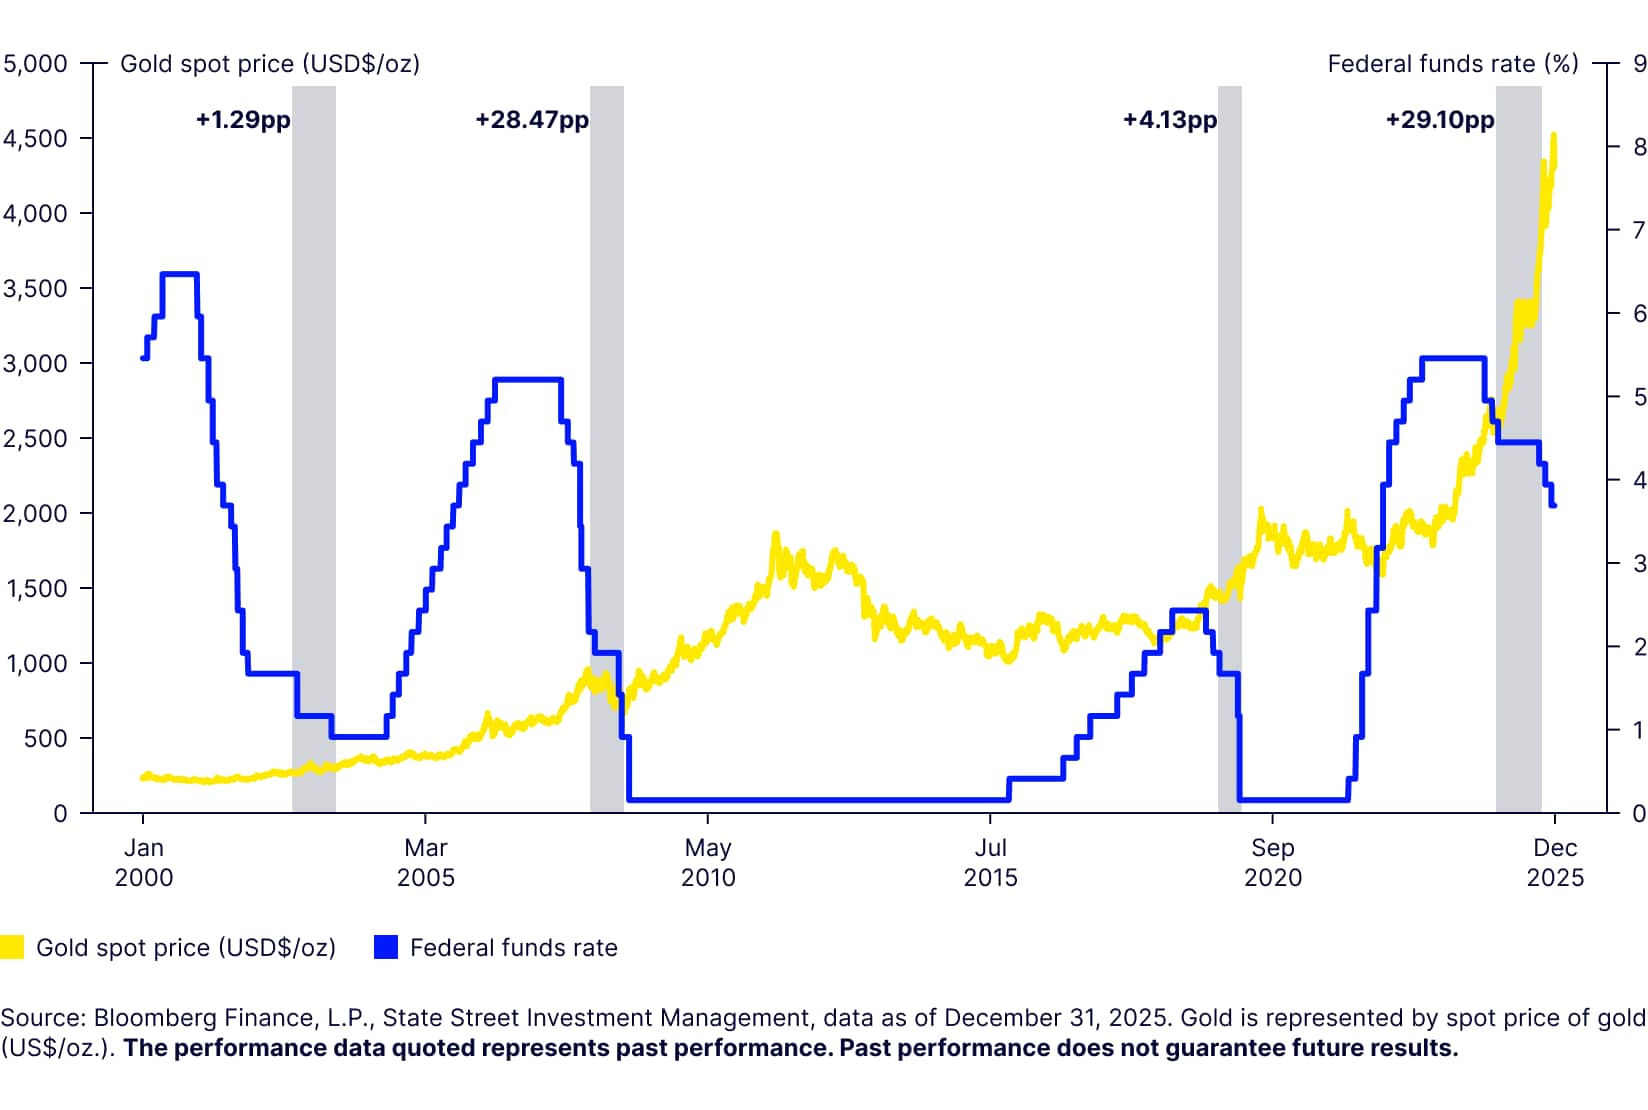
During the Fed’s nine-month policy pause in 2025, gold returned ~43% as markets priced in the next leg of policy easing.6 In fact, across the past three business cycles—spanning four extended Fed pause windows since 2002—gold has outperformed the S&P 500 by ~16 percentage points (pp) on average (Figure 2).
Figure 2: During Fed pauses (shaded), gold outperforms equities (excess return vs S&P 500 in percentage points)
With market participants expecting a Fed pause to start the year and cuts in 2H,7 gold could see additional tailwinds as monetary conditions loosen.
But the more interesting question is: what typically happens to gold after the easing cycle has run its course?
Gold’s performance tends to strengthen after the final rate cut
Across four easing cycles since 2000, gold’s forward returns from the final rate cut averaged 18% after six months, 20% after 12 months, 30% after 18 months, and 41% after 24 months.8 Excess returns versus the S&P 500 were 10pp, 2pp, 2pp, and 10pp across the same horizons.9
Outcomes were uniformly positive, with 16 of 16 observations positive and 15 of 16 posting double-digit returns (Figure 3). Although gold is coming off its strongest year since 1979,10 history suggests that there may be more upside to this bull market.
Figure 3: Gold shows encouraging returns 6-24 months after Fed easing ends
Final cut date | +6m | +12m | +18m | +24m |
|---|---|---|---|---|
12/11/2001 | 18% | 19% | 30% | 48% |
6/25/2003 | 19% | 16% | 27% | 27% |
12/16/2008 | 9% | 33% | 43% | 60% |
3/14/2020 | 28% | 13% | 18% | 28% |
Source: Bloomberg Finance, L.P., State Street Investment Management, data as of December 31, 2025. Gold is represented by spot price of gold (US$/oz.). The performance data quoted represents past performance. Past performance does not guarantee future results.
Anticipated cuts and a softer US dollar support gold’s strategic role
Gold has recently outperformed following changes in Fed leadership—periods where uncertainty remains elevated and markets begin pricing in the next phase of the cycle. Prior Fed chair transitions have often coincided with slowing growth, declining real yields, and shifting US dollar dynamics11—conditions that have historically supported gold returns over subsequent quarters.
In 2025, gold rallied during the Fed’s policy pause because markets focused less on the prevailing rate level and more on expectations for future policy easing. If expectations for policy easing expectations remain intact in 2026, despite the likely pause in 1H, the opportunity cost of holding gold could decline, even without immediate rate cuts. That backdrop would be consistent with a higher gold price range of US$4,500-5,000/oz.
Gold’s hedging value rises when policy is reassessed
From a portfolio construction perspective, periods of reassessment of monetary policy credibility and direction have historically supported demand for gold as a hedge against macro and institutional risks. While credibility challenges traditionally have been more pronounced in emerging markets, today’s geoeconomic and political environment suggests these risks may increasingly extend into developed markets. Renewed concerns about Fed independence could reinforce this backdrop.12
A Fed transition in 2026 is more likely than not to serve as an additional tailwind for the yellow metal. A further softening of the labor market that accelerates the need for rate cuts—or markets pricing in a deeper bull steepening of the US Treasury curve—could amplify the bullish impulse for gold.
Get more insights from our Gold Strategy Team.