The Case for Active Investing in Equities
In this piece, we outline the environments that have been most and least fruitful historically for systematic and fundamental active equity strategies.
With interest rates elevated from QE-driven lows, investors now have less of a hankering to step down in quality in search of higher yields — a familiar post-crisis playbook that was further encouraged by low equity market volatility. Now, investors are required to be more aware of volatility, more discerning of company fundamentals, and more conscious of attractive opportunities outside of equities. As a result, we think it could be time for the pendulum to swing towards active equity management and the thoughtful process of stock selection.
Which Environments Are More Favorable for Active Strategies?
Our analysis shows that systematic and fundamental active equity funds have both historically outperformed index funds, on average, in many different market environments. This excess performance is not always enough to generate positive absolute performance. However, there were consistent patterns across developed market (DM) and emerging market (EM) indices.
We analyzed the following economic environments:
- Recessionary Periods
- More Volatile Periods
- A New Proprietary Approach Based on Growth and Inflationary Signals
- The State Street Global Advisors’ Proprietary Market Regime Indicator
- Dispersion
We evaluated active fund performance across a wide range of regimes, including a proprietary approach in which we partiion regimes based on the rates of change in both growth and inflation. For more details on this approach, see: Zooming Out: A Comprehensive Approach to Defining Economic Cycles.
Recessionary Periods
A starting point is to look at fund performance during official periods of recession. Focusing on funds benchmarked against the MSCI World Index (DM or EM) would require looking at global recessions; however, these are hard to identify and date. In this paper we’ve taken the approach of using US recessions as defined by the National Bureau of Economic Research, noting that while not every US recession has necessarily coincided with a global recession, every global recession has coincided with a US recession since the 1950s.1
Notably, we analyze performance of the active funds using both beta-adjusted (EBA) and beta-unadjusted results. For equity beta adjustment, we used one value of equity beta calculated over the entire data range. We adjusted the equity betas for the individual fund returns and then averaged their excess returns across all funds tracking a particular index. See Figure 1.
Figure 1: Index Performance During US Recessionary Periods
| Period | Global Recession | MSCI World Index Benchmark | SEA | AF | MSCI Emerging Markets Index Benchmark | SEA | AF | ||||
| ExRet | ExRet EBA | ExRet | ExRet EBA | ExRet | ExRet EBA | ExRet | ExRet EBA | ||||
| Jan 1970 to Nov 1970 | -6.05 | _ | _ | _ | _ | _ | _ | _ | _ | _ | |
| Dec 1973 to Mar 1975 | Yes | -1.89 | _ | _ | _ | _ | _ | _ | _ | _ | _ |
| Feb 1980 to Jul 1980 | 20.48 | _ | _ | 6.30 | 14.18 | _ | _ | _ | _ | _ | |
| Aug 1981 to Nov 1982 | Yes | 5.22 | _ | _ | 13.43 | 14.47 | _ | _ | _ | _ | _ |
| Aug 1990 to Mar 1991 | Yes | -0.01 | 1.62 | 1.62 | -1.07 | -1.07 | -2.06 | _ | _ | -14.63 | -14.77 |
| Apr 2001 to Nov 2001 | -5.81 | 4.78 | 4.50 | 5.84 | 5.45 | -3.04 | 1.25 | 1.20 | 4.59 | 4.46 | |
| Jan 2008 to Jun 2009 | Yes | -23.07 | 1.45 | -0.21 | 4.01 | 3.37 | -19.16 | 1.74 | 1.52 | 1.88 | 1.03 |
| Mar 2020 to Apr 2020 | Yes | -12.37 | -2.83 | -3.39 | 1.82 | 1.31 | -31.47 | -1.50 | -3.54 | -7.12 | -8.02 |
| Average | -5.12 | 1.98 | 1.05 | 6.22 | 7.00 | -12.92 | 1.36 | 1.06 | -1.95 | -2.48 | |
| Average Across Recessions Since the 1990s | -14.04 | ||||||||||
Sources: eVestment, FactSet, NBER, World Bank, State Street Global Advisors calculations. All returns are gross.
The row labelled “Average” gives the annualized average of monthly returns over all recessions.
SEA: Systematic equity — active. This includes systematic funds in eVestment with gross returns and benchmarks MSCI World and MSCI EM. AF: Active fundamental.
ExRet EBA: Equity beta-adjusted excess returns = Fund return — beta * benchmark return.
ExRet: Unadjusted excess returns = Fund return — benchmark return.
For the time frame over which eVestment has fund performance data and FactSet has index performance data:
• There have been only four US recessions for DM systematic active funds.
• DM active fundamental funds have a longer history, so there are six recessions.
• For EM systematic active funds there are only three recessions.
• EM fundamental funds have experienced four recessions.
For funds with the same benchmark, we examined the annualized return of a simple average of monthly gross excess returns.2 For comparison purposes, we also show the annualized return of the average monthly gross returns of the respective benchmarks during periods of recession.
With the caveat of a very small sample size with respect to the number of official recessions, the results in Figure 1 show:
- Recessions do not always cause underperformance of actively managed funds …
When looking at the individual recessions, neither US-only recessions nor global recessions have always coincided with underperformance for DM and EM systematic active and fundamental active funds. However, the most recent recession did see underperformance of all fund types except DM active fundamental funds. This is perhaps a nod to the unprecedented nature of the global pandemic.
- … But benchmark returns are more consistently negative during recessionary periods.
Benchmark returns are negative during most of the recessionary periods (all for EM), and on average the MSCI Emerging Markets Index fared worse at a roughly -13% return vs. the MSCI World Index returning roughly -5%.
However, if we consider only the recessions from 1990 and later — i.e., over the same timeframe as we have data for the MSCI Emerging Markets Index — then the average annualized return for the MSCI World Index falls to about -14%, slightly worse than the MSCI Emerging Markets Index.
- Active funds outperformed the benchmark across the board during US-only recessions.
We emphasize there is only one US-only recession for which we have data on all four fund types. During this one period, all four active fund types outperformed, and fundamental funds’ outperformance exceeded systematic funds’ outperformance.
- Equity beta is less than one for both systematic active and fundamental active funds.
The underperformance is more severe for equity beta-adjusted excess returns (ExRet EBA) than for unadjusted excess returns (ExRet) when the index sells off. By contrast, when the index rallies, the outperformance is greater for ExRet EBA. This suggests that equity beta is less than one for all four fund types, meaning that the active funds will usually have less volatility than the market.
Notes on the Current Envrionment
We expect 2024 to be a time of “positioning the pieces,” as we weigh multiple factors within the macroeconomic environment to assess how they converge in order to refine our outlook and portfolio views. We see fixed income as a bright spot for investors in 2024 given current yield levels, slowing growth, and continued disinflation. Amid heightened volatility and global fragility, we remain cautious on risk assets and favor high quality stocks in equity markets. For more, please see our 2024 Global Market Outlook.
Heightened Volatility Periods
Next, we investigate the effect of the implied volatility of stock markets alone on the performance of active funds. We use the Volatility Index (VIX) as a proxy for volatility. Results are shown in Figures 2 through 5.
The results show:
- In terms of excess returns, the 20–30 VIX range is the sweet spot for DM active fundamental and EM systematic active funds. For DM active fundamental funds and EM systematic active funds, performance is significantly better in the 20–30 VIX range for both measures of excess return.
- For EM active fundamental and DM systematic active, results vary modestly based on equity beta adjustment. In both EM active fundamental and DM systematic active, the best performance is in the 20–30 VIX range; however, this changes to the 0–20 VIX range on a beta-adjusted basis.
- DM fundamental funds seem to outperform DM systematic active funds on an absolute excess return basis in all VIX ranges. However, on an equity beta-adjusted basis, systematic active outperformed fundamental active world funds in the 0–20 VIX bucket.
- A VIX range greater than 30 is particularly bad for investors. Across both benchmark indices (Figures 3 and 5), there is a trend of falling returns over higher VIX ranges. Historical data shows negative returns on the index as well as underperformance by systematic active fund managers in the +30 VIX range. Fundamental managers have, on average, delivered positive excess performance in this bucket; however, on a total return basis, that outperformance is overshadowed by the fact that returns are negative for the indices and funds across the board.
Notes on the Current Environment
The VIX remains low historically. Given the plethora of geopolitical risks that exist in 2024, from the potential for territorial conflict to geopolitically sensitive elections, we do not see the VIX remaining at these subdued levels (Figure 6).
Beyond Traditional Economic Cycles
Given that there are few official periods of recession, we also consider an alternative approach to economic regimes. To do that, we partition the economic climate into four regimes, based on the rates of change in both growth and inflation (Figure 7). For more details on the construction of these regimes, see Zooming Out: A Comprehensive Approach to Defining Economic Cycles.
Figure 7: Four Quadrants Define Alternative Economic Regimes
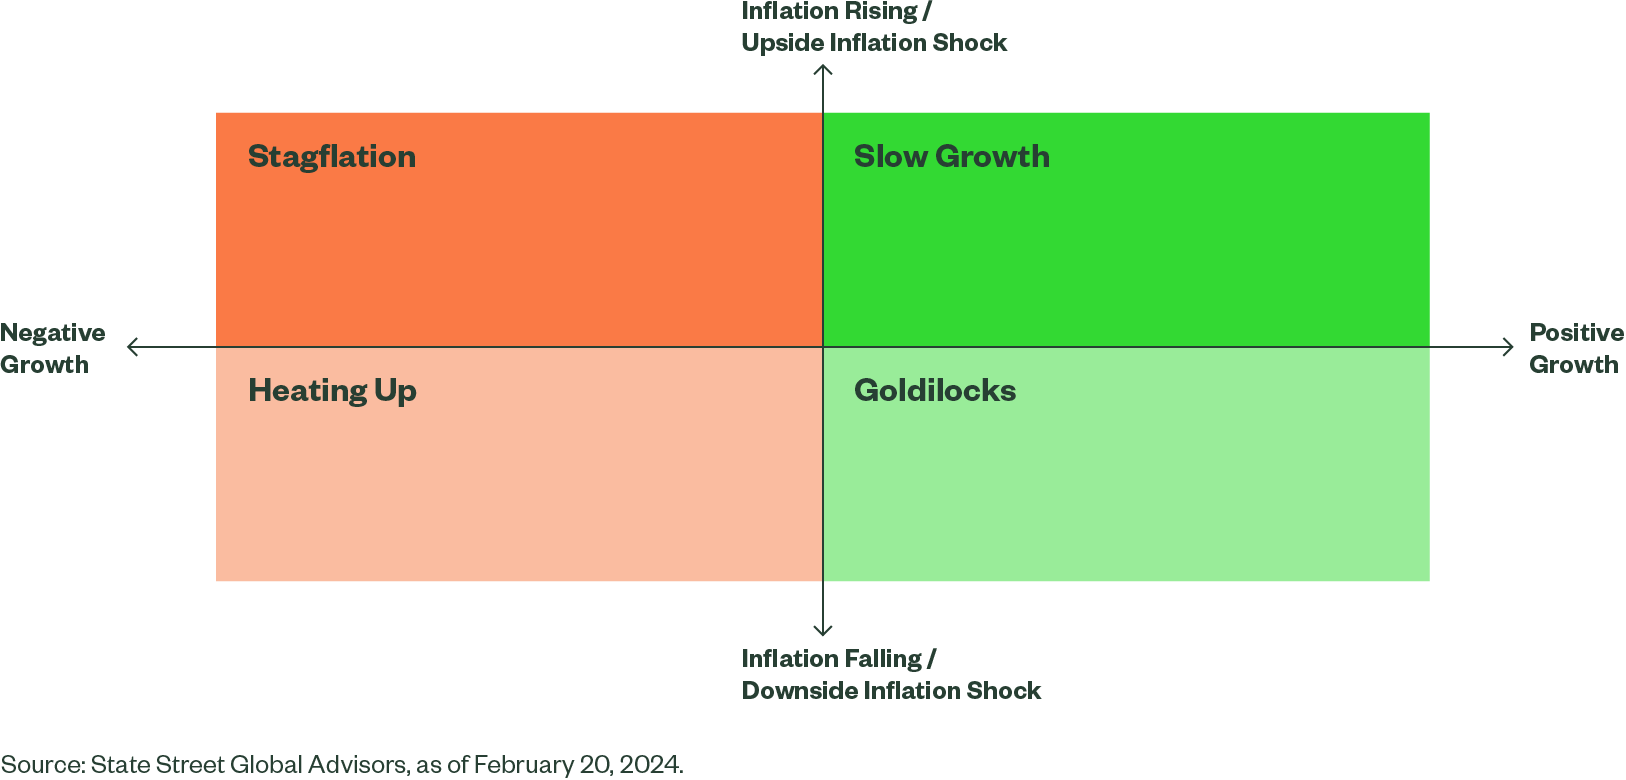
Figure 8 shows the performance of the MSCI World Index and MSCI Emerging Markets Index during each of the four regimes shown in Figure 7.
We also calculated excess returns for active funds for each period in Figure 7. Similar to our analysis of recessionary periods and high-volatility periods, we have calculated returns for active funds both with and without equity beta adjustment (Figures 9 and 10).
The results show:
- Both types of DM active funds have positive excess return in all regimes, with the best performance in the Goldilocks environment.
Once we adjust for equity beta, funds outperform on average in both the Goldilocks and Heating Up regimes (i.e., the accelerating growth regimes). - Similarly, all EM active funds have positive excess returns across the board except in one instance.
The only negative excess return is on a beta-adjusted basis for active fundamental funds. - In DM, active fundamental funds outperformed systematic active across all four economic regimes; this is generally reversed for MSCI Emerging Markets Index-benchmarked funds.
In EM, only in the Heating Up regime do active fundamental EM funds outperform systematic active funds. On a beta-adjusted basis, the EM systematic active fund excess returns do not vary as much across regimes as those of the other three fund types.
- Stagflation is particularly concerning for DM fund investors, while Slow Growth may raise alarm bells for EM investors.
This is because investors tend to care about absolute returns. Even though active funds outperform during these periods, the excess returns on average do not make up for the negative moves in the benchmark indices.

Find Out More by Downloading the Full Research Report
We also analyzed active performance in regimes based on our proprietary Market Regime Indicator, and based on periods of higher or lower dispersion. We also give more details on the drivers of our analysis and conclusions.