Quantifying Supply Chain ESG Risks: A Flexible Framework
- Our approach to calculating greenhouse gas (GHG) emissions in supply chains is manageable to implement and can be expanded to apply to almost any other ESG-related risk.
- Conceptually it is very similar to the upstream Scope 3 carbon emissions as defined by the GHG Protocol, but our framework requires much less data and uses a simpler process.1
- The essence of the framework is built upon the well-known input-output model, but we apply it at a company level.
In this article, we introduce a simple and intuitive approach to calculating the emissions resulting from a company’s base of suppliers. Importantly, our framework can be generalised to evaluate other types of ESG risks embedded in a firm’s value chain.

Learn More About a Flexible Framework for Companies to Quantify Scope 3 Emissions
Companies have a way to go. In 2021, only 18% of Fortune 500 companies had targets on Scope 3 emissions, and globally, companies have voiced concern about the burdensome implementation costs of reporting.2
By capturing all of the carbon emissions related to, but not directly associated with, a company’s business activities, Scope 3 metrics can paint a more comprehensive picture of a firm’s ESG profile and can ensure that companies do not hide “dirty activities” along their supply chains. 1 Scope 3 emissions can be significant; per a Citi report, companies such as food manufacturers or fertiliser producers could generate 90% of their total emissions from Scope 3 emissions.3 And according to a McKinsey report, two-thirds of Scope 3 emissions are usually from the upstream supply chain.4 As a consequence of these trends, investors are requesting more supply chain emissions disclosures and a swath of regulations are requiring them.
A Hypothetical Supply Chain Carbon Emissions Calculation
Suppose our task is to estimate the total carbon emissions required to produce a company’s final product. As an example, for Apple Inc.’s production of an iPhone, this encapsulates all emissions occurring as the phone makes its journey to a customer’s door, including fuel extraction from the ground (or other sources of energy) to provide electricity, aluminum mined for raw materials or recycled from scrap, parts assembly overseas, final product transport to distributors, and other elements of the phone’s production. Given the complexity of the value chain ecosystem, estimating Scope 3 carbon emissions in total is a difficult ask in this case and most others. However, if we home in on one supplier at a time, the goal becomes more attainable.
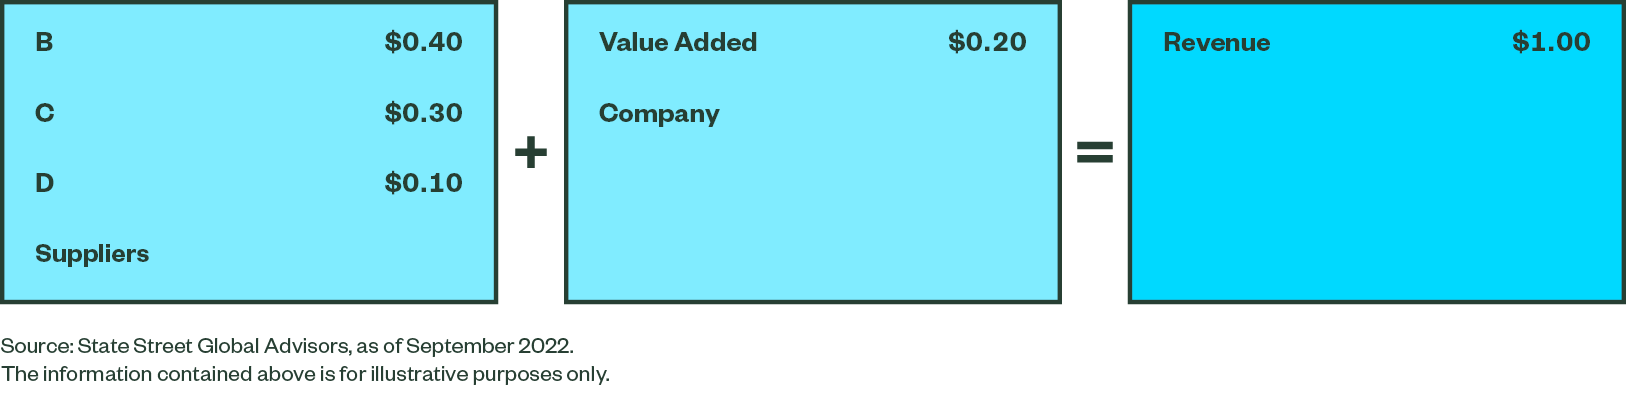
In a hypothetical example (Figure 1), Company A has three direct suppliers (B, C, and D), which account for $0.40, $0.30, and $0.10 of the cost of goods sold (COGS) for every $1.00 of revenue of the company, respectively.
Figure 1: Calculating COGS and Value Add for Each Supplier
We translate the equation in Figure 1 to apply specifically to carbon emissions. If the total upstream carbon intensity (or TUCI) of Supplier B is TUCI_B, the amount of its carbon emissions that should be allocated to Company A is TUCI_B times the COGS from Supplier B, i.e., TUCI_B x 0.40. Similarly, we can determine the emissions coming from other suppliers. To calculate total emissions from Company A, we add the emissions from all the suppliers to the company’s direct carbon emission (DCI), which is direct carbon intensity times revenue, or DCI x $1.00 (Figures 2 and 3).
Figure 2: Aggregating TUCI from Company A Suppliers
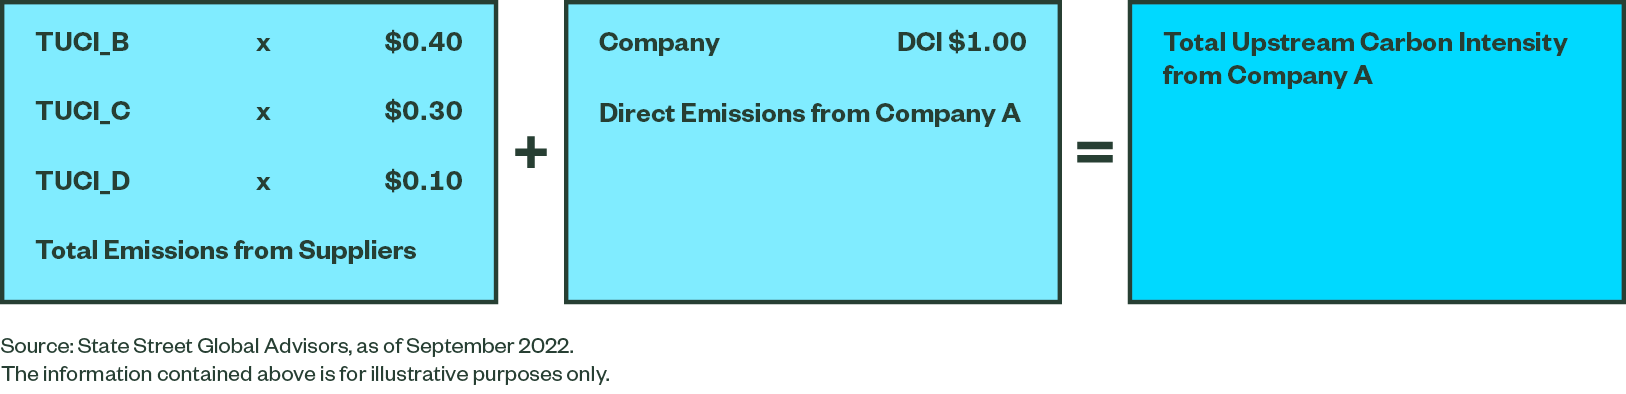
Figure 3: Company A's TUCI in Matrix Terms
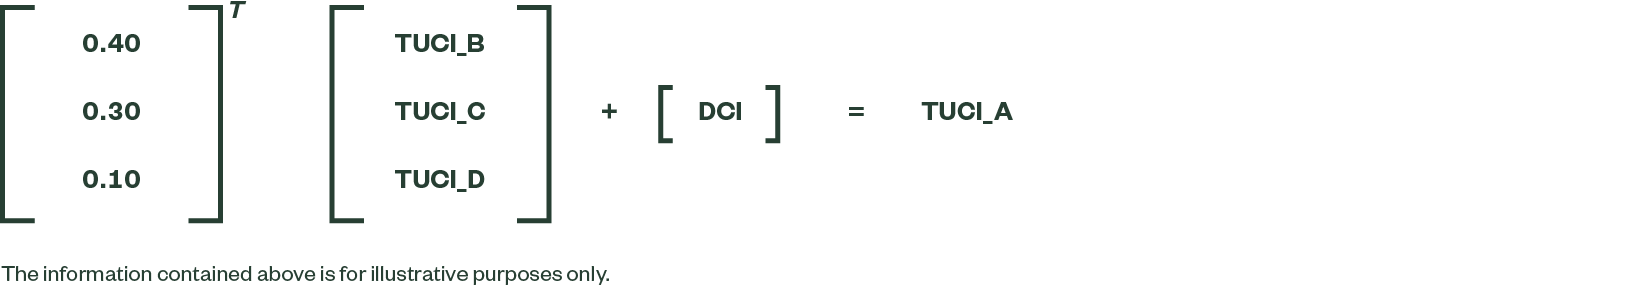
If we summarise the input-output relationship between any company and its suppliers in our universe by a matrix “M,” the above equation can be written in matrix terms as shown in Figure 4. In the formula in Figure 4, TUCI and DCI are the vectors of upstream carbon intensity and direct carbon intensity, respectively. Figure 3 above represents one row in this equation corresponding to Company A.
Figure 4: Company A's TUCI as a Formula

The equation in Figure 5 resembles the Leontief inverse matrix. Some literature has used the Leontief model to estimate upstream carbon emissions at the country or sector level. What differentiates our framework from these studies is that we estimate emissions at the company level, which significantly strengthens our capabilities of measuring, monitoring and influencing climate change risks in the corporate world.
Figure 5: General Formula for Quantifying Supplier Emissions
