Small-cap Equities: Crafted for a Soft Landing
As a soft landing unfolds, investors can consider small-cap strategies that trade at relatively inexpensive multiples. But no two exposures are the same.
The combination of moderating inflation, resilient labour markets, and in some regions better-than-expected growth is likely to lead to a broadening of market performance. As the soft landing is unfolding, investors may consider small-cap strategies that trade at relatively inexpensive multiples and offer catch-up potential.
However, no two small-cap exposures are the same and while there are some commonalities, including more domestic and cyclical profiles, there is a variety of well diversified indices available allowing investment in single or multiple regions. As such, each strategy may be driven by specific factors.
US Small and Mid Caps: Goldilocks Macroeconomics Scenario Unfolding
Both US small and mid caps outperformed large caps in the last two months of 2023 as inflation abated, but then again fell behind in the beginning of 2024 as a stronger-than-expected labour market and GDP growth likely postponed a first rate cut.
In this stage of the cycle, inflation prints will dictate small-cap performance and, in our view, investors should consider US small and mid caps as disinflation should continue over the next few months, partially on the back of base effects and productivity gains. This should allow the Federal Reserve (Fed) to start policy easing. In the long run, it is less important that the first cut occurs in either May or June, but rather that once the policy easing starts, it is likely to continue.
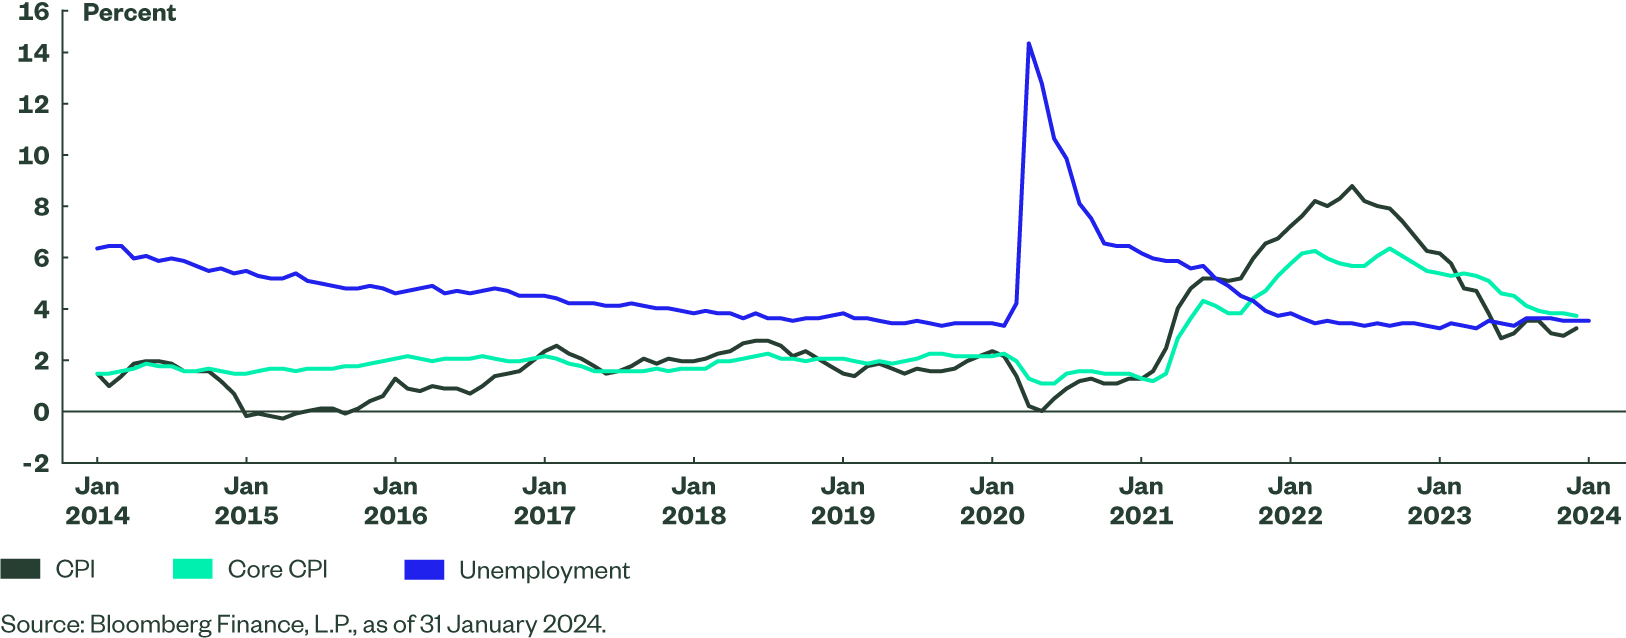
The strength of the labour market and US economic activity, in the short term, often lead to additional volatility as they impact the path of rates. But in our view, this resilience is fundamental for more domestic and cyclical small and mid caps to prosper in the long run. With unemployment at 3.7% in January, GDP growth at 3.3%, and core PCE at 2.0% in Q4,1 cyclical small and mid cap exposures become increasingly appealing. The key risk to US small and mid caps is in a demand-driven rebound of inflation, which could lead to rates staying higher for longer.
Figure 1: US Inflation and Unemployment
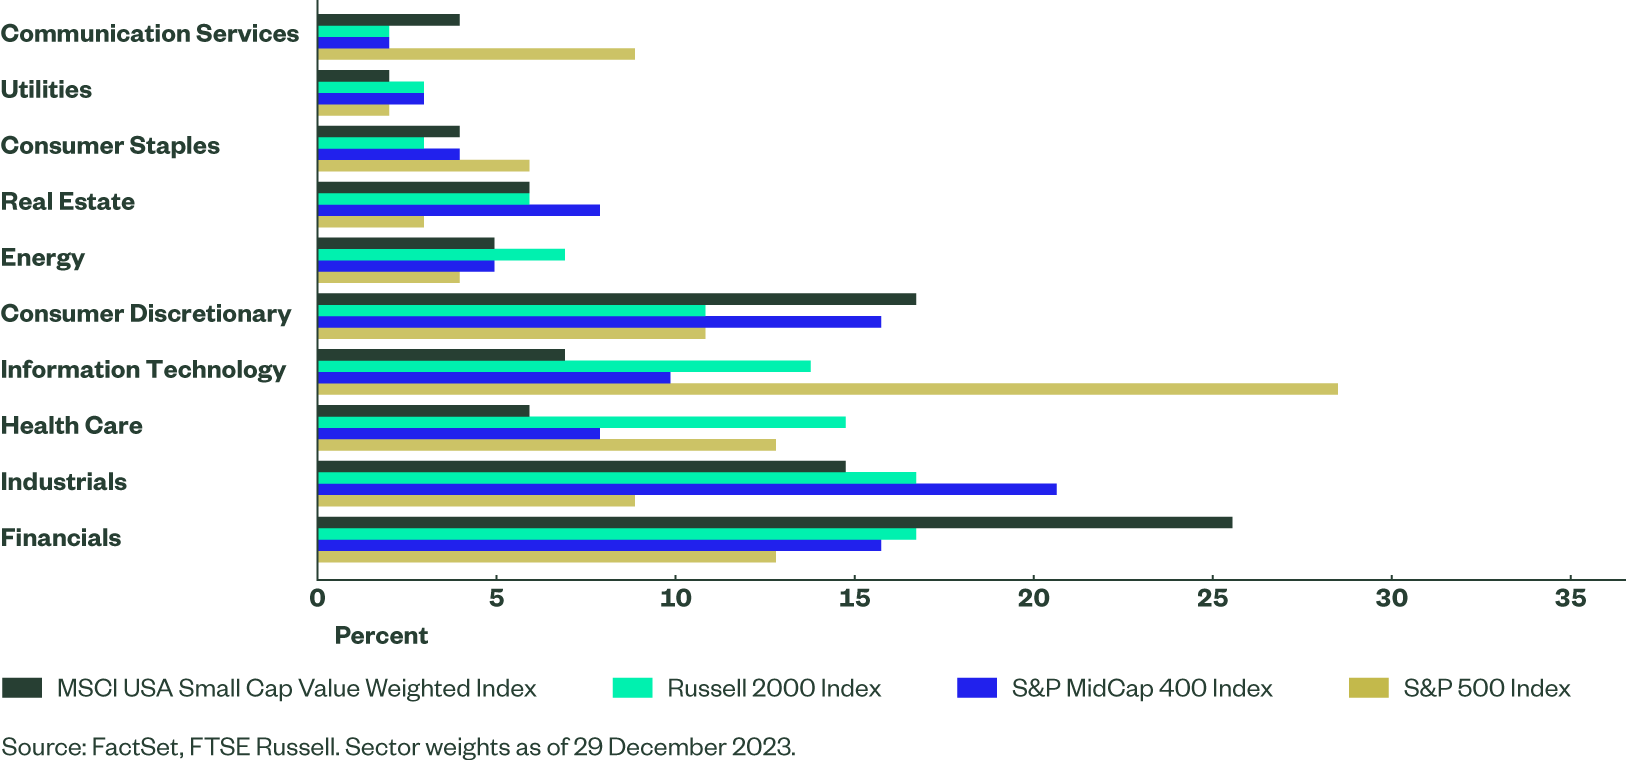
Small- and mid-cap indices generate between 77% and 81% of their revenue within the US, while the corresponding number for the S&P 500® Index is 59%.2 In our view, this makes the Russell 2000, MSCI USA Value Weighted and S&P MidCap 400 indices more direct tools to access US exceptionalism. But each strategy has a unique profile:
- The S&P MidCap 400 Index overweights more traditional companies — Industrials is the largest sector — which is appealing in the context of rebounding ISM readings. Longer term, public spending in the form of the Infrastructure Investment and Jobs Act, the CHIPS and Science Act, the Inflation Reduction Act, and broad reshoring efforts are likely to benefit more domestic and industrial-heavy mid and small caps.
- The Russell 2000 Index overweights biotech and software companies, which often are in the earlier stage of development. This means the index has, in our view, a higher risk-return profile.
- The MSCI USA Small Cap Value Weighted Index is skewed towards financials which represent more than a quarter of the index.
The common characteristics of the three indices is a cyclical sector split, which may be a desired feature as economic growth in the US continues to surprise to the upside.
Figure 2: US Small- and Large-cap Index Sector Breakdown
How to Access US Small and Mid Caps
European Small Caps: Valuations Are Inexpensive While Disinflation Continues
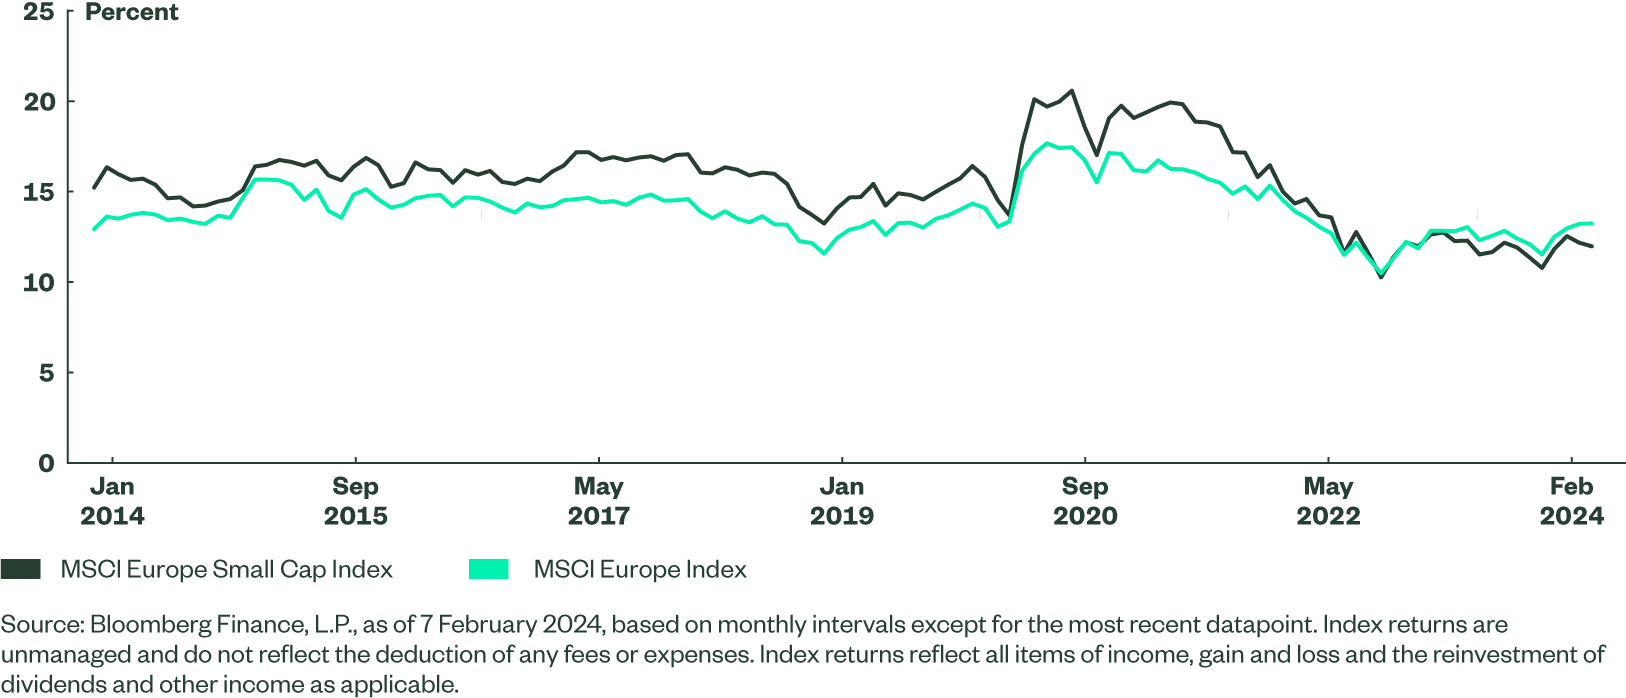
Small caps in Europe are trading at inexpensive multiples compared not only to large caps but also to their own history. The forward price-to-earnings (P/E) at 12.1x is in the lowest decile for the last 10 years. Over that period, on average, the MSCI Europe Small Cap Index traded at a 9% higher P/E multiple than the MSCI Europe Index. It currently trades at an 8% discount — one of the lowest levels in 10 years. These levels may provide an interesting entry point as inflation is moderating and rate cuts are on the horizon.
Figure 3: Price-to-earnings 1y Forward
European small caps, like their US cousins, are supported by moderating inflation and resilient labour markets. However, economies in Europe are in a different spot than the US given that growth is broadly flat, on the edge of a recession. As such, a more probable headwind for European small caps is a prolonged economic slowdown rather than an inflation rebound. With that in mind there are early signs of a potential improvement in European economic activity. PMIs in the Eurozone are still in contraction territory but may have bottomed out. German factory orders were up 8.9% in December while UK PMIs moved to expansion territory at 52.9 (albeit retail sales fell by 3.2% in December).3 If Europe has indeed already bottomed out, valuation levels of European small caps offer a very appealing entry point.
The MSCI Europe Small Cap and MSCI Europe Small Cap Value Weighted indices generate respectively 65% and 68% of their revenue within Europe, making them more domestic exposures compared to the MSCI Europe Index at 42%.4 From a regional standpoint, small-cap indices overweight the UK and Sweden while the most significant underweights are France and Switzerland.
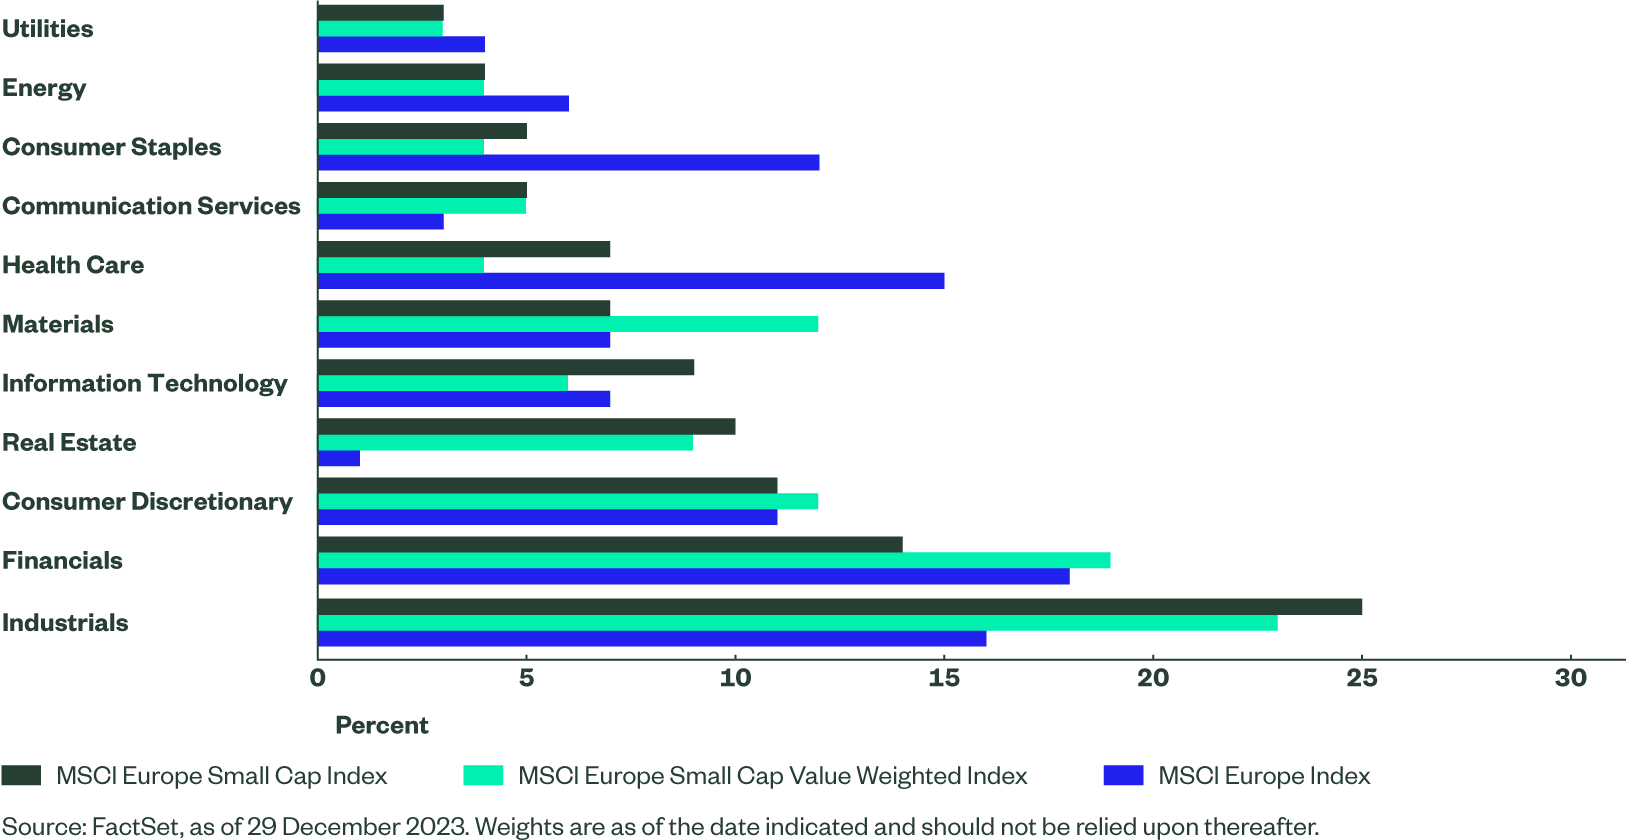
Perhaps the most important distinction lies in the sector composition, with Industrials representing nearly a quarter of small-cap exposures. The sector is supported by long-term tailwinds including green transition, energy security, and reshoring. Another important overweight is Real Estate, a battered sector which may enjoy a rebound as the battle against inflation is being won and central banks across Europe may be more keen to cut interest rates faster given relatively muted economic growth. The underweight towards Health Care and Consumer Staples makes European small caps a more risk-on exposure from the sector standpoint.
Figure 4: Sector Composition
How to Access European Small Caps
Global Developed Small Caps: Diversified Exposure With Undemanding Valuations
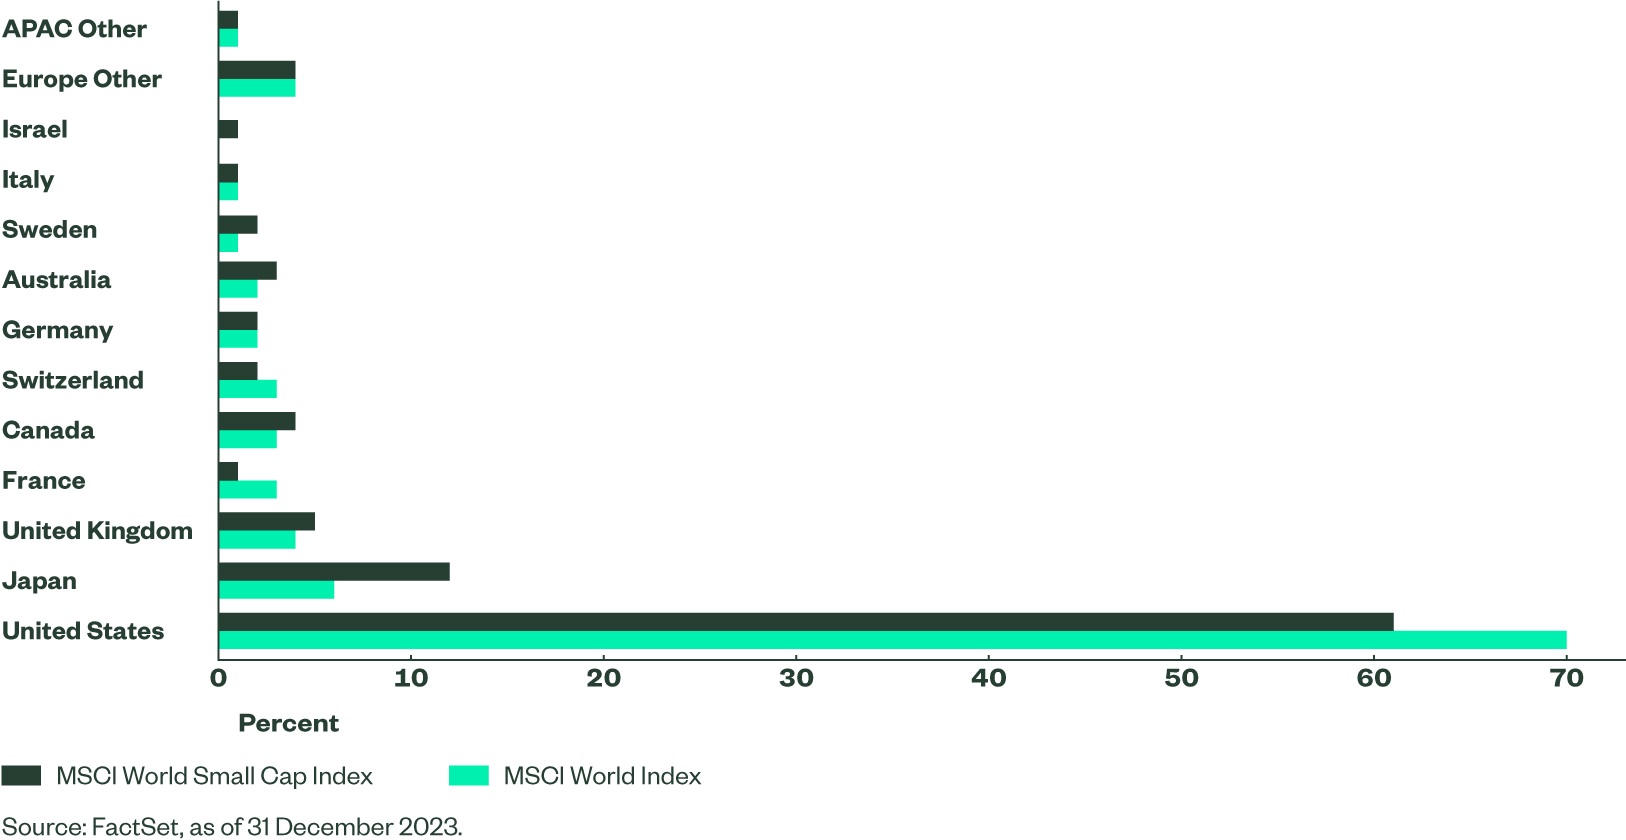
The MSCI World Small Cap Index combines US small caps (representing 60% of the exposure) and European small caps (accounting for 19%). This helps to balance risks and opportunities associated with each region. The third-highest weight is Japan, representing 12% of the index — at nearly double its weight in the MSCI World Index. This year, Japan may enjoy a “Goldilocks” scenario similar to the United States in 2023, with moderating inflation and strong wage growth driven by “Shunto” negotiations. And the Tokyo Stock Exchange reforms are expected to increase efficiency of listed companies.
Figure 5: Country Composition
For most regions in the index, the single most important common dynamic for global developed small caps is disinflation. As CPI prints across the world are coming down and economies are surprisingly resilient to tighter monetary conditions, the opportunity for a catch-up trade opens up. Despite a rally in Q4, valuations remain inexpensive, both on an absolute basis and in relation to the MSCI World Index. Finally, when it comes to potential broadening of performance, the MSCI World Small Cap Index is less concentrated than the MSCI World Index where the weight of the top 10 constituents is 1.68% versus 20.8%, respectively.5
Figure 6: Price-to-earnings 1y Forward
How to Access Global Developed Small Caps
Emerging Markets Small Caps: China Underweight Is the Key
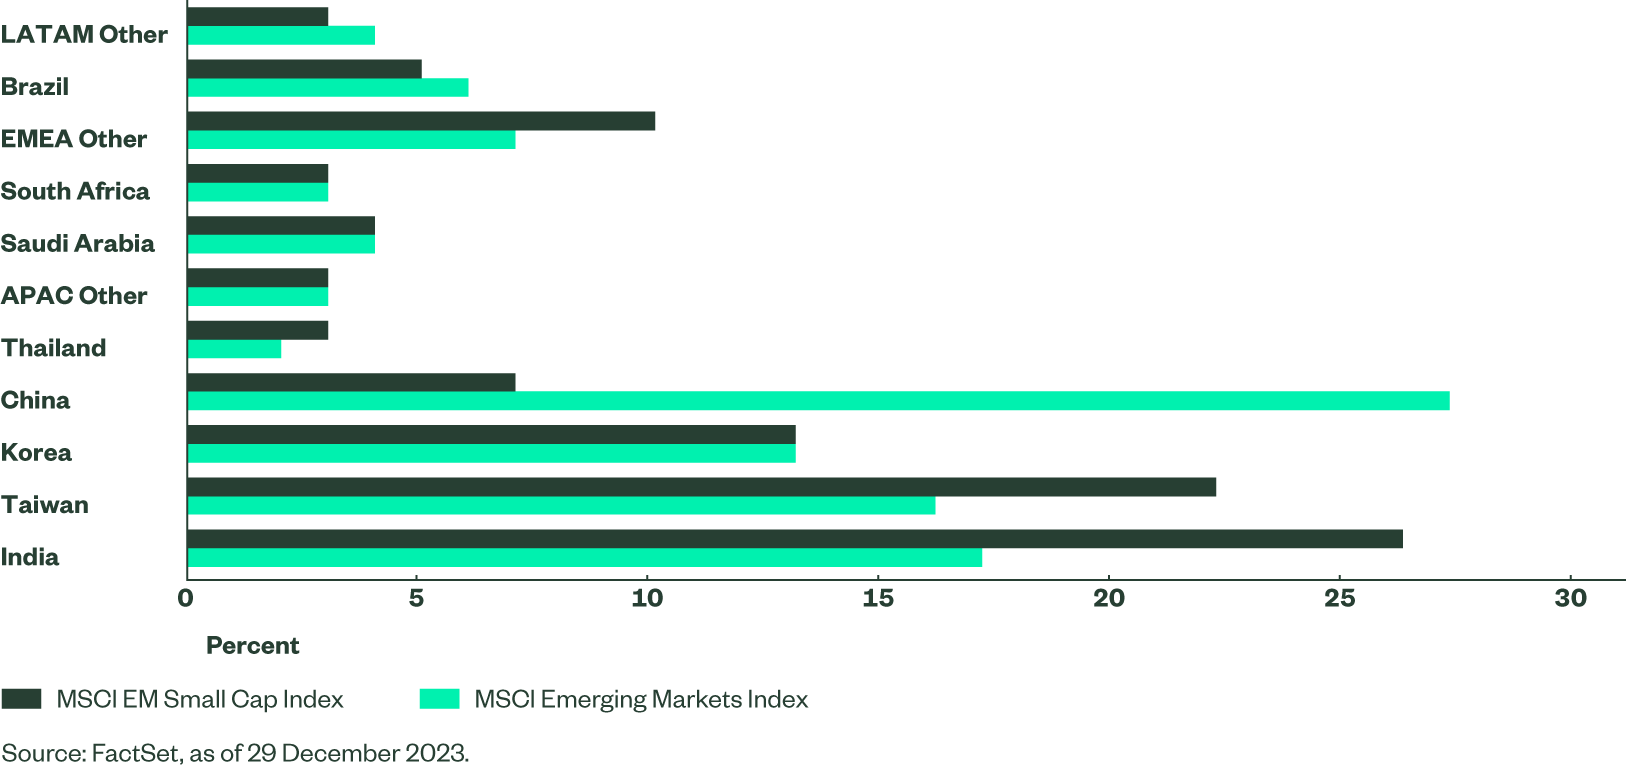
Emerging Market (EM) economies continue to outpace the developed world, yet EM equity returns have been poor, dragged down by Chinese stocks that face numerous challenges, including reemergence of the technology crackdown, geopolitical tensions, and slower-than-expected economic activity. The MSCI EM Small Cap Index offers a simple solution to those headwinds by being heavily underweight China, which accounts for only 7% (versus 27% for the MSCI EM Index – see Figure 7).
Instead, India represents 26% of the index and the country is expected to grow at a rate above 6% over the next two years.6 These factors make India an attractive place for foreign capital, which is expected to flow into the country over the medium term in various forms. The second most important overweight is Taiwan at 22% of the index. While geopolitical risks need to be monitored, Taiwan remains an indispensable part of the semiconductor supply chain. The third-highest overweight is South Korea, a powerhouse in technology offering access to a wealth of high quality companies.
Figure 7: Country Composition
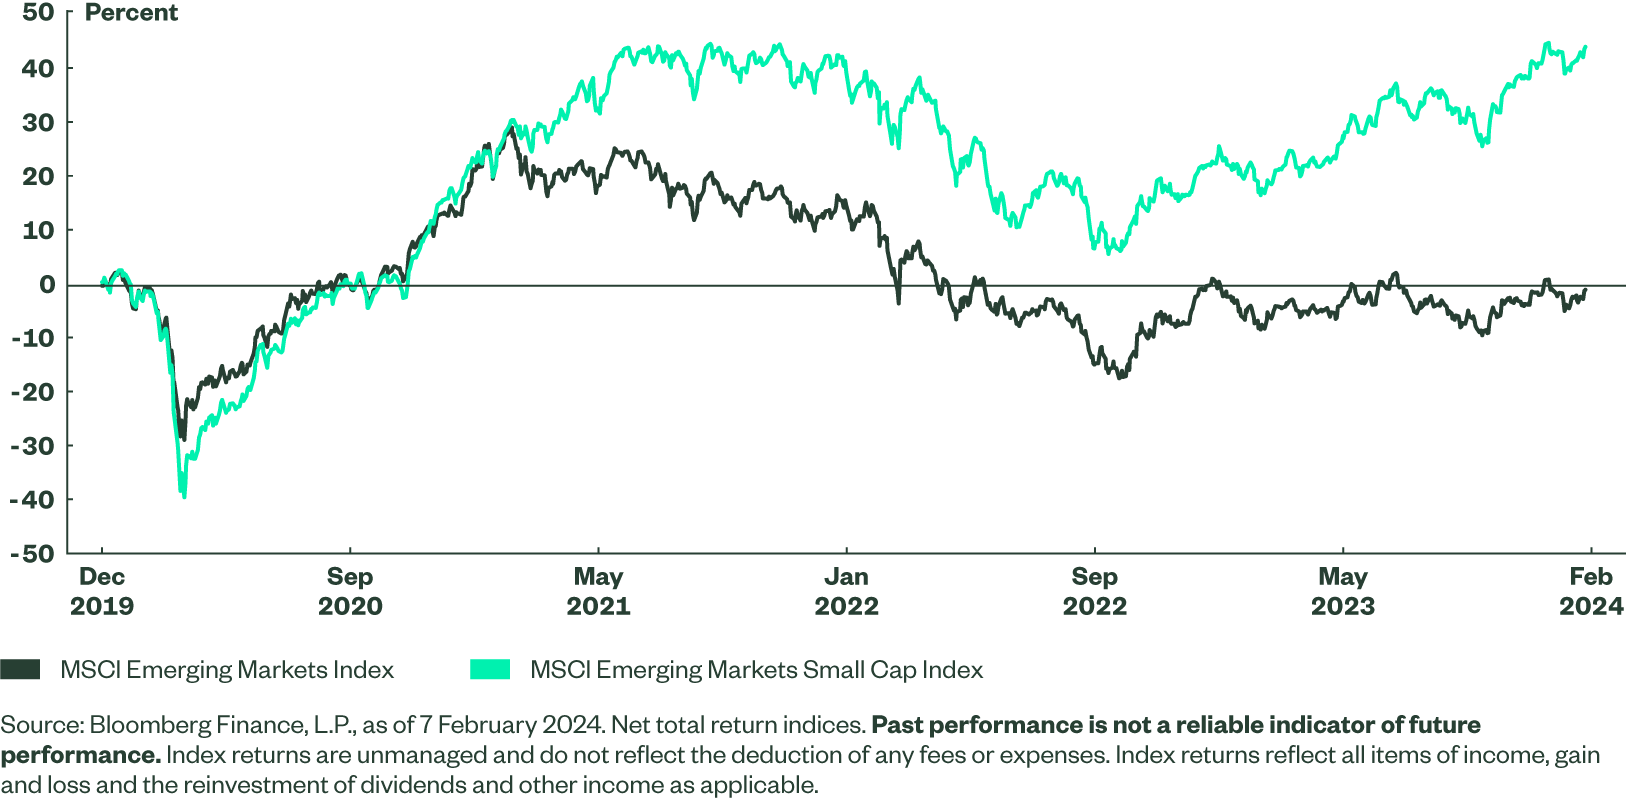
The country breakdown was the key driver of the MSCI EM Small Caps Index’s outperformance over the MSCI EM Index in recent years, and we expect it to remain a tailwind for the foreseeable future. EM small caps also generate a larger share of their revenue domestically, allowing for more direct benefit from relatively robust EM economies. The MSCI EM Small Cap Index is well diversified with the top 10 companies representing only 3% (versus 23% for the MSCI EM Index).7 Moreover, state-owned companies which may be less efficient account for only 8% while the corresponding number for the MSCI Emerging Market Index is 23%.8
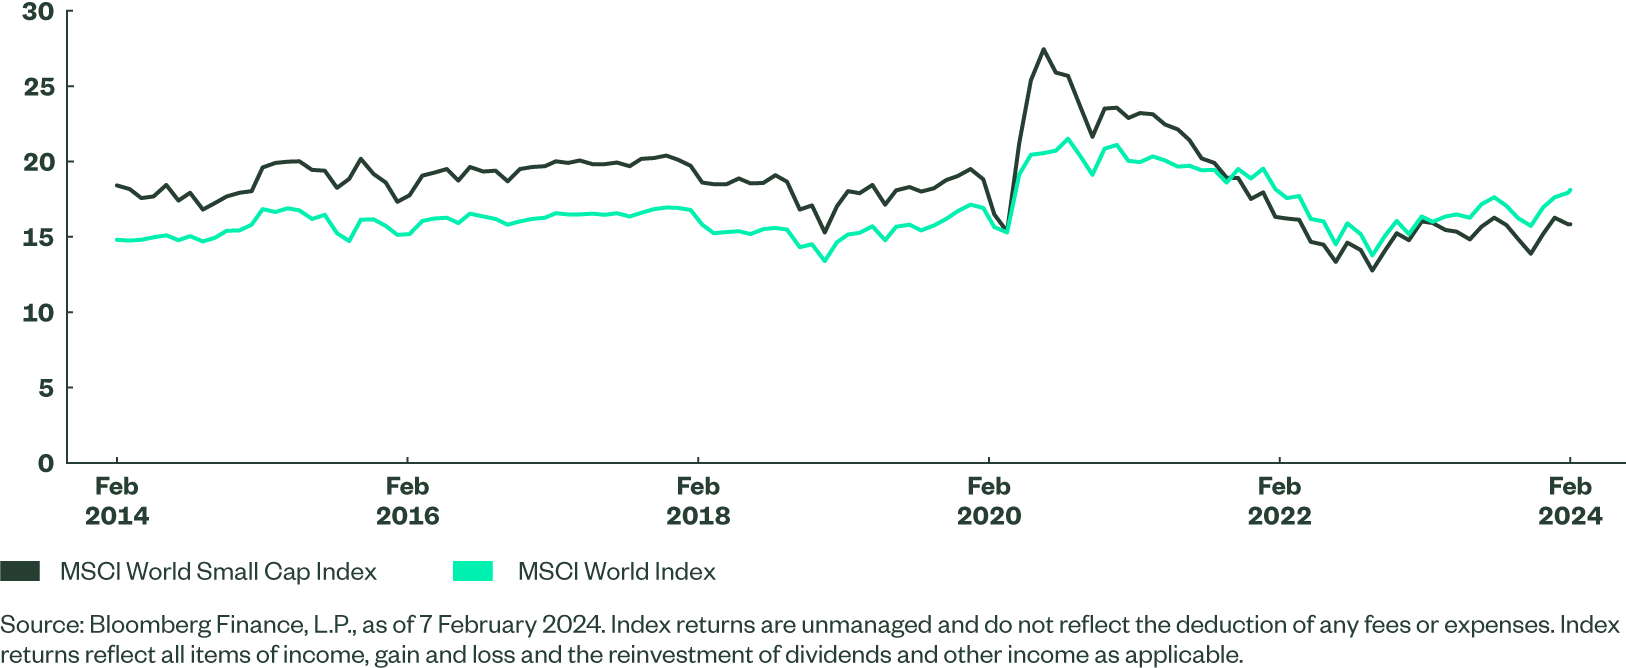
Figure 8: Performance Since the End of 2019