The yield curve's message for equity markets
A flatter yield curve, persistent inflation risks, and higher real rates are testing equity markets. As policy flexibility narrows, leadership is shifting away from valuation‑led trades toward quality balance sheets, durable cash flows, and earnings fundamentals.
Equity markets rallied on Monday (3/23) following reports of a pause in hostilities between Iran and US/Israel, with technology stocks leading gains and US 2-year Treasury yields falling sharply as policy expectations eased. While markets have welcomed signs of de-escalation, tensions in the region remain unresolved, and the risk of renewed conflict cannot be dismissed, with ceasefire positions appearing as far apart as the roughly 60 miles that separate the shorelines of the Strait of Hormuz. A prolonged, multi-month conflict is not our base case, but it represents a meaningful tail risk that merits consideration given its potential implications for inflation, interest rates, and broader risk appetite.
Chart of the Week
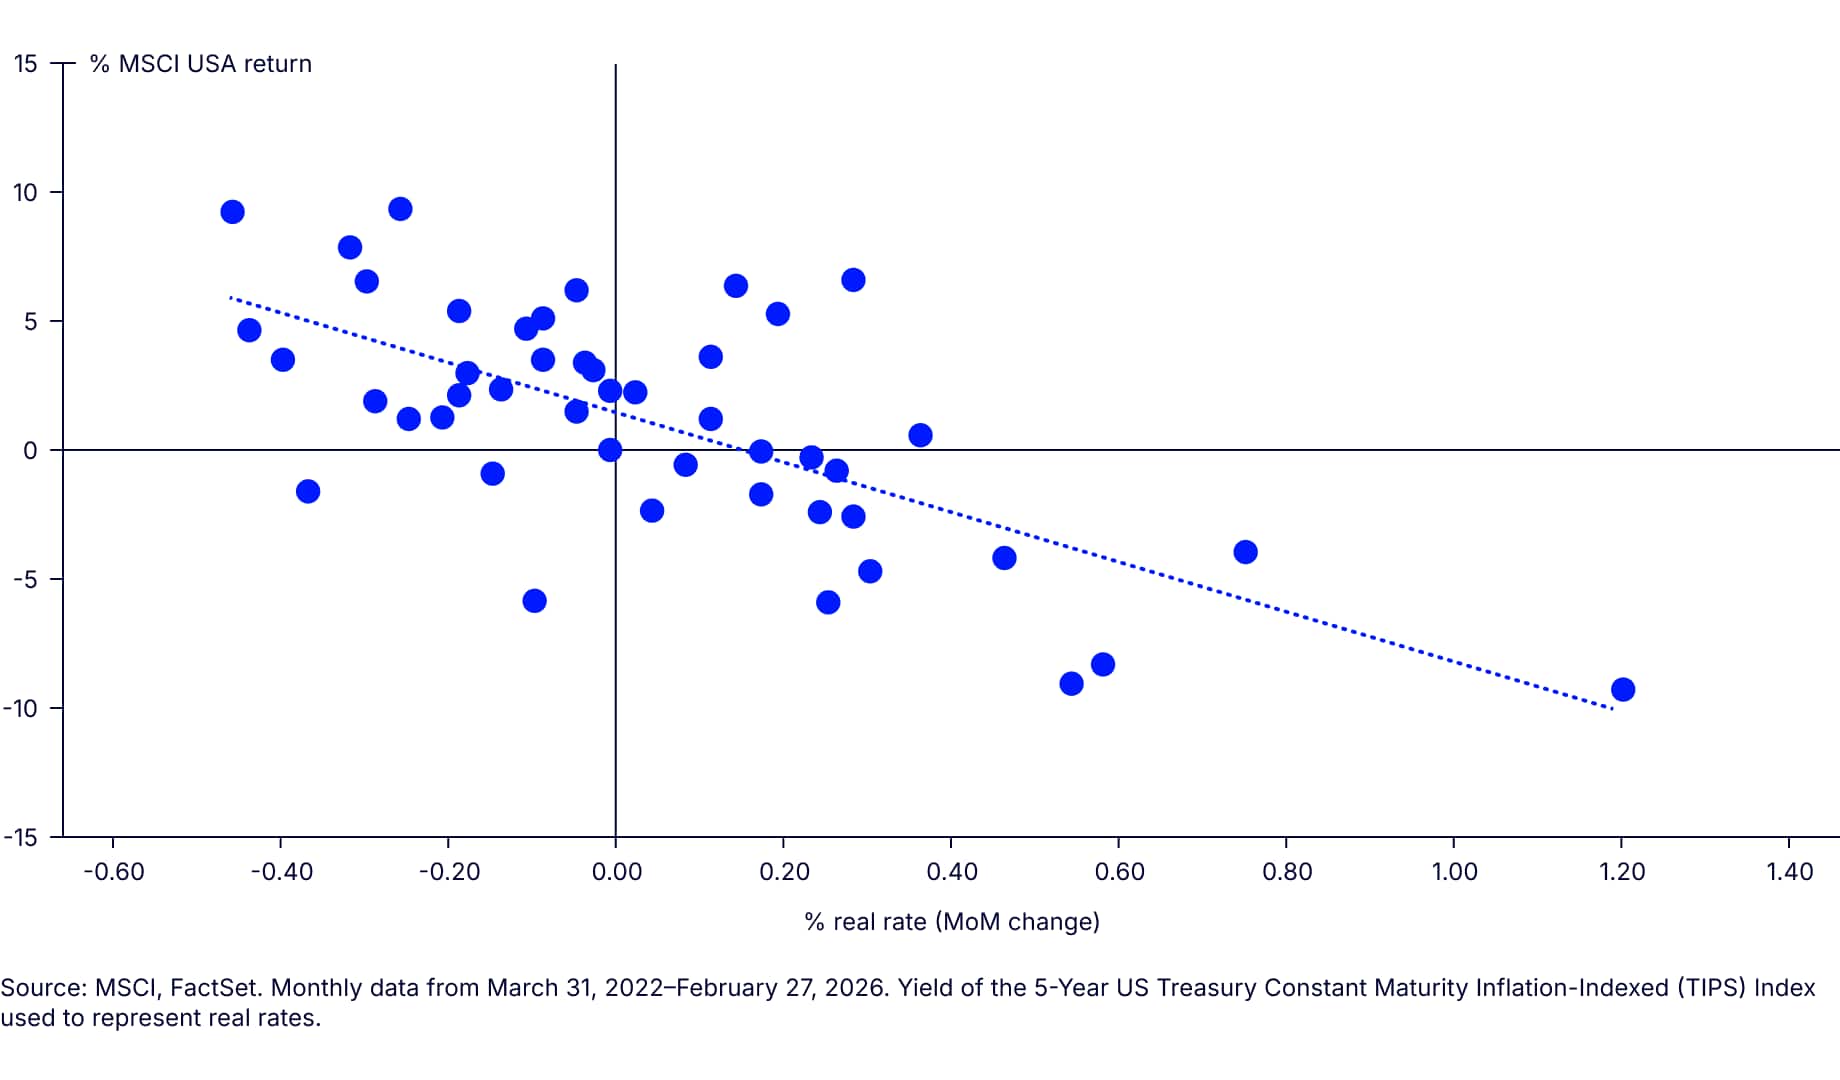
Equities want lower real rates
Weekly highlights
Source: FactSet, 1/2/26-3/24/26.
Source: FactSet. Using monthly total return data in USD, 2/29/16-2/27/26.
Source: FactSet. Data as of 3/24/26 in USD.
Until recently, equity markets had been supported by a steepening yield curve, as expectations for more accommodative monetary policy reinforced signs of improving growth and favorable liquidity conditions. Cyclical sectors and value exposures responded accordingly, driving the “broadening out” trade that emerged in early 2026. A flattening curve, however, tells a different story. It signals that near-term policy may remain restrictive even as longer-term growth expectations become more constrained. For equities, this shift matters: lower term premiums compress the tolerance for valuation risk, elevate the importance of durable cash flows, and make returns increasingly dependent on fundamentals rather than financial conditions.
An evolving yield curve?
The year began with a meaningfully steeper yield curve, with the 2s10s spread at 71.53 bps on January 2—a backdrop that typically supports small caps and value by signaling improving growth expectations and a more accommodating path for policy. Since then, the curve has flattened by approximately 25.24 bps to 46.29 bps (FactSet, as of 3/24/26). Markets on March 24 alone saw notable yield-curve flattening from just the day before, with the 2-year yield surging by roughly 8 bps to 3.92% and 10-year yields rising by 5 bps to 4.39% (FactSet, 3/24/26). The composition of the recent curve flattening matters: it has been driven largely by the front end, consistent with a repricing of near-term monetary policy rather than a reacceleration in long-run growth expectations. At the start of the year, markets were discounting roughly two cuts over 2026; as of March 24, that expectation has faded materially, with no cuts being priced in this year at all.
At the same time, persistently elevated oil prices are keeping inflation risks alive by lifting headline pressures and by raising the possibility that higher input costs begin to seep into broader pricing. That combination can be particularly restrictive for risk assets. It limits the Fed’s flexibility to ease, while also increasing the risk of demand destruction as energy acts like a tax on consumption and margins. If these dynamics persist, they would likely reinforce further flattening and keep real rates elevated, especially at the front end.
Style implications: Value versus growth
A flatter yield curve puts pressure on cyclicals that extends to value, financials, and small caps. In this context, value is likely to face headwinds relative to growth. With that said, growth is not immune: elevated valuations raise the bar for performance, reinforcing the importance of quality balance sheets and durable fundamentals to justify current pricing. This topic, as it relates to the AI trade, was explored in last week’s Mind on the Market.
History supports this dynamic, particularly in periods when real rates remain elevated or move higher. When yield spreads compress in a rising or restrictive real-rate environment, growth has often meaningfully outpaced value, as factor relationships tend to reinforce these regime shifts. Quality and growth typically move in tandem, reflecting a shared sensitivity to balance-sheet strength, earnings durability, and lower operating leverage to the economic cycle—attributes that become more valuable when discount rates stay high. Conversely, value and small caps tend to cluster together, benefiting more from improving growth expectations and easing financial conditions. Empirically, the excess returns of small caps and value1 exhibit a strong positive correlation of 0.86, while the excess returns of quality and growth2 assets are similarly correlated at 0.92 (FactSet, using monthly data 2/29/16-2/27/26 in USD). These correlations suggest that a sustained flattening environment may not only favor growth over value, but also quality over more cyclically exposed segments of the market.
What about the strong start for small caps?
Given this close linkage between value and small caps, the same macro forces (should they persist) that weigh on value also pose meaningful challenges for smaller-cap companies. A higher-for-longer rate environment poses challenges for small caps, which typically rely more heavily on external financing. Notably, small-cap companies continue to exhibit higher debt levels relative to earnings, a trend that has intensified in recent years. Meanwhile, large-cap balance sheets have generally strengthened over the same period.
The sector composition of small cap structurally favor cyclicals. Financials, an important weight within small cap indices, face margin pressure when yield curves flatten, squeezing the spread they can earn from lending. However, this concern is not yet realized, as the earnings outlook for small-cap financials remains steady so far, when comparing the one-year EPS growth estimate for 2026 from present to the beginning of the year. Industrials, another key small-cap sector, could also face margin compression as the oil shock drives up energy input costs. To that point, one-year EPS growth estimates for CY 2026 have declined since the start of the year, falling to 8.31 from 10.85 for small-cap industrials (FactSet, 3/20/26). Meanwhile, energy, materials and information technology have driven much of recent small cap performance YTD.
Maintaining perspective as conditions shift
A flattening yield curve, persistently elevated oil prices, and renewed inflationary pressure point to an equity environment that is less forgiving of long-duration exposures and more demanding of fundamentals. A flatter curve reflects expectations that policy will remain restrictive relative to longer-term growth, while higher energy prices reinforce cost pressures and limit central banks’ flexibility to ease. In this setting, real rates tend to remain restrictive, and often rise modestly at the front end, not because growth expectations are improving, but because inflation proves sticky while nominal yields fail to decline meaningfully. The result is a higher hurdle rate for risk assets and a narrower path to sustained equity outperformance. While our Chief Economist continues to expect 2-3 rate cuts later this year as labor conditions soften, near-term inflation pressures suggest that easing is likely to be gradual, leaving financial conditions tighter for longer than equity markets may currently anticipate.
While not our base case, a flatter yield-curve environment has historically reduced the market’s tolerance for valuation risk, shifting equity leadership away from liquidity-driven narratives and toward earnings and fundamentals. In the event of a prolonged geopolitical conflict—a low probability but relevant tail risk—this dynamic would become more pronounced. Rather than a directional market call, it serves as a reminder that periods of elevated uncertainty and constrained policy flexibility tend to reward durable cash flows and balance-sheet strength, an important consideration for investors positioning portfolios across a wider range of potential outcomes.

Go beyond the headlines...
Skimmed the summary? Dive deeper with the full PDF—your go-to for weekly market insights and analysis.