Nature and biodiversity data: types and uses for investors
Introduction
In a State Street Investment Management survey of EMEA-based asset owners in May 2025,1 53 per cent of respondents said they plan to increase allocations to nature- and/or biodiversity-related investments over the next two years. Of respondents who currently integrate nature and biodiversity objectives in their investment process, 42 per cent noted a lack of reliable and/or scalable data as one of their top three challenges.
Previous papers in this series addressed nature and biodiversity from two perspectives. The first described nature as an asset that underpins economic activity across many sectors.2 The second outlined different objectives investors may have when integrating nature in portfolios, including managing nature-related dependency risks and identifying investment opportunities tied to nature and biodiversity.3
This paper reviews the current state of nature-related data for investors in public markets, the types of data available, and the investment objectives they may address in the portfolio construction process. It also outlines current limitations and recent developments in the data landscape.
As data quality, granularity, and availability evolve, an understanding of the types of data available and their intended use cases may help investors evaluate how these datasets align with their objectives.
The nature data landscape
We believe nature as an investment consideration is multidimensional, requiring an understanding of the relationship between nature and economic activity across sectors, geographies, and ecosystems. This complexity is reflected in the data landscape. As investor interest in nature has grown, new datasets have emerged that address nature dependencies, impacts, risks, and opportunities.
In this context, understanding the types of data available—and how they may be used in a portfolio context—is relevant to different investor objectives, such as mitigating nature-related dependency risks, mitigating potential impact on nature, or identifying investment opportunities from solutions that aim to contribute to preserving natural capital.
Table 1 categorizes nature and biodiversity data reviewed for this paper into different types, and highlights considerations and portfolio implementation strategies for each. Multiple data types may be used to target the same objective, and some metrics span more than one category. Depending on the investor’s return, risk, and sustainability objectives, it may be appropriate to incorporate multiple data types into portfolio construction.4
Table 1: Nature and biodiversity data types, investment objectives, and portfolio implementation strategies
Data Type | Description | Metric Examples | Investment Objectives | Considerations | Examples of Portfolio Implementation Strategies |
| Exposure | Identifies business activities/assets in biodiversity-sensitive locations or that could lead to nature degradation | Revenues dependent on availability of water supply | Mitigate portfolio nature- related dependency risks Mitigate potential impact of portfolio on nature | May be paired with location data of portfolio company activities, assets, end markets, and supply chains to identify exposure to nature risks | Minimize exposure to business activities and/or asset locations that may lead to nature degradation through negative screening or portfolio optimization Maximize exposure to business activities and/or asset locations that have low exposure to nature degradation through positive screening or portfolio optimization |
| Management | Provides insight into a company's management of nature-related risks and dependencies through policies and mitigation strategies | Company policies addressing ecosystem services e.g. water use and management, land restoration, and deforestation Resource efficiency metrics (e.g. water saved, waste water treated, commodity certifications) Operational indicators e.g. toxic emissions, water pollution, land use | May be used with exposure data to identify companies with high exposure to nature-related risks and to assess the relative strength of their management practices | Minimize exposure to companies with weak nature-risk management practices through negative screening or portfolio optimization Maximize exposure to companies with strong nature-risk management practices through positive screening or portfolio optimization | |
| Controversies | Identifies involvement in controversies related to nature degradation or biodiversity loss | Severe or notable controversy flag | Based on our review, this data may be among the most accessible data types to implement, but is generally limited to identifying negative performers and may lack sufficient granularity to differentiate between dependency risks and potential portfolio impact | Minimize exposure to companies with nature-related controversies through negative screening or portfolio optimization | |
| Footprint | Estimates the potential change in the state of nature from the portfolio at a local level (e.g., MSA) or a global level (e.g., PDF) as a result of a company's activities | Mean Species Abundance (MSA) Potentially Disappeared Fraction (PDF) of species | Mitigate potential impact of portfolio on nature | Footprinting solutions may distill multiple dimensions of biodiversity loss into a single measure. However, they currently rely heavily on model assumptions and extrapolations based on business activity revenues | Minimize exposure to companies with a high biodiversity footprint through negative screening or portfolio optimization Maximize exposure to companies with a low biodiversity footprint through positive screening or portfolio optimization |
Source: State Street Investment Management analysis. Data as of 31 December 2025. Note: The choice of portfolio implementation strategies should be considered within the context of other investment objectives of the portfolio (e.g., returns or tracking error).
In addition, some investors seek to align portfolios with nature-related UN Sustainable Development Goals (SDGs): SDG 12 Responsible Consumption & Production, SDG 14 Life Below Water, and SDG 15 Life on Land. With additional analysis to map specific data points to these SDGs, the data types described above may be used to facilitate alignment with these goals.
Investor use cases
Example 1: Using exposure and management data types to mitigate portfolio nature-related dependency risks
For investors focused on mitigating nature-related dependency risks in portfolios, combining data that identifies portfolio dependencies on material ecosystem services with data assessing company management practices may serve as a starting point, particularly when location data is incorporated. For example, exposure data may indicate high portfolio water dependency through a large portfolio weight to semiconductor producers and material water scarcity in these producers’ manufacturing facility locations. Management and operational indicators may indicate whether portfolio companies facing this dependency risk have water management policies in place, with some datasets assessing the relative strength of these practices based on provider methodology, or demonstrate operational efficiencies (e.g., low water intensity relative to peers).
One application of the results may be to decrease portfolio exposure to companies with high dependency and weak risk management practices, or increase exposure to companies with evidence of more developed risk management practices, with the objective of mitigating portfolio risk tied to water scarcity and potential operational disruptions. The choice of portfolio construction strategy (e.g., screening, tilting, or portfolio optimization) would depend on the investor’s return, risk, and sustainability objectives.
Example 2: Using nature solution data to identify investment opportunities from solutions contributing to natural capital preservation
Investors seeking to identify opportunities from nature-related solutions may use nature solution data to screen for companies that contribute to preserving natural capital. These data include, for example, revenue from products and services addressing biodiversity loss, as well as indicators measuring outcomes, such as the volume of water saved or area of land reforested. Once an investor uses these data to identify companies contributing to solutions, they may increase portfolio exposure through, for example, positive screening or portfolio optimization. As the nature solutions opportunity set is at an early stage of development, nature solution data may be combined with data related to other sustainability objectives to broaden across sectors, geographies, and SDG alignment.
Data Challenges
State Street Investment Management’s survey of EMEA-based asset owners referenced above indicates that, despite growing awareness of the relevance of nature and biodiversity, respondents face challenges in accessing and employing decision-useful data to meet their nature-related objectives. As noted in the Introduction, 42 per cent of respondents who currently integrate nature and biodiversity objectives in their investment process cited a lack of scalable and/or reliable data as one of their top three challenges to implementation.5
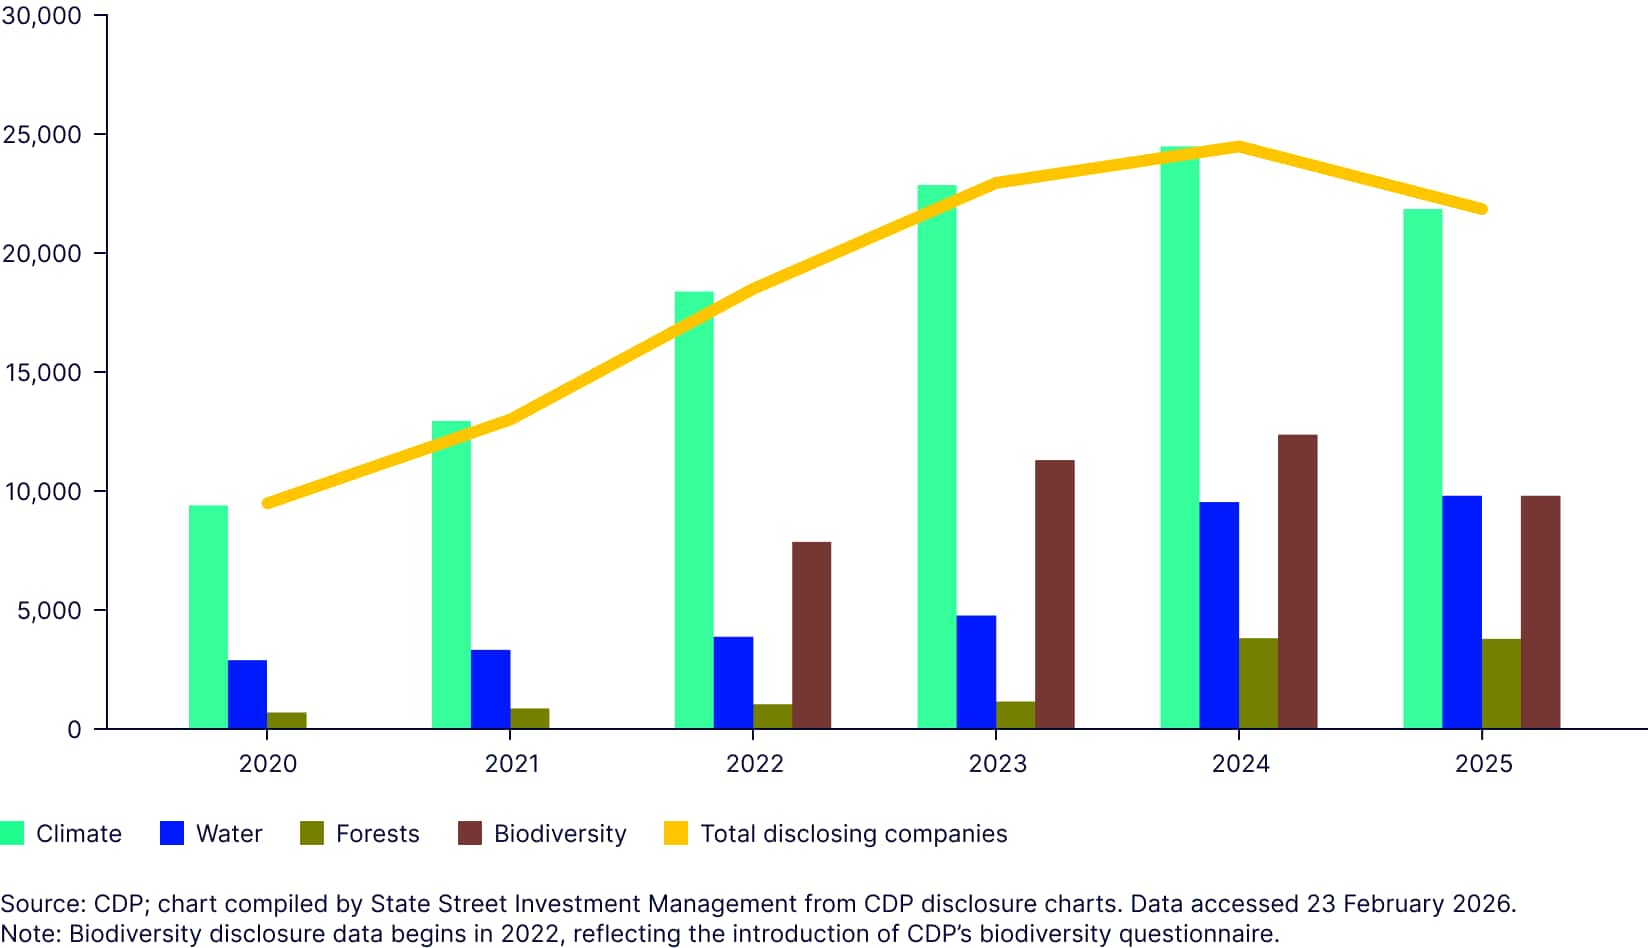
A review of the data landscape conducted for this paper identified several challenges. Examples include limited corporate disclosure, a high incidence of modeled data from providers as a result, a short history of available data, and the absence of standardized measurement methodologies. Corporate disclosure related to biodiversity has increased, but as Figure 1 illustrates, it remains well below current levels of climate disclosure.6,7
Figure 1: Number of companies disclosing to CDP by environmental theme
The complexity of nature as an investment consideration is also part of the challenge, as no single indicator captures all aspects of nature relevant to investors. This may necessitate the use of multiple datasets and indicators to address a specific objective, which may be resource-intensive for investors to access and interpret. Understanding different datasets and evaluating their applicability to investment decision-making may require time as new datasets become available. This may explain another finding from the survey: state-of-nature metrics such as Potentially Disappeared Fraction (PDF) and Mean Species Abundance (MSA) are currently among the least used by surveyed EMEA-based investors, while indicators related to policy commitments and nature-positive revenues are more widely adopted by respondents.8
The limitations of existing datasets have prompted development of new approaches, with data providers working toward more transparent and comparable metrics. Enhanced modeling techniques, broader adoption of disclosure frameworks, and increased regulatory activity may contribute to improvements in data availability and quality over time.
Conclusion
As previous papers in this series have outlined, nature is an asset underpinning economic activity across many sectors.9 Companies may face increasing risks tied to their dependencies on nature as biodiversity loss continues. Some investors are integrating nature-related considerations into portfolio strategies. This may be motivated by the goal of mitigating risk or identifying opportunities.
Risk mitigation may involve identifying companies with resource management practices suited to their nature dependencies, particularly in sectors with high exposure. Opportunity identification may focus on companies developing products and services that contribute to nature preservation, such as water treatment technologies and regenerative agriculture.
The nature data landscape is likely to continue evolving. Despite the challenges outlined above, new approaches are contributing to improvements in the availability and quality of decision-useful information. As investor interest develops, approaches to integrating nature within portfolio construction—such as screening, tilting, and optimization—may continue to evolve. Continued progress in data transparency and quality may support further integration of nature-related objectives in investment strategies.