Emerging market debt: Why index choice matters
A falling US dollar (USD) has historically supported emerging market (EM) debt, so investors are watching the sector. But allocators should be aware that index choice matters in EM debt exposures. Differences in country eligibility, weighting, and duration matter more when country mixes, currency exposure, and duration are key drivers of return.
In today’s EM environment, benchmark choice is no longer neutral. With this in mind, we compare the two dominant European EM local currency ETF benchmarks—the J.P. Morgan Government Bond Index – Emerging Markets and the Bloomberg Emerging Markets Local Currency Government Index. Both span a wide spectrum of issuers, ranging from countries with stronger fundamentals than many developed markets to frontier economies. The ability to issue bonds in the local currency requires countries to have achieved a certain degree of sophistication and financial infrastructure, but there is no consensus on what constitutes an eligible EM local currency market. As a result, index methodology plays a central role in shaping exposure.
Emerging market debt: Benchmark battleground
J.P. Morgan and Bloomberg indices account for close to 98% of AUM in the EM local currency market in Europe.1 J.P. Morgan offers variants of the J.P. Morgan Government Bond Index Emerging Markets Global Diversified, some with floors as well as caps.
This analysis compares the standard J.P. Morgan index with the Bloomberg EM Local Currency Liquid Government index. Country eligibility is the primary driver of index outcomes (Figure 1).

Figure 1: Country selection criteria for EM debt
| Bloomberg Emerging Markets Local Currency Liquid Government Bond Index | J.P. Morgan Government Bond Index Emerging Markets Global Diversified | |
| Emerging Market country definition and eligibility | Bloomberg uses a fixed list of emerging market countries that is reviewed annually to define country eligibility in dedicated EM hard currency, local currency and inflation-linked benchmarks. Criteria for inclusion in the EM country list are rules based and include: Countries that meet one of the following two criteria: World Bank Income group classifications of low/middle income OR International Monetary Fund (IMF) classification as a non-advanced country | A country’s GNI per capita must be below the Index Income Ceiling (IIC) for three consecutive years to be eligible for inclusion to the EMBI Global. J.P. Morgan defines the Index Income Ceiling (IIC) as the GNI per capita level that is adjusted every year by the growth rate of the World GNI per capita, Atlas method (current US$), provided by the World Bank annually. An existing country may be considered for removal from the index if its GNI per capita is above the Index Income Ceiling (IIC) for three consecutive years as well as the country’s long term foreign currency sovereign credit rating (the available ratings from all three agencies: S&P, Moody’s, and Fitch) is A-/A3/A- (inclusive) or above for three consecutive years. |
Additional criteria | In addition to being defined as an Emerging Market under Bloomberg EM country definition, inclusion in the EM Local Currency Liquid Government Bond Index is also based on market size and an evaluation of market investability. The maximum weight of a country is capped at 10% based on market cap. | The unique diversification scheme ensures that weights among the index countries are more evenly distributed by reducing the weight of large countries and redistributing the excess to the smaller-weighted countries. The maximum weight per country is at 10%.
|
Recent index changes | China added April 2019. Russia removed in March 2022. India added January 2025. | China added April 2020. Russia removed in March 2022. Egypt admitted in January 2022 then removed in January 2024. India included from June 2024. |
| Source: State Street Investment Management, Bloomberg Finance, L.P., J.P. Morgan, as of 30 January 2026 | ||
Most countries are common to both indices, but there are material differences. Only Bloomberg’s index includes South Korea, the Philippines and Israel, resulting in a tilt toward APAC and MEA relative to JPM’s index.
J.P. Morgan’s index includes small countries such as Serbia, the Dominican Republic, and Uruguay, with a total weight below 1%, which Bloomberg’s excludes. Some J.P. Morgan index variants that have a floor may exclude these countries.2
Both indices contain 19 issuers but J.P. Morgan’s smaller number of large constituents means more countries reach the 10% cap. This results in higher allocations to Mexico, Indonesia, Malaysia, Poland and South Africa.
By contrast, Bloomberg’s inclusion of large, higher quality issuers such as South Korea reduces concentration pressure elsewhere in the index (Figure 3).
Figure 3: Country weights and characteristics for EM debt indices
| Bloomberg EM Local Currency Liquid Govt Index | J.P. Morgan Govt Bond Index EM Global Diversified | ||||
| Market value (%) | Yield to worst | Option -adjusted duration | Market value (%) | Yield to worst | Option -adjusted duration |
China | 10.02 | 1.61 | 6.91 | 10.03 | 1.60 | 6.53 |
South Korea | 9.66 | 3.43 | 10.00 |
|
|
|
India | 9.55 | 6.66 | 6.07 | 10.04 | 6.65 | 6.12 |
Mexico | 8.64 | 8.27 | 4.58 | 10.01 | 8.36 | 4.94 |
Malaysia | 8.04 | 3.53 | 7.77 | 9.91 | 3.45 | 6.94 |
Indonesia | 7.89 | 6.07 | 6.09 | 9.89 | 5.93 | 5.40 |
Thailand | 7.36 | 1.96 | 9.31 | 8.15 | 1.70 | 6.34 |
Brazil | 6.54 | 12.67 | 2.86 | 6.43 | 12.69 | 3.04 |
Poland | 6.20 | 4.10 | 3.98 | 8.33 | 4.08 | 4.03 |
South Africa | 5.41 | 8.20 | 6.62 | 7.53 | 8.24 | 6.90 |
Israel | 3.40 | 3.71 | 6.43 |
|
|
|
Czech Republic | 3.25 | 3.89 | 5.44 | 4.69 | 3.86 | 5.37 |
Philippines | 3.17 | 5.72 | 5.06 |
|
|
|
Colombia | 2.64 | 12.19 | 4.61 | 3.67 | 12.18 | 4.56 |
Romania | 2.23 | 6.20 | 4.08 | 3.31 | 6.19 | 4.07 |
Turkey | 1.63 | 30.66 | 1.73 | 1.15 | 29.88 | 2.05 |
Peru | 1.51 | 5.34 | 6.77 | 2.08 | 5.29 | 6.55 |
Hungary | 1.43 | 6.18 | 4.53 | 2.28 | 6.13 | 4.20 |
Chile | 1.42 | 4.95 | 6.00 | 1.81 | 4.89 | 5.42 |
Dominican Republic |
|
|
| 0.25 | 9.27 | 5.94 |
Uruguay |
|
|
| 0.19 | 7.21 | 4.97 |
Serbia |
|
|
| 0.27 | 4.78 | 4.94 |
Total | 100.00 | 5.91 | 6.28 | 100.00 | 6.07 | 5.50 |
| Source: Bloomberg Finance L.P., J.P. Morgan, as of 30 January 2026. | ||||||
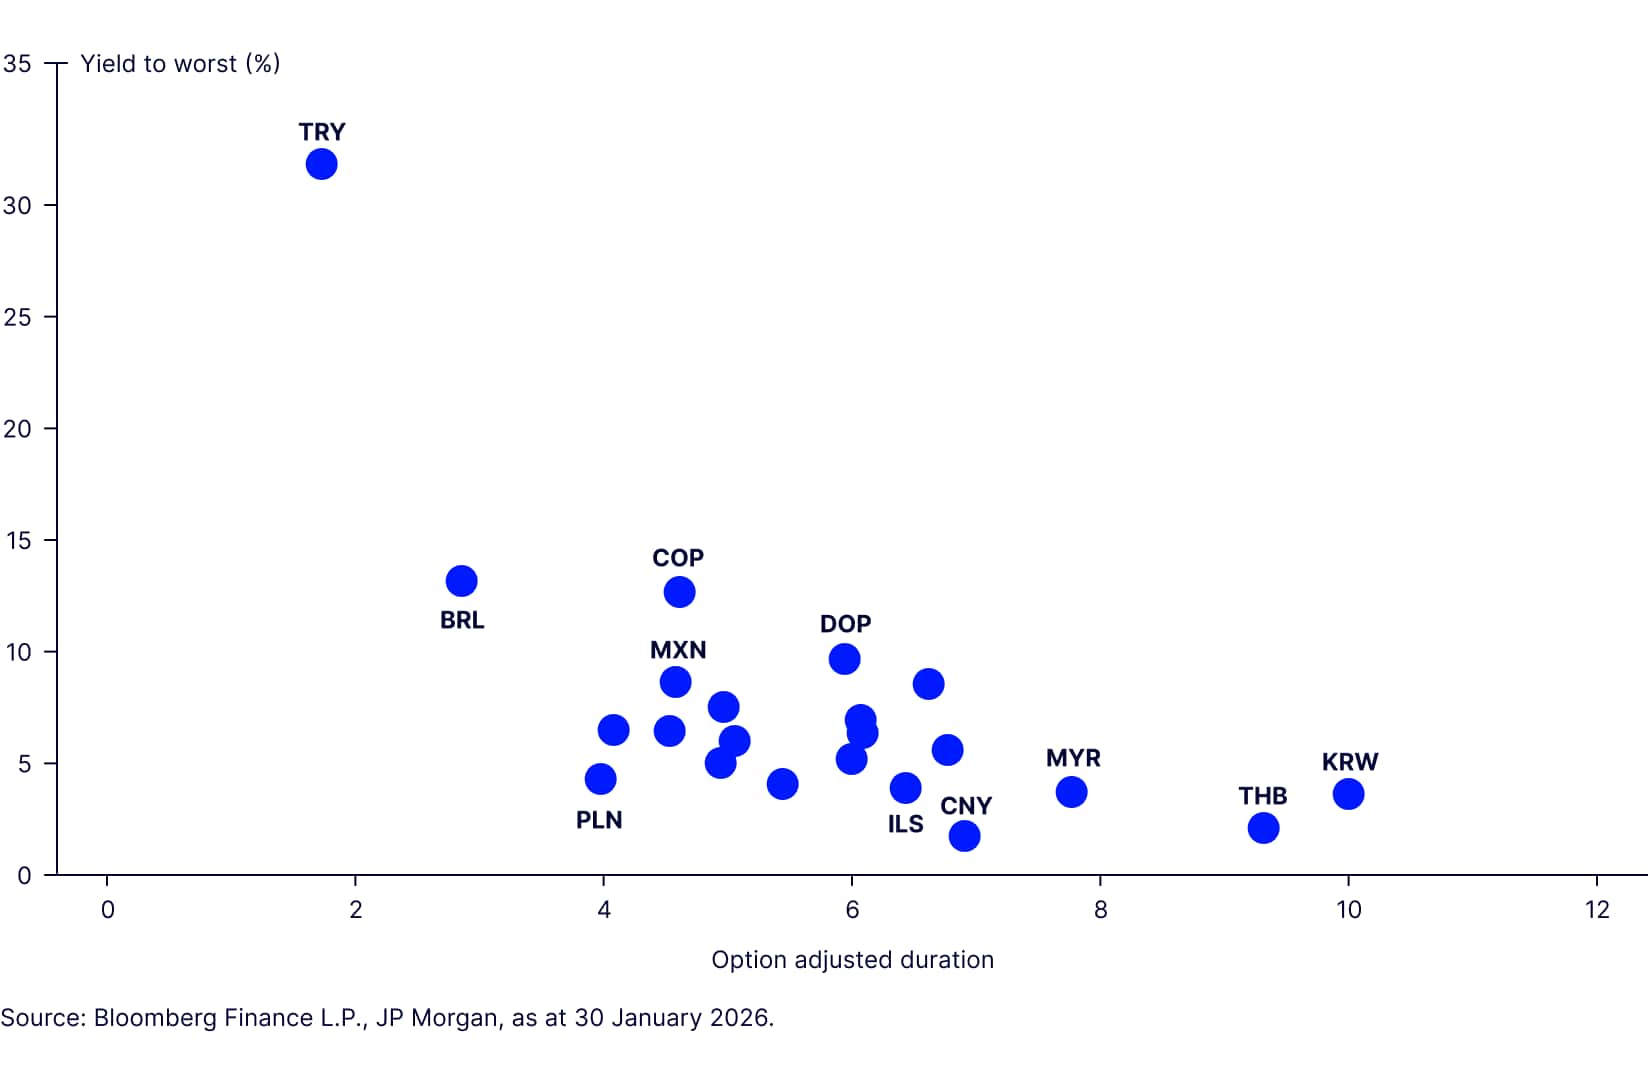
Plotting the average yield to worst against the average duration of the countries that make up these two indices shows different risk profiles of EM bond markets (Figure 4).
Figure 4: Country yield to worst versus duration for EM debt markets
Differing country weights can have a meaningful impact on overall index characteristics (Figure5). Key differences include:
- The Bloomberg index has a maturity and duration 0.8 years longer, driven largely by exposure to South Korea.
- J.P. Morgan’s index’s shorter duration is in part a result of its higher weight to Mexico and Poland, both of which include short-duration bonds.
Figure 5: EM debt index characteristics
| Bloomberg EM Local Currency Liquid Govt Index | J.P. Morgan EM GBI Global Diversified Index |
Number of bonds | 674 | 491 |
Mkt val (USD) | 8,271,179,079 | 3,585,724,778 |
Coupon (%) | 3.885 | 5.582 |
Yield to worst (%) | 5.91 | 6.06 |
Option-adjusted duration | 6.29 | 5.46 |
Option-adjusted spread | -3.70 | -3.33 |
Option-adjusted convexity | 0.82 | 0.55 |
Duration times spread | 2.01 | 1.88 |
Maturity (yrs) | 9.08 | 7.74 |
Current yield | 5.37 | 5.92 |
Index rating | A3/BAA1 | BAA1/BAA2 |
Liquidity quality assessment | 80.54 | 80.93 |
Issuer count | 19 | 19 |
Issuer count | 19 | 19 |
Issuer count | 19 | 19 |
Source: State Street Investment Management, Bloomberg Finance, L.P., J.P. Morgan, as of 30 January 2026.
·
Yields (yield to worst and current yield) are higher in the J.P. Morgan index, despite the longer duration of the Bloomberg index. One driver is the higher quality of the Bloomberg index, with a stronger bias towards A‑rated sovereigns, largely due to the inclusion of South Korea (AA) and Israel (A) (Figure 6).
- The J.P. Morgan index is overweight the Americas, where yields tend to be higher.
- Bloomberg’s larger allocation to Africa and the Middle East includes Israel, which has lowered overall yield.
- J.P. Morgan’s MEA exposure is concentrated in South Africa, a higher‑yielding market.
Performance and volatility
Performance comparisons in USD terms highlight how these structural differences play out (Figure 7). Over the past 12 months, returns have been stronger for the J.P. Morgan index. Global spread compression benefitted lower-rated issuers within the index. The longer-term performance of the two indices is more aligned.
Figure 7: Index returns and volatility
30/01/2026 | Annualised return (%) | Annualised volatility (%) | Sharpe Ratio | |||
Bloomberg EM LC Liquid Govt Index | JPM GBI EM Global Diversified Index | Bloomberg EM LC Liquid Govt Index | JPM GBI EM Global Diversified Index | Bloomberg EM LC Liquid Govt Index | JPM GBI EM Global Diversified Index | |
Last 1 year | 16.06% | 19.41% | 4.02% | 3.69% | 2.87 | 4.03 |
Last 3 years | 7.11% | 8.73% | 8.37% | 8.13% | 0.24 | 0.45 |
Last 5 years | 1.58% | 1.78% | 9.39% | 9.55% | -0.19 | -0.17 |
Last 10 years | 3.96% | 4.07% | 9.78% | 10.76% | 0.17 | 0.16 |
Source: State Street Investment Management, Bloomberg Finance, L.P., J.P. Morgan, as of 30 January 2026. Returns in USD terms. The performance data quoted represents past performance. Past performance does not guarantee future results.
The role of currency
Currency appreciation against the US dollar helped drive performance in 2025. The Hungarian forint, Czech koruna, and Mexican peso each rose more than 15% versus USD, all supporting the J.P. Morgan index (Figure 8). The Turkish lira lost over 21.5% of its value versus the USD, a headwind to Bloomberg’s index, which has a Turkish weight of around 50 basis points (bps) more than J.P. Morgan’s index.
The Bloomberg index return has been less volatile, despite its longer duration, likely as a result of a more conservative quality profile. Calendar-year performance shows that J.P. Morgan index moved more in both directions (Figure 9). But both had similar 5- and 10-year Sharpe Ratios.
India’s growing influence
The 2025 addition of India to both flagship EM indices is likely to drive performance convergence. Each index has roughly 10% exposure to India, and India’s duration sits between the current rate sensitivities of J.P. Morgan and Bloomberg EM indices.
Choosing an EM debt index is an active decision.
In EM local currency debt, benchmark selection materially shapes outcomes.
A higher quality tilt may offer greater resilience during periods of volatility, while a more yield‑oriented profile may perform better in risk‑on environments—particularly when the USD is weaker.
Index selection should be viewed as a strategic decision, not a passive move or an investment irrelevance. In periods of tectonic currency shifts, these decisions can have a material impact on returns.