Why bitcoin institutional demand is on the rise
Institutions are embracing bitcoin (BTC) for its diversification, long-term growth, and improving regulatory clarity. With rising adoption, BTC is seen by some as a legitimate asset in multi-asset portfolios—not just a speculative bet.


Not long ago, BTC was a little like a newly built city. But now, for some institutional investors, it’s moved from a purely speculative asset to a strategic allocation.
BTC once resembled a large, empty metropolis—mapped but uninhabited. From a regulatory, infrastructure, and adoption standpoint, it was more blueprint than reality—empty lots, unfinished roads, and no civic order.
Then the pioneers arrived. Builders, innovators, and early believers began constructing the first buildings, laying down utilities, and putting up signs.
The regulators, who previously had little to oversee, found themselves writing new codes and zoning laws to keep pace with the growth. As the scaffolding came down and the streets were named, more residents and businesses moved in. What was once a speculative development began to resemble a functioning city, with real infrastructure, clearer governance, and the potential for long-term prosperity. And that’s largely what it took for institutions to arrive—not with hard hats and blueprints, but with capital.
Institutions are no longer ignoring BTC as part of portfolios, and 94% believe in the long-term value of blockchain technology and digital assets.1
Figure 1: Many investors are bullish on BTC
of institutional investors have already invested or plan to invest in BTC exchange traded products (ETPs) 2
of institutional investors have exposure to digital assets, or plan to make digital asset allocations in 2025 3
total crypto ETF AUM 4
What’s driving institutional BTC adoption now?
BTC and digital assets overall have continued to mature, and institutions have taken notice, turning to BTC to potentially improve risk-adjusted returns and as a potential “debasement” hedge. There’s some other key reasons institutions turn to BTC, often as an on-ramp to digital asset exposures.
BTC remains dominant in the digital asset space
BTC is the first crypto asset. Born out of the Global Financial Crisis and first introduced in 2008 by the pseudonymous Satoshi Nakamoto, the vision of BTC was as a peer-to-peer electronic cash system. Despite the rise of other digital assets as the ecosystem has evolved, it remains the largest of all crypto assets by market cap. As of November 21st, 2025, BTC's market capitalization was approximately $1.65 trillion, representing almost 65% of the global crypto asset market.5
Amid a growing landscape for digital assets and their use cases—from stablecoins, to tokenization, and others—BTC remains a cornerstone of the digital asset world. Often viewed as a standard against which other crypto assets are measured, its pioneering role and substantial market capitalization make it a focal point for both new entrants and seasoned investors.
As the first crypto asset, BTC has the first mover advantage and longest performance history in the digital asset space. This extended history provides a more substantial dataset for analysis compared to most other crypto assets, which have shorter track records.
More favorable regulations towards digital assets
The regulatory approval of spot BTC ETPs in the US and other jurisdictions is a significant development, potentially opening access to a broader group of investors through more familiar investment vehicles. The US—one of the largest crypto asset markets—has continued to look favorably towards the overall industry.
Figure 3: Digital asset regulatory milestones
| Date | Jurisdiction | Milestone |
|---|---|---|
| Jan-24 | US | SEC approves the first spot BTC ETFs |
| Jul-24 | US | SEC approves the first spot Ethereum ETFs |
| Jun-24 | EU | MiCA (Markets in Crypto-Assets Regulation) implemented to harmonize crypto rules across member states |
| Oct-24 | Hong Kong | Licensing regime for Virtual Asset Service Providers (VASPs) introduced |
| Nov-24 | Japan | Payment Services Act updated to strengthen stablecoin and custody rules |
| Mar-25 | UAE (Dubai) | DIFC Digital Assets Law enforced for token issuance and trading |
| Apr-25 | Singapore | Stablecoin regulatory framework finalized under the Payment Services Act |
| Jul-25 | US | GENIUS Act signed into law |
| Jul-25 | Switzerland | Distributed ledger technology (DLT)/Token regime expanded to include tokenized securities and custody rules |
| Aug-25 | US | Executive order directing Treasury, Labor, and SEC to enable crypto in retirement solutions |
Source: State Street Investment Management; PwC “Global Crypto Regulation Report 2025” (Apr 2025); World Economic Forum “Digital Assets Regulation: Insights from Jurisdictional Approaches” (Oct 2024); Forbes Council Post “Digital Asset Regulation Around the World” (Aug 27, 2025); DLA Piper “Blockchain and Digital Assets News and Trends” (Oct 30, 2025); EY “2025 Global Financial Services Regulatory Outlook.”
US legislation such as the Guiding and Establishing National Innovation for US Stablecoins Act (GENIUS Act), passed in July 2025, and the Digital Asset Market Clarity Act should provide further clarity for market participants and encourage further investment into BTC and other digital assets.
Figure 4: Outlook for potential digital asset regulations in 2026
| Expected date | Jurisdiction | Anticipated milestone |
|---|---|---|
| Q1 2026 | UK | FCA expected to implement stablecoin regime under the Financial Services and Markets Act and related secondary legislation |
| Q2 2026 | EU | MiCA Phase II expected focus on remaining areas such as aspects of DeFi and NFTs (subject to EU work program) |
| Q3 2026 | Australia | Comprehensive crypto licensing framework expected under ASIC (following Treasury consultations) |
| Q4 2026 | Canada | Proposed amendments to enable broader tokenized funds/ETFs expected from securities regulators (CSA) |
Source: State Street Investment Management; PwC “Global Crypto Regulation Report 2025” (Apr 2025); World Economic Forum “Digital Assets Regulation: Insights from Jurisdictional Approaches” (Oct 2024); Forbes Council Post “Digital Asset Regulation Around the World” (Aug 27, 2025); DLA Piper “Blockchain and Digital Assets News and Trends” (Oct 30, 2025); EY “2025 Global Financial Services Regulatory Outlook.”
Increased access options through registered vehicles
Not long ago, owning crypto could be difficult—especially as an institutional investor. Custody was fragmented, compliance was murky, and owning BTC through unregistered vehicles can be operationally complex.
Through the passage of registered vehicles for institutions to access BTC investment, interest in the asset has climbed. The broader US BTC ETF market grew 45% to $103B AUM, increasing institutional share slightly to 24.5%.6 And 60% of institutional investors report they prefer to gain exposure to crypto through registered vehicles.7
Expanding use cases for digital assets
“What’s the use case?” Has long been a question in the technology community and investors alike around cryptocurrencies like BTC. But we’re starting to see real world applications of blockchain technologies like BTC.
Figure 5: Digital asset use case examples
| Use case | Description | Key benefits |
|---|---|---|
| Cross-border payments | Cryptocurrencies like BTC and stablecoins enable fast, low-cost international money transfers, bypassing traditional banking rails and reducing settlement times from days to minutes | Lower costs, faster settlement, global accessibility |
| Decentralized finance (DeFi) | DeFi platforms offer lending, borrowing, trading, and yield generation without intermediaries. Users can earn interest, take out loans, or swap assets using smart contracts on blockchains like Ethereum | Disintermediation, programmability, global access |
| Tokenized assets | Real estate, art, commodities, and even equities are being tokenized—turned into digital representations on blockchains—making them easier to trade, fractionalize, and settle | Fractional ownership, liquidity, efficient settlement |
| Smart contracts | Smart contracts automate business logic—like escrow, royalties, or supply chain triggers—without needing intermediaries. This reduces costs and increases transparency | Automation, transparency, reduced costs |
| Stablecoins | Stablecoins are pegged to fiat currencies and used for payments, payroll, and remittances. They combine the stability of traditional money with the speed and programmability of crypto | Price stability, fast transactions, programmability |
| Yield generation | Earning interest or rewards through staking or liquidity provision | Passive income, decentralized opportunities |
| Settlement | Blockchain enables near-instant settlement and transparent record-keeping. Custodians can reduce reconciliation workloads and settlement risk by integrating distributed ledger technology into their operations | Near-instant processing, reduced risk, transparency |
| Governance and DAOs | Decentralized Autonomous Organizations allow token holders to vote on proposals, budgets, and governance rules, creating transparent and democratic organizational structures | Decentralized decision-making, transparency, inclusivity |
| Identity and compliance | Blockchain-based identity solutions enable secure, verifiable digital identities, streamlining KYC/AML processes and reducing fraud | Enhanced security, fraud reduction, streamlined KYC |
| Rewards and loyalty programs | Brands can issue tokenized loyalty points or rewards on blockchain, making them transferable, tradable, and interoperable across ecosystems | Interoperability, transferability, customer engagement |
| Gaming and virtual assets | Blockchain enables ownership of in-game assets through NFTs, allowing players to trade or monetize holdings across platforms | True ownership, monetization, cross-platform trading |
| Supply chain management | Blockchain provides immutable records for tracking goods from origin to consumer, improving transparency and enabling automated payments upon delivery | Traceability, fraud prevention, automated triggers |
Source: State Street Investment Management.
Tokenized securities, programmable money, and blockchain-based settlement systems are reshaping how assets are issued, traded, and custodied. BTC’s integration into these systems positions it not only as a potential store of value, but as a foundational layer for innovation.
Did you know?
One of the most famous examples of using BTC as a means of payment is when one software developer in Florida paid 10,000 BTC for pizza. At the time, that 10,000 BTC was worth about $41. By May 2025, it was worth around $1.1 billion.8
But that transaction and others like it were just the beginning of how banks, consumers, and others can use blockchain technology like BTC. As BTC’s use cases and assets like it could continue to grow, the overall ecosystem should benefit. Institutions aren’t just investing in BTC—they’re investing in the infrastructure and ecosystem it enables.
BTC’s trading profile: It is evolving, but there are trends
Some institutional investors have been cautious about crypto assets like BTC mainly because of their history of extreme price volatility. For institutions looking to invest in BTC, there’s some trends to keep in mind.
BTC volatility has been trending down
BTC volatility has evolved since its inception and has been trending downward over time. Figure 6 shows that BTC two-year volatility started our sample period extremely elevated and then declined sharply before trending downwards over about the last 5 years. Ether showed a very similar volatility profile until the second half of 2022, when its volatility declined sharply as the Ethereum network transitioned its consensus mechanism from proof of work to proof of stake in September 2022, also known as “the merge.” Although, Ether volatility has picked up from the start of 2025.
However, despite recent trends, it’s clear that both BTC and Ether have significantly higher volatility than broad market equities in relation to the S&P 500. But both risk measures have been trending down.
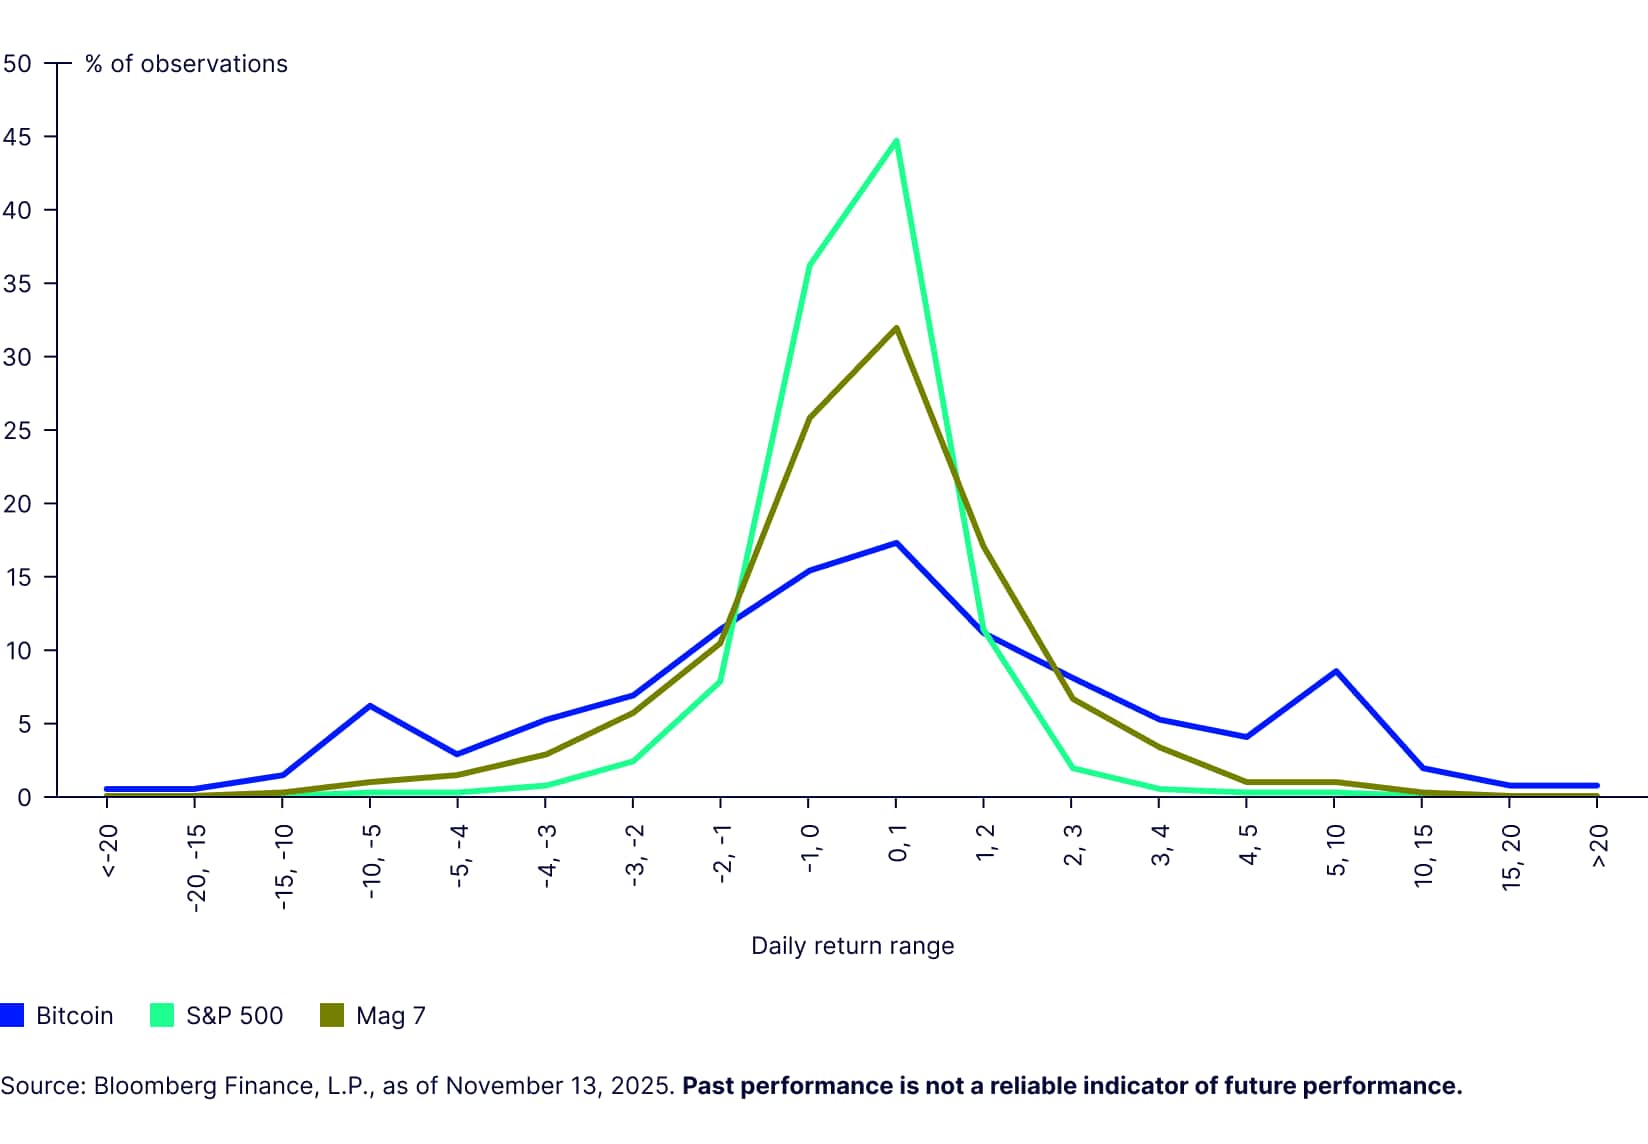
BTC’s return distribution is super fat-tailed
BTC tends to have more dramatic price swings than traditional stocks, which appears in its return distribution. It has considerably fatter tails, both on the upside and downside, and a much lower central peak than seen with broad market equities or even a narrow subset, represented by the “Magnificent 7.”
Figure 7: BTC is very fat-tailed on the upside and downside
Daily return distribution
BTC’s drawdowns are way more “V-shaped”
Although BTC’s drawdowns are, on average, more significant and more frequent than traditional asset classes, it also tends to recover more quickly. BTC’s biggest price drop was about as bad as the tech crash in the early 2000s, but it bounced back in a little over two years. In comparison, it took US tech stocks 14 years to fully recover from the dot-com bubble.
Figure 8: BTC has had steep drawdowns but tends to recovers quickly
| Starting date | Maximum drawdown | Average of four largest drawdowns | |||||
|---|---|---|---|---|---|---|---|
| Drawdowns (%) | Drawdown period (Months) | Drawdown recovery period (Months) | Drawdowns (%) | Drawdown period (Months) | Drawdown recovery period (Months) | ||
| BTC | December 31, 2012 | -79.8 | 14 | 25 | -67.42 | 11 | 16.5 |
| S&P 500 | December 31, 1990 | -50.95 | 16 | 37 | -34.79 | 13.25 | 26.25 |
| S&P 500 Info. Tech Sector | December 31, 1990 | -80.26 | 30 | 168 | -36.42 | 11 | 45.75 |
| Broad commodities | December 31, 1990 | -72.02 | 142 | -- | -34.42 | 44.5 | 10.33 |
| Gold | December 31, 1990 | -43.39 | 52 | 55 | -30.88 | 32.5 | 32.5 |
Source: FactSet, Bloomberg Finance, L.P., as of November 13, 2025. Past performance is not a reliable indicator of future performance.
BTC behaves most like equities, but less so than right after COVID
BTC’s correlation to traditional assets started low in our sample period, with most measures of two-year weekly return correlation below 0.1, although this jumped into the COVID pandemic with correlations to equity remaining elevated through 2022-2023. S&P 500 (SPX)-BTC correlation has also picked up from the start of 2025.
Although absolute levels of correlations have dropped across the board, BTC remains most correlated with stocks. However, even during the sharp interest rate hikes in 2022–2023, BTC’s correlation with stocks stayed lower than the correlation between US stocks and US bonds (both nominal and inflation-linked). That’s because both stocks and bonds were hit hard by rising rates, while BTC moved more independently.
BTC has tended to track M2 money supply, and its link to equities may be about liquidity
The COVID-19 pandemic really focused the market’s mind on the link between BTC investment and liquidity as central banks injected unprecedented amounts of liquidity into the global economy. The rapid expansion of M2 during this time coincided with one of BTC’s most explosive bull markets.
The M2 measure of money supply appeared to track BTC closely until around the start of 2024. Investors flocked to BTC as a hedge against potential inflation and currency devaluation, both of which were driven by the massive increase in money supply. Since the start of 2024 this correlation seems to have broken down, which might be due to the increased presence of institutional investors after the BTC ETF launch.
What’s BTC worth? Ways to value BTC
The lack of a widely accepted intrinsic valuation model has been a barrier to institutional investors, but there are various approaches to estimating BTC’s value. Each approach offers a different lens—some grounded in supply mechanics like stock-to-flow or BTC-specific features like “halving.” Others are rooted in user adoption, sentiment, or energy expenditure.
Valuing BTC as a commodity
Some investors see BTC as having a commodity-like scarcity and potentially inflation-resistant profile. BTC is often referred to as digital gold—a label that stems from its structural similarities with precious metals. The steady and finite issuance of new coins, embedded in its code, closely mirrors the real-world mining process of gold.
However, it also differs from traditional commodities.
Figure 11: What makes BTC like, and unlike, a commodity?
| BTC’s commodity-like features | What makes BTC less like a commodity |
|---|---|
|
|
Source: State Street Investment Management.
BTC isn’t a traditional commodity, but it can be valued like one using the stock-to-flow (S2F) ratio, which measures scarcity. With a current S2F ratio more than 90,11 higher than gold, BTC’s predictable declining supply boosts its appeal as a long-term store of value.
Halving and cost of production: A supply-side framework for BTC valuation
There are some key features BTC investors can use to take a supply-side valuation approach.
- Programmable scarcity through halvings
A core feature of BTC’s design is its preprogrammed scarcity. To enforce this scarcity, every 210,000 blocks—approximately once every four years—the BTC network undergoes a halving event that cuts the block reward in half. BTC’s built-in scarcity encourages miners to support long-term price growth, helping the asset stay resilient during market downturns.
This systematic reduction decelerates the rate of new BTC issuance and mirrors commodity scarcity, similar to mining a finite resource like gold. As supply growth slows and assuming demand remains stable or increases, its price tends to rise in response to reduced availability.
- Cost of production
The cost of production model suggests that the floor value of BTC is tied to the cost miners incur to create it primarily driven by electricity costs and computational intensity. The New Liberty Standard, one of the first BTC pricing models, framed it simply: BTC price = Annual electricity cost divided by BTC mined over the same period. As more miners enter the network and the difficulty adjustment algorithm increases mining complexity, production costs surge.
Figure 13: Key variables that determine cost of production
| Hash rate | Electricity cost |
|---|---|
| Represents the total computational power securing the BTC network. As the hash rate increases, mining becomes more competitive, requiring more energy to solve the cryptographic puzzles necessary to earn rewards | Mining is highly sensitive to regional energy prices. BTC miners tend to cluster in areas with abundant, low-cost electricity—such as hydro-rich regions of China (historically), Iceland, or the US Midwest |
Source: State Street Investment Management.
These inputs serve as a dynamic floor for price. When market prices fall below the cost of production, miners operate at a loss, and less efficient participants exit the network. This self-regulating mechanism reduces hash rate, lowers mining difficulty, and eventually balances supply pressure.
Anecdotally, miners have become more sophisticated with their energy supply strategies.
Did you know?
Miners have started working out of countries like Bhutan and Ethiopia that have high availability of renewable energy. Miners in these two countries can compete on cost with renewable energy despite using older machines (many import old machines from China and the US).
As halvings reduce the number of BTC earned per block, the cost per coin increases unless offset by higher BTC prices or greater operational efficiency.
Network effects: Belief, value, and the self-reinforcing dynamics of adoption
One of BTC’s most powerful and misunderstood value drivers is its network effect. Unlike traditional assets whose value may derive from cash flows or physical utility, BTC’s value is significantly shaped by the size and strength of its user base. In decentralized systems, value grows not linearly but exponentially with adoption: the more participants in the network, the more useful—and valuable—it becomes to each individual user.
This dynamic, often modelled by Metcalfe’s Law,12 states that the value of a network is roughly proportional to the square of the number of its users. For BTC, this means that every new participant increases the utility and credibility of the asset for all others—whether a holder, transactor, miner, or developer. This makes BTC reflexive: rising prices attract more attention and users, which further validates the network and pushes prices higher.
Total addressable market (TAM) approach
The TAM approach estimates BTC’s potential value by comparing it to the size of markets it could disrupt or complement. This method assumes BTC can capture a share of existing stores of value or monetary systems. Key markets often considered include:
- Gold as a store of value
Gold’s market capitalization is estimated at $29 trillion globally.13 If BTC were to capture as much as 10% of gold’s market, its implied valuation could exceed $130,000 per BTC, assuming a fixed supply of 21 million coins. - Global M2 money supply
M2 represents liquid money in the economy—cash, checking deposits, and easily convertible near money. Global M2 is estimated at $100 trillion. If BTC captured 5% of global M2, its price could approach $240,000 per BTC.
This approach highlights BTC’s asymmetric upside: even modest penetration into these markets could drive significant price appreciation. However, TAM-based valuation is speculative and assumes:
- Regulatory frameworks allow broader adoption
- Institutional infrastructure supports large-scale investment
- BTC maintains its scarcity and security features
Why TAM matters for institutions
It provides a strategic lens for long-term positioning. Institutions often use TAM analysis to justify small allocations today, anticipating potential future adoption curves similar to other disruptive technologies.
Portfolio construction with BTC: How much should you hold?
BTC’s volatility tends to be higher than other assets, but its risk and return profile can be favorable for certain portfolio allocations from the diversification benefits it offers due to historically low correlations with traditional assets like equities and bonds. Consider these approaches to determine how much you should hold.
Looking back: BTC historical returns and Sharpe ratio improvement
BTC’s historical performance has delivered outsized returns that would have meaningfully improved portfolio efficiency if included in small doses. Its low correlation with traditional assets like equities and bonds has made it a powerful diversifier, especially in multi-asset portfolios. When BTC is added incrementally to a traditional 60/40 equity/bond mix, the Sharpe ratio improves significantly.
Interestingly, the most impactful improvement comes from the first 1% allocation, offering a high return boost with minimal added risk. While larger allocations continue to enhance returns, they also introduce more volatility, suggesting that a small, strategic satellite position may be BTC’s most optimal role.
Looking forward: Hurdle rate analysis for BTC inclusion
Hurdle rate analysis offers a forward-looking framework to evaluate BTC’s place in institutional portfolios. It calculates the minimum return BTC must deliver to justify its inclusion, based on its volatility and correlation with existing assets. Scenario analysis shows that BTC’s required return rises with risk and correlation, but historical data reveals that BTC has consistently exceeded even the highest hurdle rate thresholds.
Its rolling 5- and 10-year returns have outpaced the maximum hurdle rate (26.5%) more than 90% of the time.14 While future returns may moderate as BTC matures, its diversification benefits and distinct value drivers still support its inclusion in portfolios seeking long-term growth.
The risk budgeting approach to sizing your BTC allocation
Given BTC’s high volatility, a risk budgeting approach helps investors determine appropriate position sizing. This method focuses on how much risk BTC contributes to the overall portfolio rather than just its capital allocation.
Consider an investor with a moderate risk profile considering adding BTC to an existing 60/40 portfolio which consists of 60% global equities and 40% US aggregated bonds. Given BTC’s high risk profile, its allocation is funded from equities to mitigate the incremental risk to the portfolio.
We see that BTC’s contribution to the total portfolio risk increases at a faster pace than its capital allocation. For example, an allocation of more than 4% to BTC can drive over 20% of portfolio risk due to its outsized volatility.
This underscores the importance of careful sizing and frequent rebalancing to control risk contribution from BTC, especially in conservative portfolios. As BTC’s volatility trends lower over time, its risk contribution may decline, but investors must still weigh the trade-off between portfolio turnover and risk control.
How institutions can invest in BTC
Institutional investors thinking about BTC have two main options: buy it directly or invest through regulated financial products. Each choice comes with its own pros and cons—like how it's stored, how it's regulated, how complex it is to manage, and how flexible the investment can be.
Direct access via digital wallets
Direct access involves the purchase and holding of BTC through digital wallets, where investors control the private keys associated with their holdings. This method offers direct exposure to the underlying asset and avoids management fees associated with intermediary products. However, direct access introduces custody risks and operation burdens for institutional investors.
Access through ETPs, like ETFs
The approval of spot BTC ETFs in the US in January 2024 represents a significant development for institutional access to BTC through a familiar investment vehicle. ETFs may offer mitigated custody risk, familiarity, and regulatory comfort. But institutions should be mindful of tracking error, management fees, and counterparty risk.
Futures
BTC futures contracts traded on the CME were launched in December 2017 and provide an avenue for institutional investors to gain derivative exposure to BTC, allowing investors to speculate on the future price of BTC without directly holding the underlying asset. Some advantages to futures is that they are regulated, can allow for leveraged exposure to potentially amplify gains (but losses will also be amplified), and they can be used to hedge BTC exposure. But keep in mind basis risk and the cost of carry and roll.
Embracing BTC as an institutional asset
BTC’s journey from frontier to foundation is far from over. What began as shiny but empty has grown into a bustling town—complete with infrastructure, governance, and a growing population of institutional settlers. With regulatory clarity improving, access vehicles expanding, and adoption accelerating, BTC is no longer just a speculative detour—it’s becoming part of the main road.
Its fixed supply and inflation-resistant design offer resilience in uncertain times, and even modest allocations have shown potential to enhance portfolio returns. As the global landscape shifts and investors seek new ways to navigate volatility, BTC may prove to be not just a frontier asset—but a cornerstone in the next era of portfolio construction.