Improving fixed income portfolio resilience with leveraged loans
In this piece, we discuss key considerations for investors allocating to leveraged loans, and explain how loans can serve as powerful diversifiers to most other fixed income sectors. We include assessments of recent performance and current loan fundamentals, as well as strategic asset allocation considerations.
Why Leveraged Loans?
Due primarily to the high income that can be earned in US leveraged loan investing, the asset class has delivered strong and consistent returns over most trailing time horizons. However, for fixed income investors, how these returns were generated is just as important as the level of return. The high income in loans can help to provide a cushion against default risk in the market (a similar dynamic to high-yield bonds and private credit). In addition, leveraged loans can exhibit diversifying properties relative to most other fixed income sectors—particularly in inflationary environments—and provide better liquidity than private credit, another popular diversifier.
Attractive yields underpin the margin of safety in loans
As of the end of June 2025, most leveraged loan indices, including the Morningstar LSTA US Leveraged Loans 100 Index, offer a yield that is near the 70th percentile of the past 10-year period. Notably, the excess yield offered by the loan index versus US high yield bonds remains well above the 10-year average (Figure 1).
Similarly, the yield differential between private credit and loans has narrowed considerably over past couple of years in favor of loans (Figure 2). The significant growth in private credit, along with the competition for deals, has reduced the yield premium between private credit and loans.
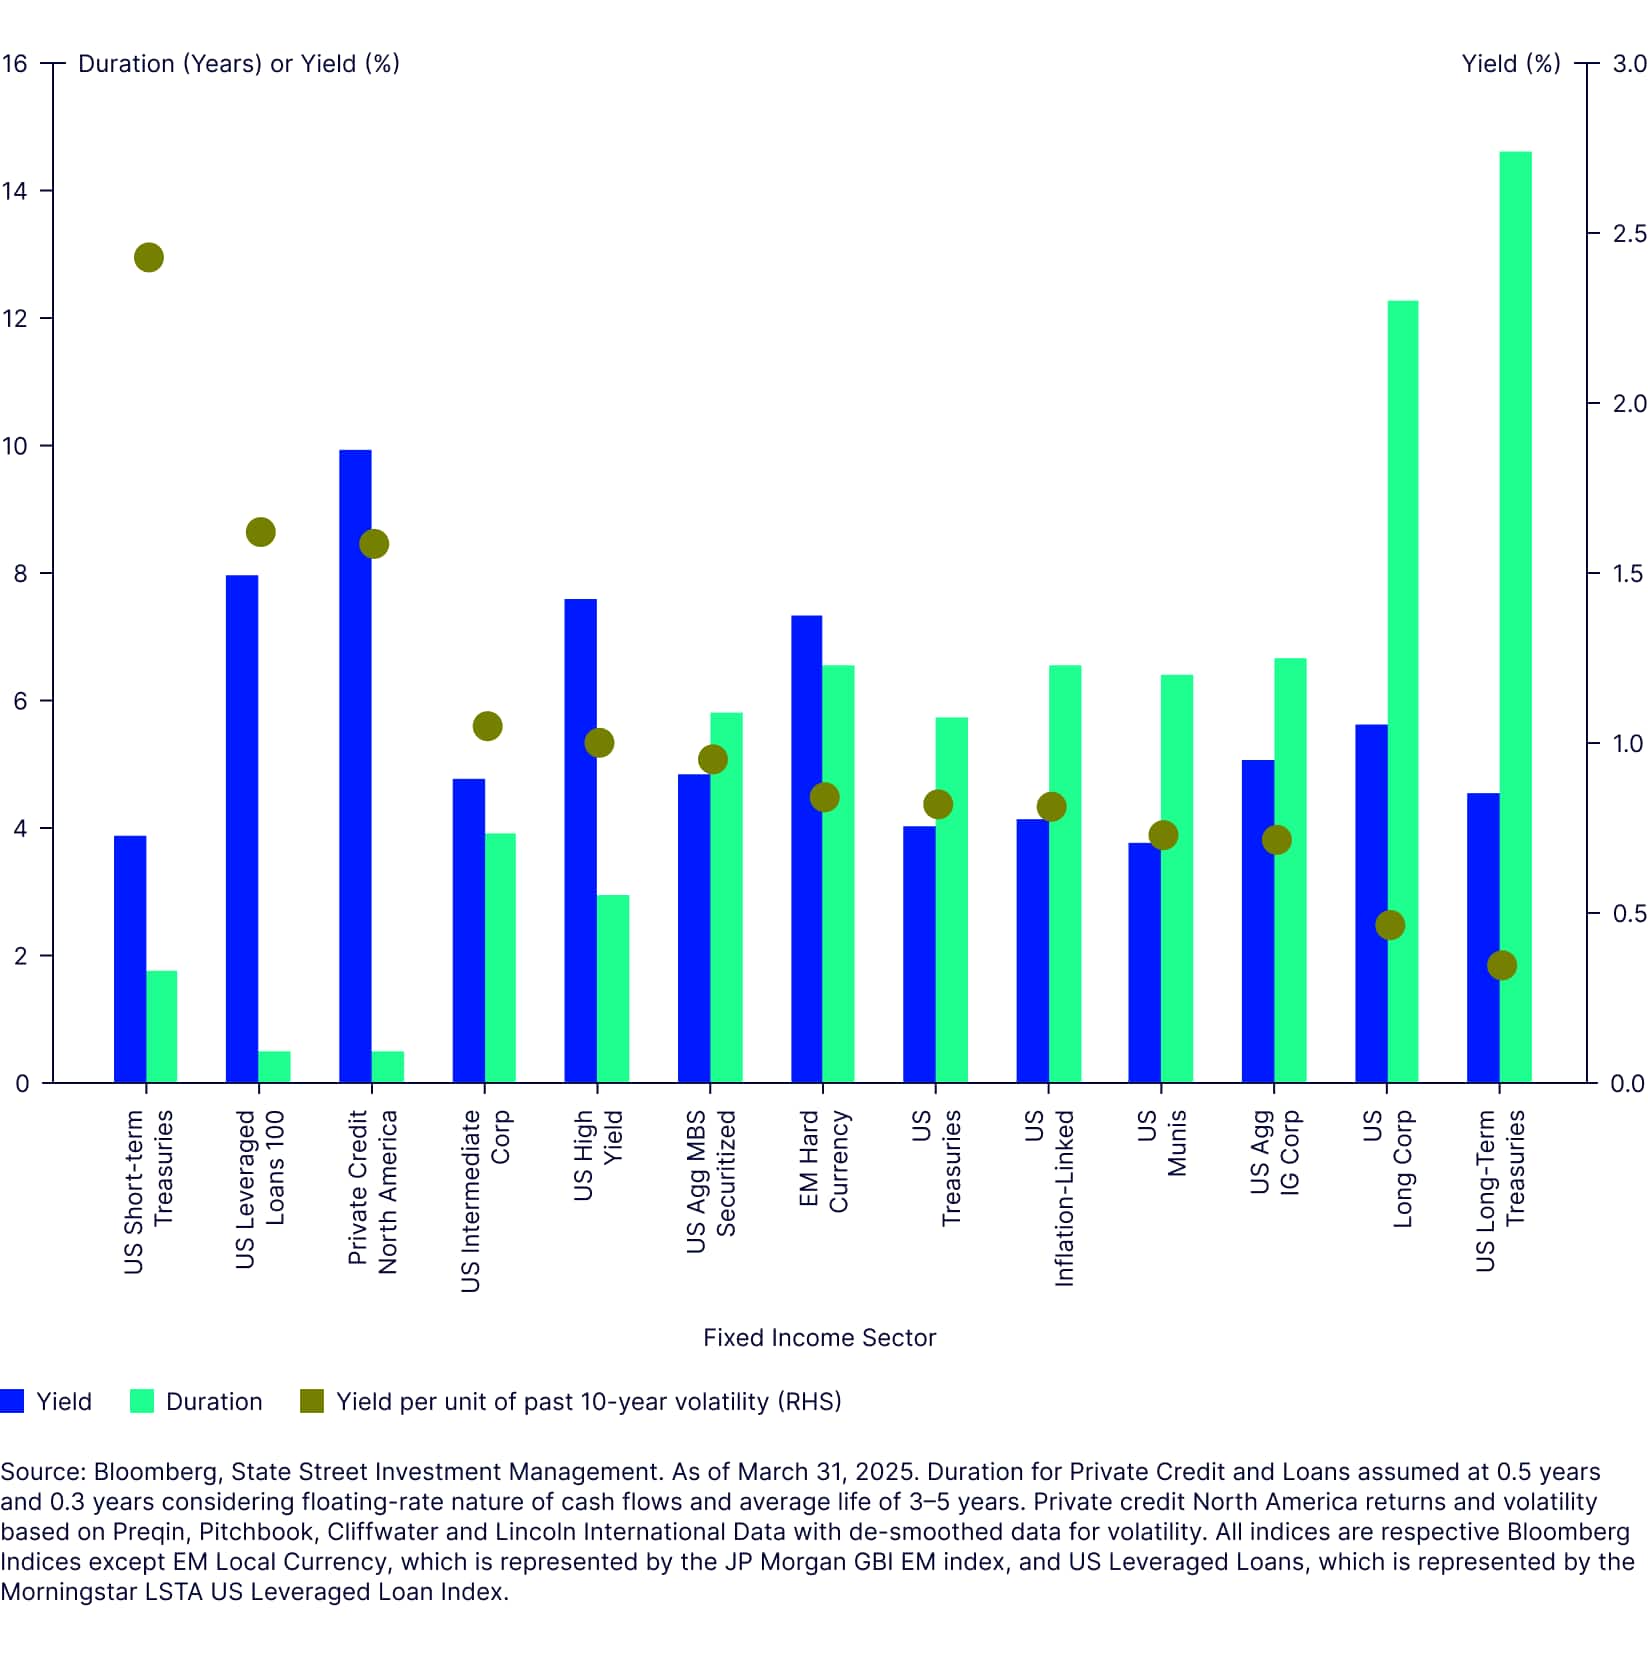
With loans' very low effective duration (and therefore low interest rate sensitivity), the yield per unit of volatility in loans remains among the highest in the US fixed income spectrum, and is also very competitive with the comparable figures for private credit (Figure 3).
Figure 3: Leveraged loans offer attractive yield per unit of volatility
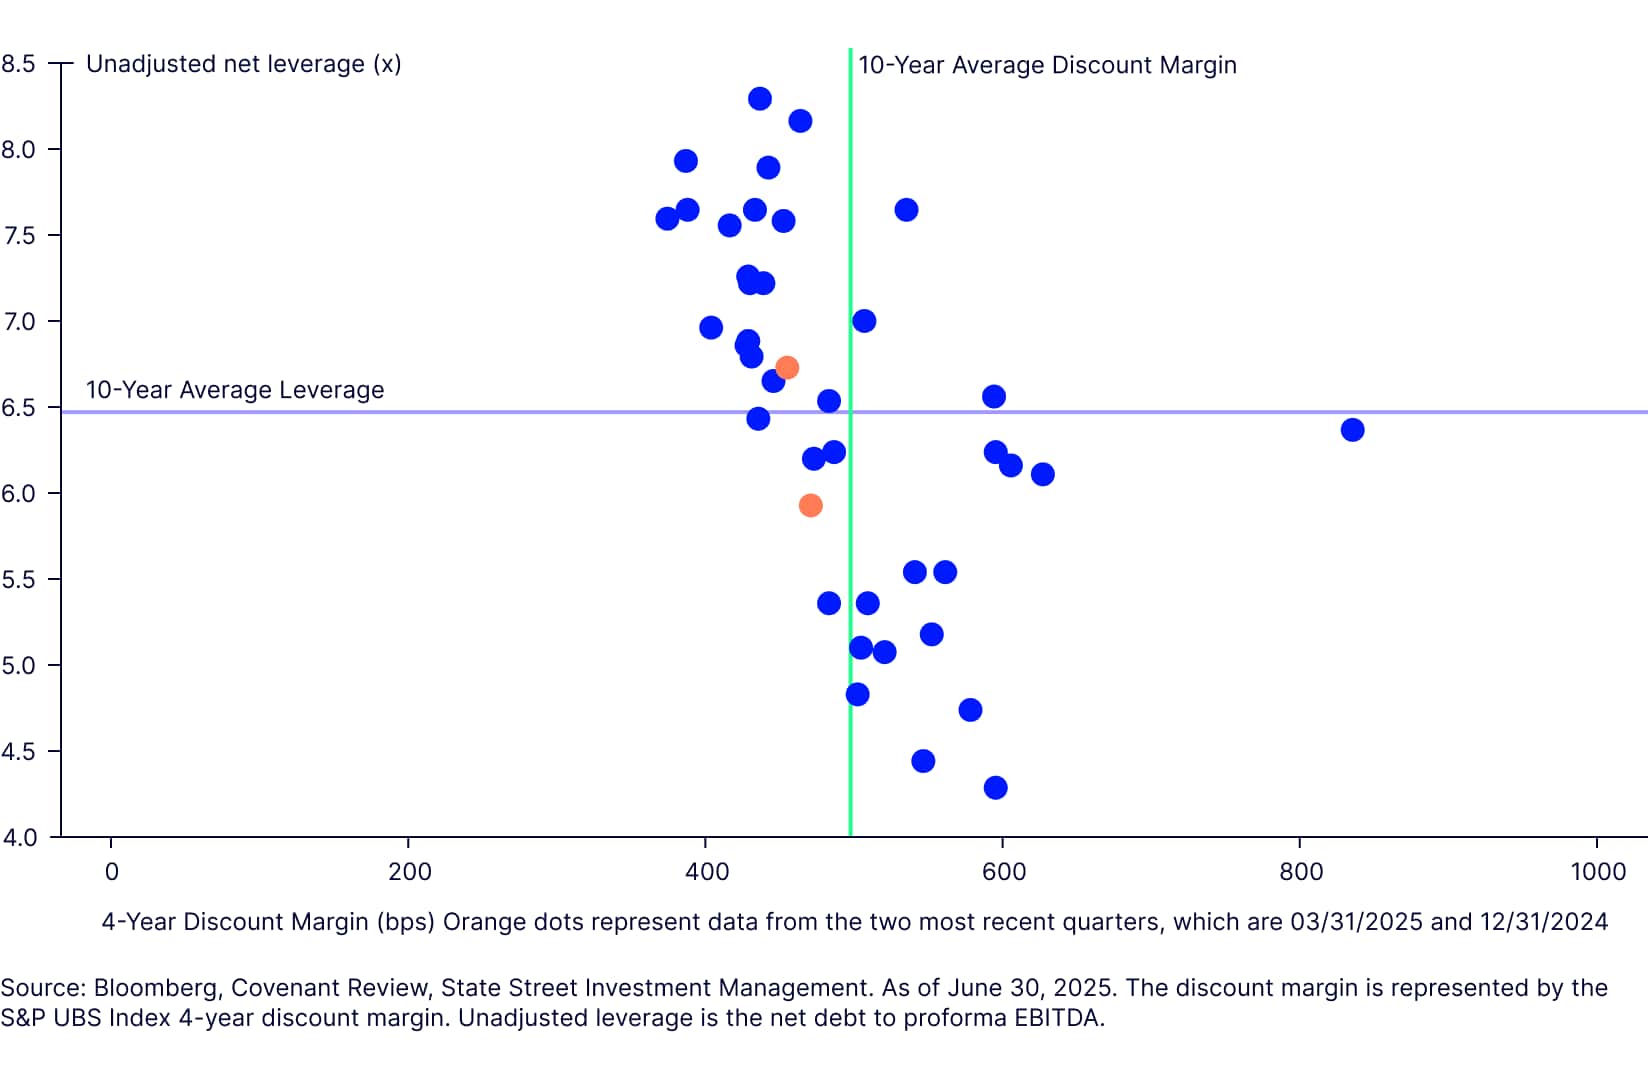
Further, Figure 4 illustrates how market risk premiums compare to fundamentals. The risk premium in loans (as measured by the four-year discount margin) has been slightly below 10-year median levels over the past two quarters (orange dots), while unadjusted leverage (for new issues) has stayed near median levels. This suggests that loans are reasonably priced compared to their history.
Figure 4: Current loan pricing is appropriate for leverage levels
Explaining loans’ yield advantage
The yield premium for loans over high-yield bonds may be somewhat surprising given that loans are typically senior to bonds in the capital structure, and are often secured (tied to a specific asset). In our view, this premium can be explained by the higher operational hurdles to investing in loans, which include longer settlement periods and unique documentation. In addition, loans have experienced a modestly higher default rate over the last few years as a fall-out of higher rates, and loan supply has continued to grow.1
Adjusting for quality, the spread differentials between BB and B-rated high-yield bonds versus loans also shows a higher credit risk premium being priced into loans compared to the historical average (Figure 5). Differentials are wider across both BB and B-rated loans, reflecting recent headwinds in the loans market (such as higher defaults and increased supply), as well as investor concerns about a pause in the Fed rate cutting cycle. Fed hawkishness could prevent issuers’ funding costs from declining much further, thus adding to headwinds for lower-rated issuers to meet debt service payments.
Loan fundamentals remain intact
From a fundamental perspective, net leverage in new loan issuances as measured by net debt to unadjusted pro-forma EBITDA, remains below the ten-year average, as of Q1 2025. This is true despite a rise in net leverage in 2024.2
Net leverage remained elevated (7.0-8.0x) just prior to COVID-19, though we saw a significant de-leveraging trend after the pandemic in 2022 and 2023. While net leverage has increased since, as of Q2 2025, overall levels continue to be near the 10-year average.3
The addition of loans in a portfolio context
For fixed income investors, incorporating loans into their portfolios can offer powerful diversification opportunities.
Given their low interest rate sensitivity, leveraged loans have a lower correlation with the US Agg than that of high-yield credit, making loans potentially better diversifiers to the Agg than high yield (Figure 6).
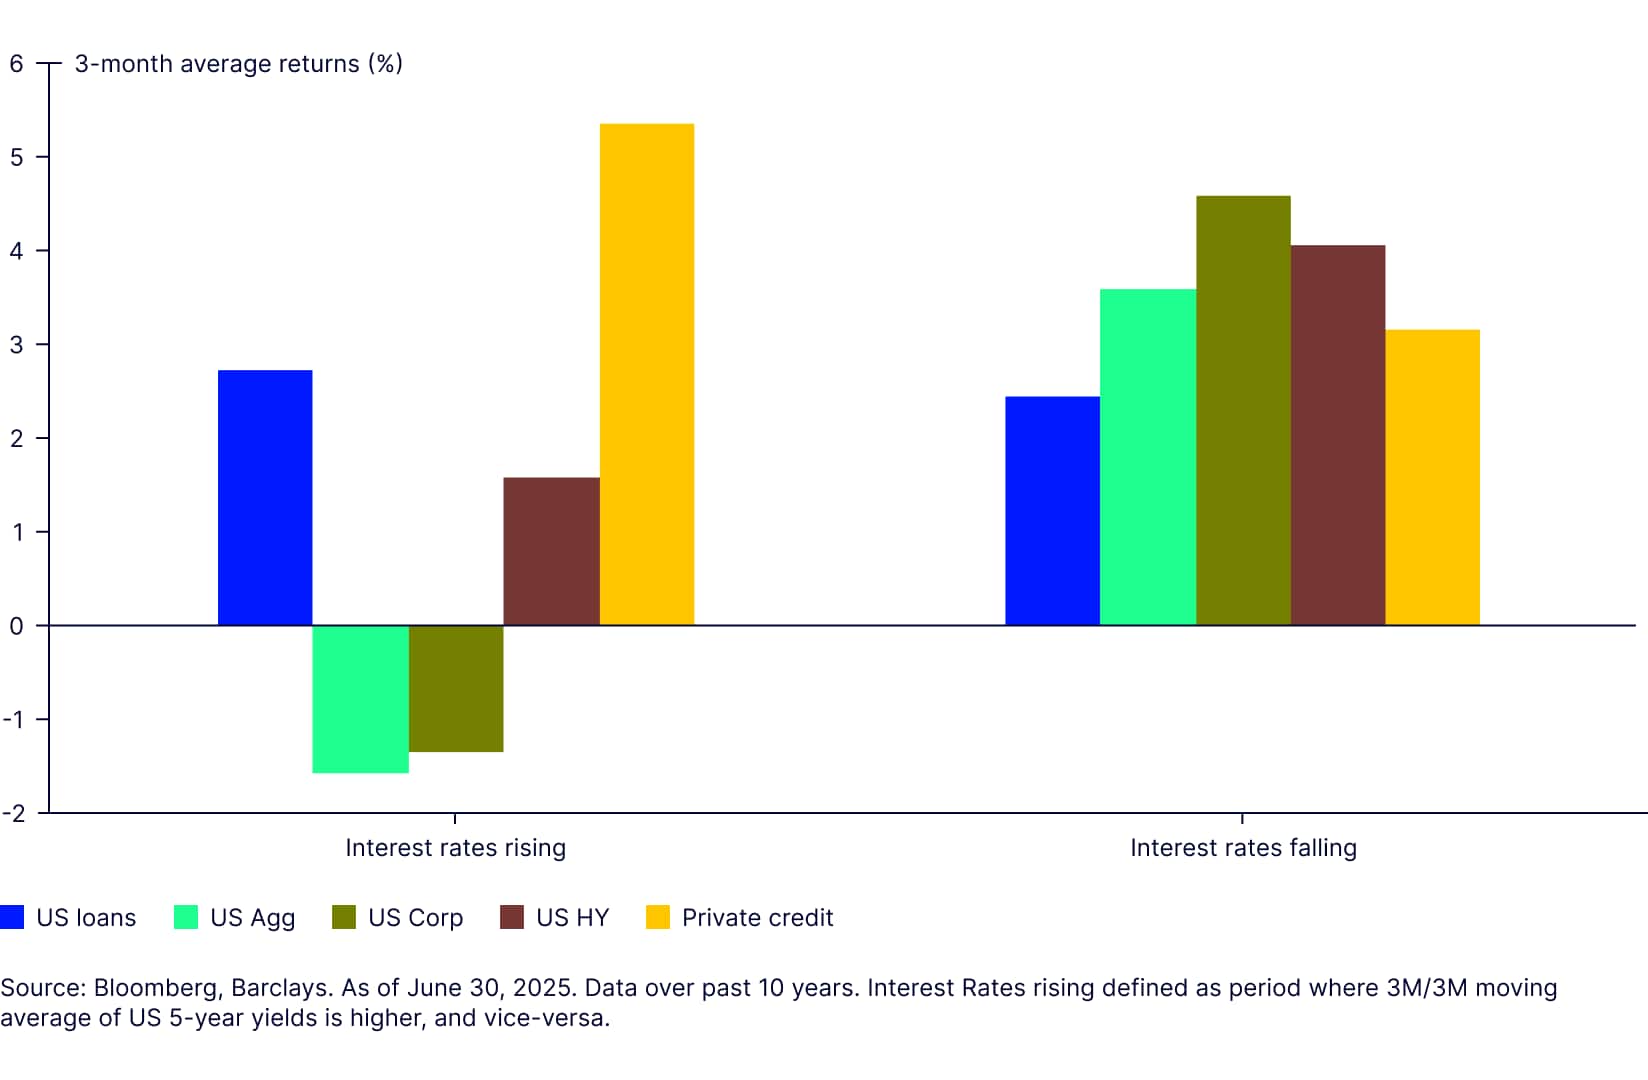
The diversification quality of loans has been shown to hold up in various market cycles. Figure 7 shows loans delivering a positive return in a rising interest rate environment, similar to private credit, thus diversifying the duration of traditional fixed income. Loans’ low interest rate sensitivity may be particularly attractive as interest volatility increases.
Figure 7: Loans have exhibited diversifying properties amid both rising and falling rate environments
These asset class relationships suggest that investors can benefit from allocating to a combination of high-yield bonds, loans, and private credit to improve diversification within the sub-investment grade asset class space, and to build more portfolio resilience. Moreover, investors can use relatively better liquidity in loans to adjust their capital calls in private credit markets, thereby increasing efficiency in asset allocations.
Diversification in inflationary periods
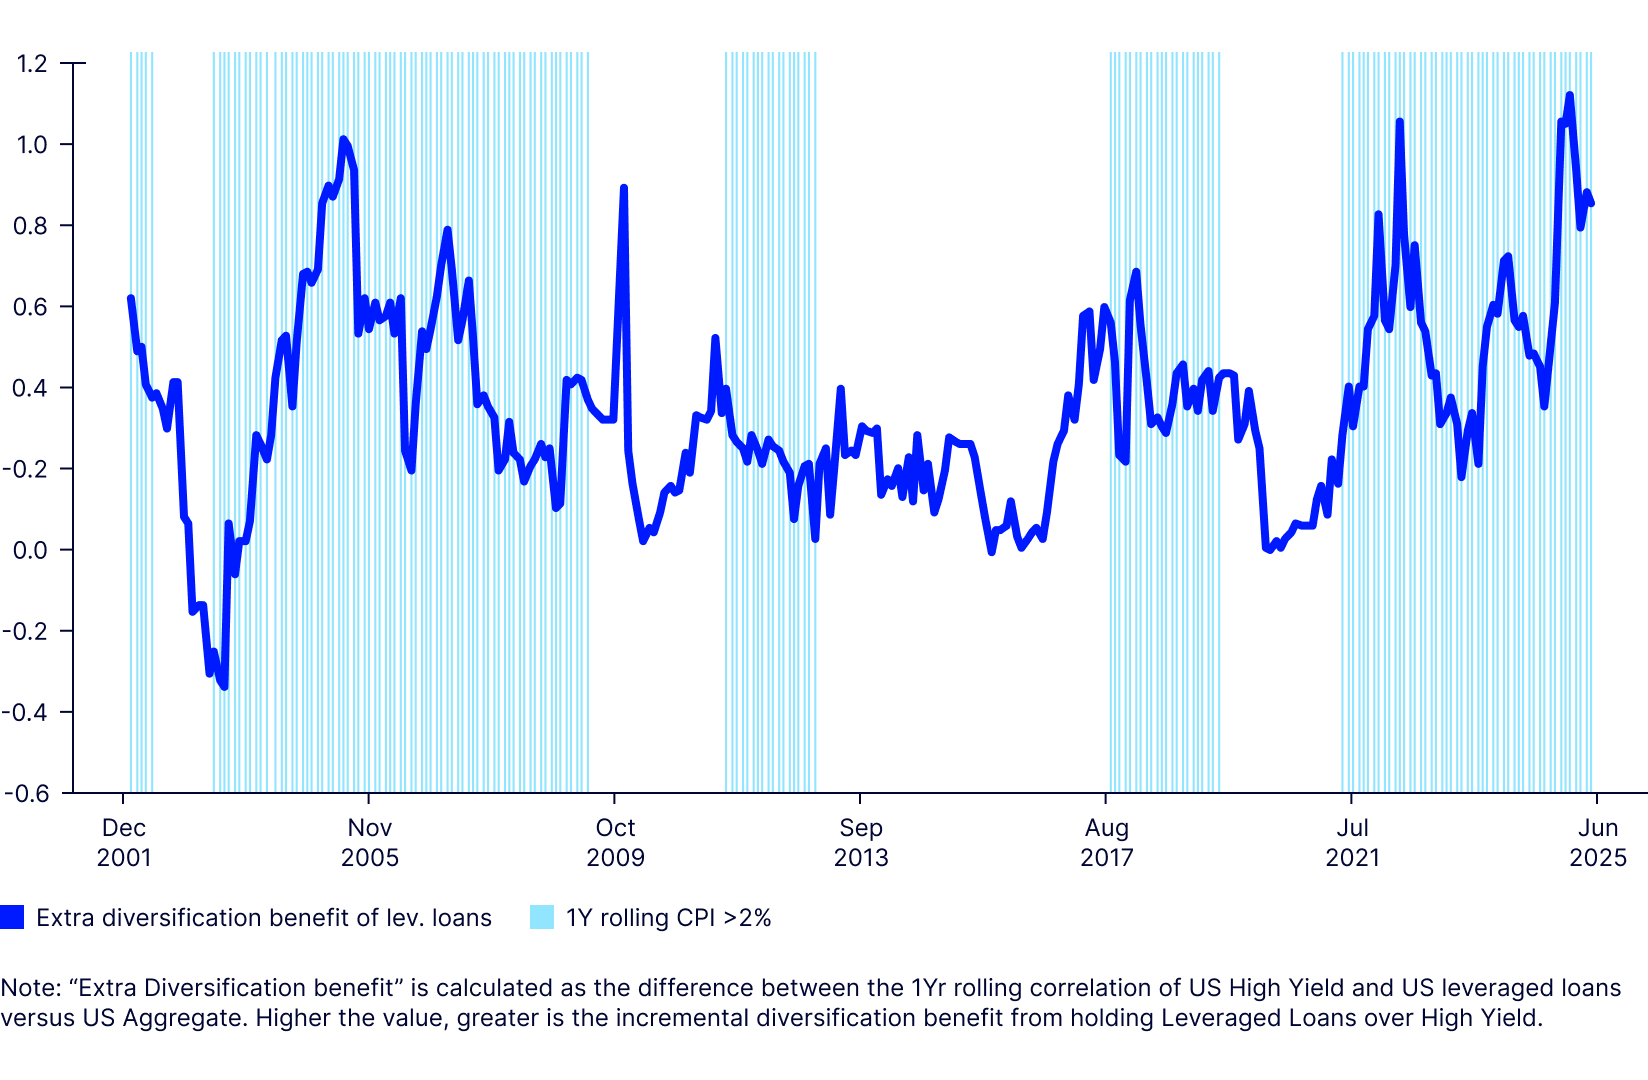
The additional diversification benefit that loans can offer over high yield tends to be higher when inflation is elevated; i.e. loans have delivered diversification when it mattered most for fixed income investors (Figure 8). This makes loans even more attractive because generally during periods of high inflation, correlation between different asset classes (e.g. equities and bonds, investment grade and high yield debt) tends to go up. Therefore, adding leveraged loans to your fixed income allocation can be particularly valuable when inflation risk is higher.
Figure 8: Leveraged Loans offer a higher diversification benefit, especially when inflation is above target
Strategic benefits
From a strategic asset allocation (SAA) perspective, leveraged loans sit between the US Aggregate and US high-yield indexes in terms of their risk-return profile, providing higher returns than investment grade credit at a comparable risk level (Figures 9 and 10). Historically, leveraged loans have offered higher risk-adjusted returns compared to both investment grade, high-yield credit, and US Treasuries.
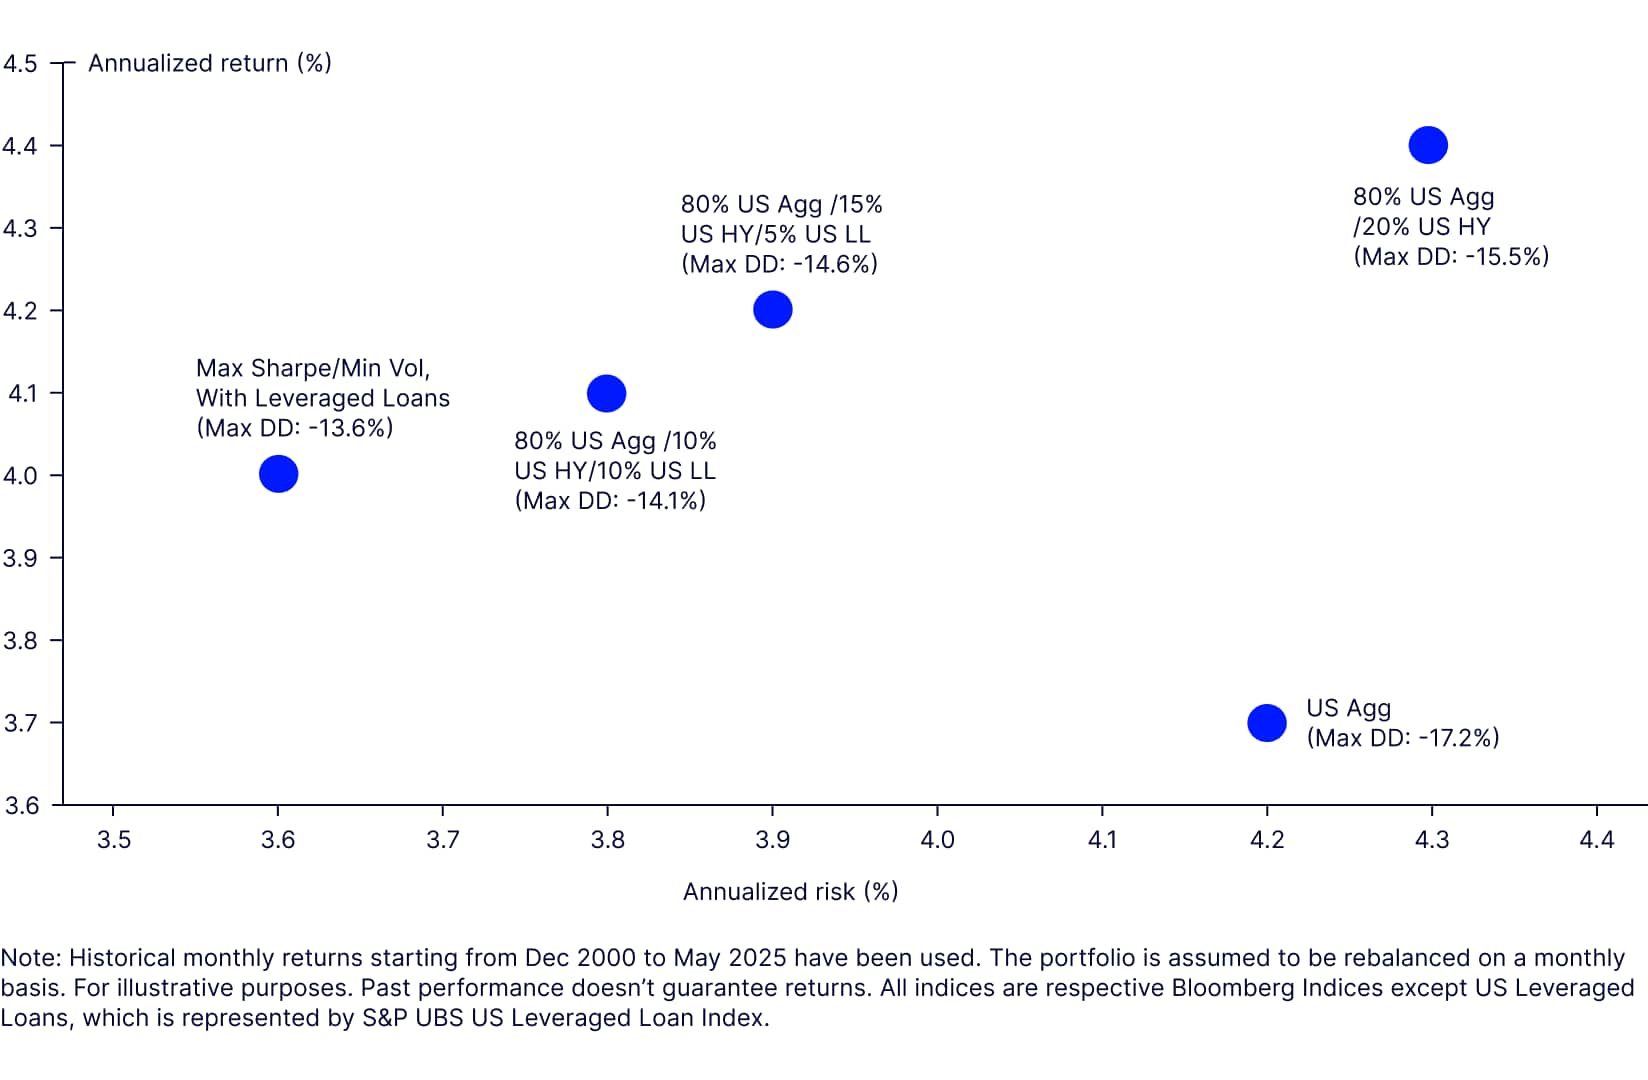
Even a modest allocation of 5-10% to leveraged loans would have improved a hypothetical portfolio’s risk-adjusted returns while reducing drawdowns, as shown in Figure 11.
Figure 9: Historical performance, December 2000 through May 2025
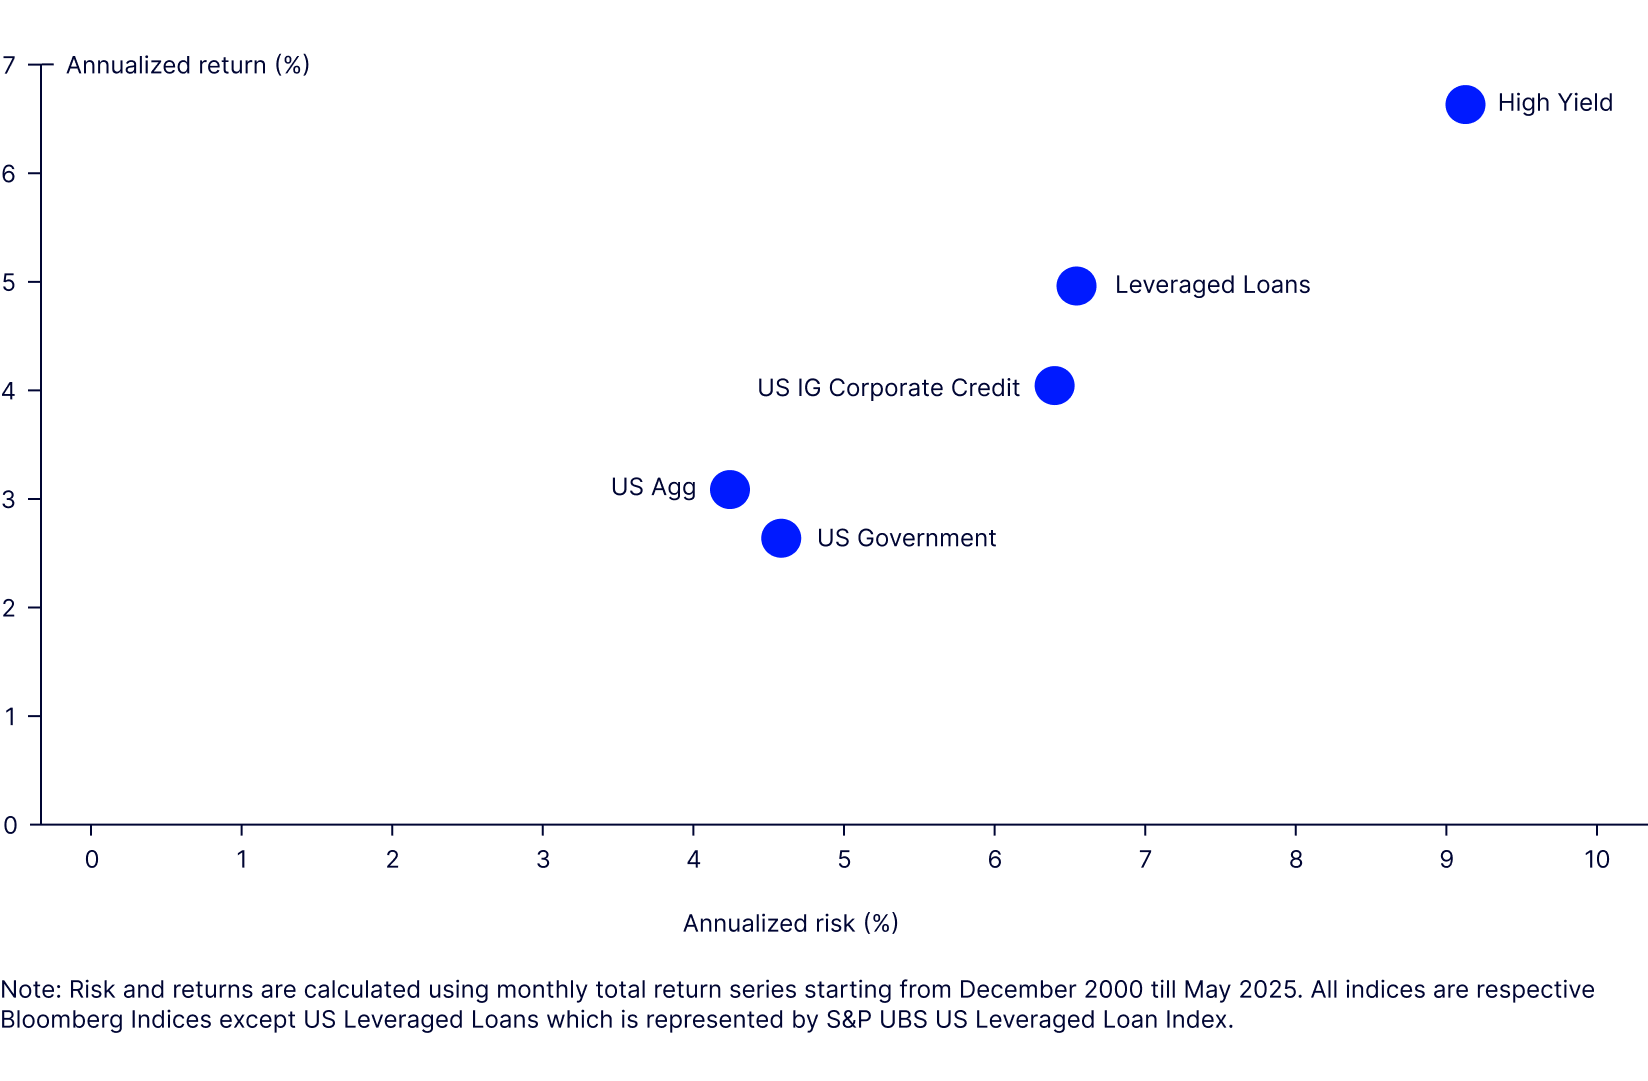
Figure 10: Historical performance for 10 Years Ending May 2025
Last 10 Yr | ||||
|---|---|---|---|---|
| Return (%) | Risk (%) | Return/Risk | Drawdown |
US Aggregate | 1.8% | 5.0% | 0.35 | -17.2% |
US High Yield | 5.4% | 7.5% | 0.72 | -14.7% |
US Leveraged Loans | 5.1% | 5.4% | 0.96 | -13.6% |
80% US Agg /20% US HY | 2.5% | 4.9% | 0.51 | -15.5% |
Max Sharpe - W/O US LL | 2.3% | 4.9% | 0.47 | -15.8% |
Min Vol. - W/O US LL | 2.2% | 4.9% | 0.44 | -16.1% |
80% US Agg /15% US HY/5% US LL | 2.5% | 4.6% | 0.54 | -14.6% |
80% US Agg /10% US HY/10% US LL | 2.5% | 4.4% | 0.56 | -14.1% |
Max Sharpe/Min Vol - With Leveraged Loans | 2.5% | 4.3% | 0.58 | -13.6% |
Past performance doesn’t guarantee returns. All indices are respective Bloomberg Indices except US Leveraged Loans, which is represented by S&P UBS US Leveraged Loan Index.
Figure 11: Hypothetical risk-adjusted returns for various loan allocations
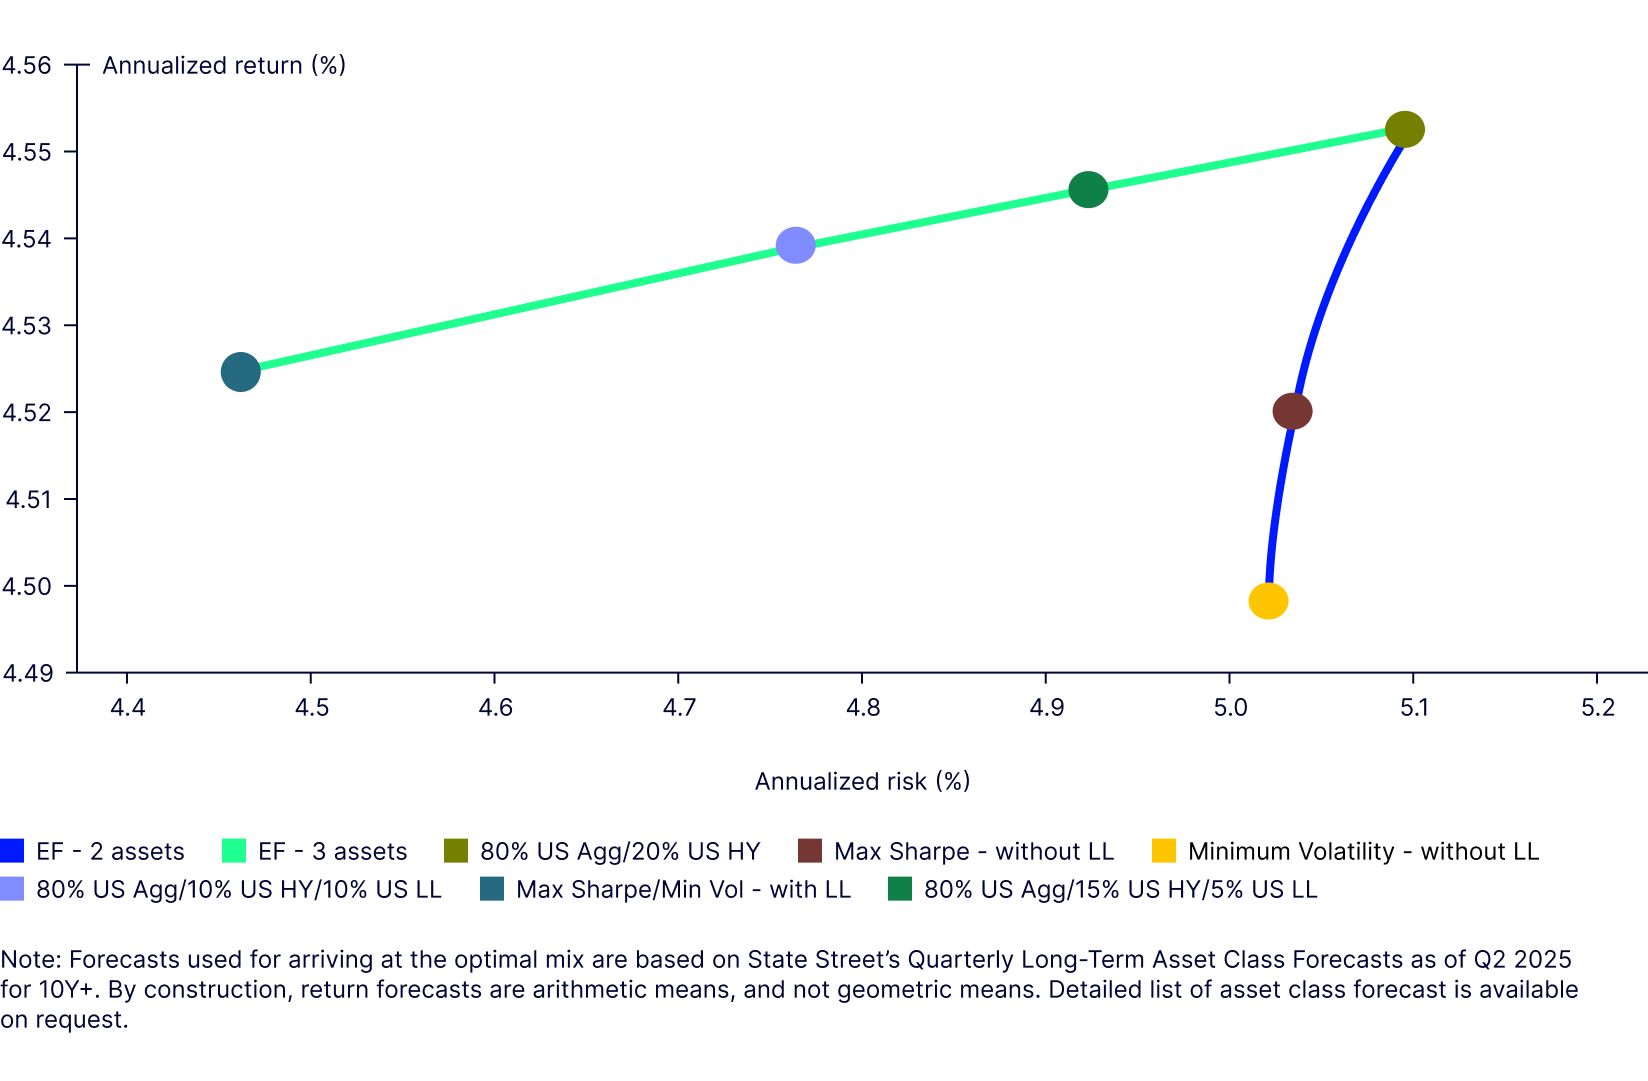
Finally, to demonstrate the potential utility of leveraged loans as a strategic asset class, we have constructed frontiers using State Street’s Long-Term Asset Class Forecasts as of Q2 2025. We observe that inclusion of leveraged loans in a simplistic fixed income portfolio pushes the efficient frontier higher (Figures 12a and 12b).
Figure 12: Leveraged loans can improve a portfolio’s overall risk/return profile
12a: State Street’s Long-Term Asset Class Forecasts as of Q2 2025
| Assets | Mean | SD | Sharpe Ratio |
|---|---|---|---|
| US Investment Grade | 4.44 | 5.11 | 0.87 |
| US High Yield | 5.01 | 9.55 | 0.52 |
| US Leveraged Loans | 4.87 | 7.84 | 0.62 |
| Correlation | |||
| US Investment Grade | US High Yield | US Leveraged Loans | |
| US Investment Grade | 1.00 | - | - |
| US High Yield | 0.36 | 1.00 | - |
| US Leveraged Loans | 0.06 | 0.83 | 1.00 |
Source: State Street Investment Management Investment Solutions Group as of 03/31/2025. Forecasted returns are based upon estimates and reflect subjective judgements and assumptions. These results were achieved by means of a mathematical formula and do not reflect the effect of unforeseen economic and market factors on decision-making. The forecasted returns are not necessarily indicative of future performance, which could differ substantially.
12b: Efficient Frontier
Learn more about leveraged loans
Investors can benefit from including US leveraged loans in their fixed income portfolios due to the attractive risk-adjusted returns and diversification benefits of the asset class. For investors who are concerned about inflation risks, loans can help make their fixed income portfolios more resilient without materially sacrificing returns.
Despite the lower absolute returns compared to high yield credit, the added diversification benefit and superior risk-adjusted returns offered by leveraged loans can help investors improve their portfolio’s risk-adjusted returns and resilience across different macro regimes/business cycles.