From turbulence to soft landing? Allocating to US equities beyond the Mag-7
US equities renewed momentum after weathering the tariff-induced storm earlier in the year is reflected in flows, earnings and investor sentiment. Allocating within the US still requires investors to consider a dynamic macro environment, policy risks, valuations and the earnings growth potential of specific strategies. Following NVIDIA’s underwhelming results, we see merit in searching for US equity opportunities beyond the Magnificent 7.
The return of US exceptionalism?
The economic environment carries risks but is increasingly supportive for US equities, thanks to brighter fiscal and monetary prospects, and lower trade-related uncertainty. The economy has slowed but is likely to accelerate later in 2025, and into 2026. The trade-deficit driven 0.5% contraction in the first quarter largely reversed in Q2, with growth rebounding to 3.3%. From here, the US GDP growth is projected to once again outpace most of the developed world. State Street Investment Management economists forecast 1.7% growth this year and 2.3% for 2026. On the fiscal front, “The One Big Beautiful Bill” and ongoing deregulation are likely to bolster consumption and private investments. But the US growth advantage is structural, underpinned by innovation, which enables businesses to capitalize on megatrends such as AI and the broader technology boom. The labour market shows signs of softening but has demonstrated remarkable resilience in the face of trade uncertainty and restrictive monetary policy. Interest rates are likely to be cut by 25 basis points (bps) in September with room for additional cuts later this year and next.
In short, an improved backdrop and diminished uncertainty make a soft landing our central scenario. However, 2025 has demonstrated that shifts in Trump-era policies can dramatically and abruptly alter the investment landscape. Furthermore, the U.S. economy still faces two-sided risks: tariff rates may slow growth and boost inflation, with supply chain effects expected to crystallize in the coming months. Investors must consider multiple scenarios when making allocation decisions.
Performance: three quarters, three stories
US equity performance in 2025 illustrates how specific strategies can align with different market environments. In the first quarter, stagflation concerns, driven by tariff proposals, led to declines in broad large- and small-cap exposures. US Dividend Aristocrats delivered a positive 3% return, echoing patterns observed in 2022. The second quarter, despite its dramatic Liberation Day start, delivered outperformance from the S&P Quality Aristocrats, largely due to their overweight Tech exposure. So far in the third quarter, rate- and sentiment-sensitive small caps have benefited, as investors turned more bullish amid easing uncertainty and rising expectations of a Federal Reserve (Fed) rate cut in September.
Positioning US equity exposure for divergent economic outcomes
As we move through the second half of the year, growth remains relatively robust, and the Fed is likely to cut rates. In the absence of negative shocks to inflation or growth, domestic US small- and mid-cap equities may benefit most, given undemanding valuations and significant catch-up potential. US Quality Aristocrats’ strong-free-cash flow (FCF) margins offer protection against economic slowdown and may appeal to investors if the labour market continues to soften and growth weakens. Dividend Aristocrats may serve investors if tariffs or other factors reignite stagflation concerns.
Fig 3: suggested positioning
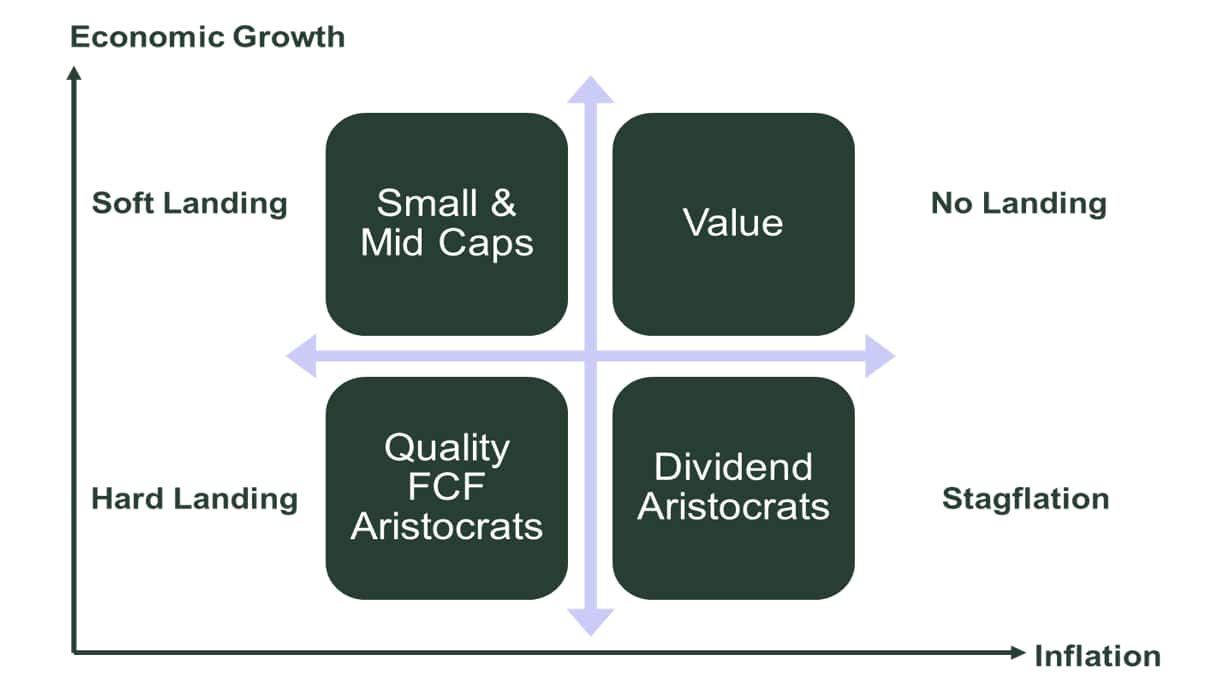
For illustrative purposes only
Scenario 1: US small and mid caps for a brightened outlook
Despite their more domestic profiles, US small and mid caps underperformed large cap equities in H1 as trade disputes raised concerns about growth and inflation. As the economy held up and rate cuts came into view, small caps began to outperform in Q3. We believe that small and mid cap equity outperformance requires more than one cut by the end of the year. A “hawkish cut” in September could derail performance.
However, if the Fed is not too hawkish in its actions or its tone, then the deregulation and fiscal tailwinds which emerge in form of tax cuts and incentives for investments within the US are likely to disproportionately benefit more domestically oriented small caps. Indeed, companies within the Russell 2000, the MSCI USA Small Cap Value Weighted and the S&P Mid Cap 400 Index generate between 75% to 84%1 of their revenues domestically.
The sector composition of small- and mid- cap indices is largely cyclical, with an overweight towards Financials, Industrials, Real Estate and Materials - another reason why small caps benefit from a balanced economic environment. All three exposures are cyclical, but each of them is unique:
- The S&P MidCap 400 Index constituents tend to demonstrate higher quality, due to relatively higher size and S&P Dow Jones Indices’ profitability requirements. Industrials is the largest sector and may benefit from US administration incentives for domestic investment.
- The Russell 2000 Index is perhaps the most unconstrainted small-cap index allowing to embrace the innovative nature of the US economy to the greatest extent. Companies in the index are often in earlier stages of development, including biotech and software areas leading to significant share of companies with negative earnings. This leads to higher volatility but also the potential for greater upside, which we have observed so far in Q3.
- The MSCI USA Small Cap Value Weighted Index not only provides the strongest value tilt but is heavily skewed towards Financials, which represent 23% of the index. The sector may benefit from deregulation, and a combination of consumer resilience and relatively high interest rates.
Elevated valuations is a key challenge investors face when allocating to large caps . In contrast, US small and mid caps allow for more direct access to a potentially reaccelerating US economy and trade at relatively undemanding price to earnings multiples.
How to play small & mid caps:
Scenario 2: US Quality Free Cash Flow (FCF) Aristocrats for falling growth and persisting uncertainty
Trade deals with most countries have been reached, but conditions and details remain subject to change. Even though tariff rates are largely known, the impact on U.S. companies’ supply chains and U.S. consumer demand will crystallize over the coming months. Trade barriers have the potential to further hamper growth, contribute to labour market softening, and lead to prolonged market volatility.
In response to such an outcome, investors may lean toward the S&P 500 Quality FCF Aristocrats Index, which includes companies with history of strong uninterrupted free-cash-flow and high return on investment capital. Consistent earnings, strong balance sheets, and low leverage are desirable features in times of economic uncertainty and market volatility.
The Quality FCF Index trades at slightly lower price-to-earnings multiples than the S&P 500, despite its overweight exposure to the technology sector and significant quality tilt.
How to play US Quality FCF Aristocrats:
Scenario 3: US Dividend Aristocrats for a stagflation slide
We expect tariffs to have a transitory impact on inflation. However, we cannot rule out a scenario in which trade barriers disrupt supply chain dynamics, leading to elevated CPI readings for several quarters. If Trump’s trade policy ultimately results in lower growth and higher inflation, then U.S. Dividend Aristocrats are likely to offer investors a defensive shelter.
The S&P High Yield Dividend Aristocrats Index’s yield-weighted approach creates a value tilt, offering some protection against inflation-related risks. Its focus on companies with long-term track records of paying regular cash dividends makes the strategy more defensive, allowing investors to de-risk their portfolios.
U.S. Dividend Aristocrats outperformed the S&P 500 Index by nearly 8% in Q1 2025 and by 17% in 2022, providing much-needed protection against stagflationary concerns. Over the past five years, Dividend Aristocrats alongside other defensive factor strategies tamed the US bear market.
How to play US Dividend Aristocrats:
Appendix – performance, sector composition and index characteristics
Figure 5: index characteristics
| Characteristics | S&P MidCap 400 Index | Russell 2000 Index (Net) | MSCI USA Small Cap Value Weighted Index | S&P 500 Quality FCF Aristocrats Index | S&P High Yield Dividend Aristocrats Index | S&P 500 Index |
|---|---|---|---|---|---|---|
| Ticker | SP400NTR Index | RU20N30U Index | M1USSVW Index | SP5QFAUN Index | SPHYDAN Index | SPTR500N Index |
| # of Holdings | 401 | 1,972 | 1,972 | 98 | 149 | 503 |
| Active Share | 100.0% | 100.0% | 59.7% | 85.2% | ||
| Index P/E Ratio (CY Est.) | 18.9x (15.4x) | 33.8x (21.5x) | 17x (12.7x) | 23.2x (20.8x) | 19x (16.5x) | 24.3x (21.6x) |
| Index P/B Ratio | 2.4x | 1.7x | 1.4x | 11.6x | 2.9x | 5x |
| Index P/S Ratio | 1.4x | 1.4x | 0.6x | 5x | 1.7x | 3.3x |
| Index Dividend Yield | 1.68% | 2.59% | 2.48% | 1.24% | 2.91% | 1.26% |
| *Market Cap. | ||||||
| Weighted Avg. ($Bn) | 11.3 | 3.9 | 6.5 | 1,158.1 | 104.3 | 1,281.3 |
| Mega Cap | 0.9% | 0.0% | 0.0% | 82.6% | 30.9% | 75.3% |
| Large Cap | 2.9% | 0.6% | 0.9% | 15.8% | 38.2% | 21.6% |
| Mid Cap | 65.2% | 9.9% | 35.4% | 1.5% | 24.9% | 3.0% |
| Small Cap | 31.0% | 89.4% | 65.1% | 0.1% | 6.0% | 0.0% |
Source: Bloomberg Finance L.P., as of 26 August 2025. This information should not be considered a recommendation to invest in a particular sector, country or to buy or sell any security shown. It is not known whether the sectors, countries or securities shown will be profitable in the future. Holdings and Characteristics are as of the date indicated, are subject to change, and should not be relied upon as current thereafter. *Market capitalisation thresholds are set at $100bn for mega cap (Mg), $20.5bn for large cap (Lg) and $7.4bn for mid cap (Md).