Long-Term Asset Class Forecasts: Q2 2023
Our longer-term asset class forecasts are forward-looking estimates of total return and risk premia, generated through a combined assessment of current valuation measures, economic growth, inflation prospects, ESG considerations, yield conditions as well as historical price patterns. We also include shorter-term return forecasts that incorporate output from our multi-factor tactical asset allocation models. Outlined below is the process we use to arrive at our return forecasts for the major asset classes.
For a copy of the latest quarterly investment commentary from the Investment Solutions Group, please reach out to your State Street representative.
Inflation
The starting point for our nominal asset class return projections is an inflation forecast. We incorporate both estimates of long-term inflation and the inflation expectations implied in current bond yields. US Treasury Inflation-Protected Securities (TIPS) provide a market observation of the real yields that are available to investors. The difference between the nominal bond yield and the real bond yield at longer maturities furnishes a marketplace assessment of long-term inflation expectations.
Cash
Our long-term forecasts for global cash returns incorporate what we view as the normal real return that investors can expect to earn over time. Historically, cash investors have earned a modest premium over inflation but we also take current and forward-looking global central bank policy rates into consideration in formulating our cash forecast.
Bonds
Our return forecasts for fixed income are derived from current yield conditions together with expectations as to how real and nominal yield curves will evolve relative to historical precedent. We then build our benchmark forecasts from discrete analysis of relevant maturities. For corporate bonds, we also analyse credit spreads and their term structures, with separate assessments of investment grade and high yield bonds. We also take into account the default probability for high yield bonds in the foreseeable future.
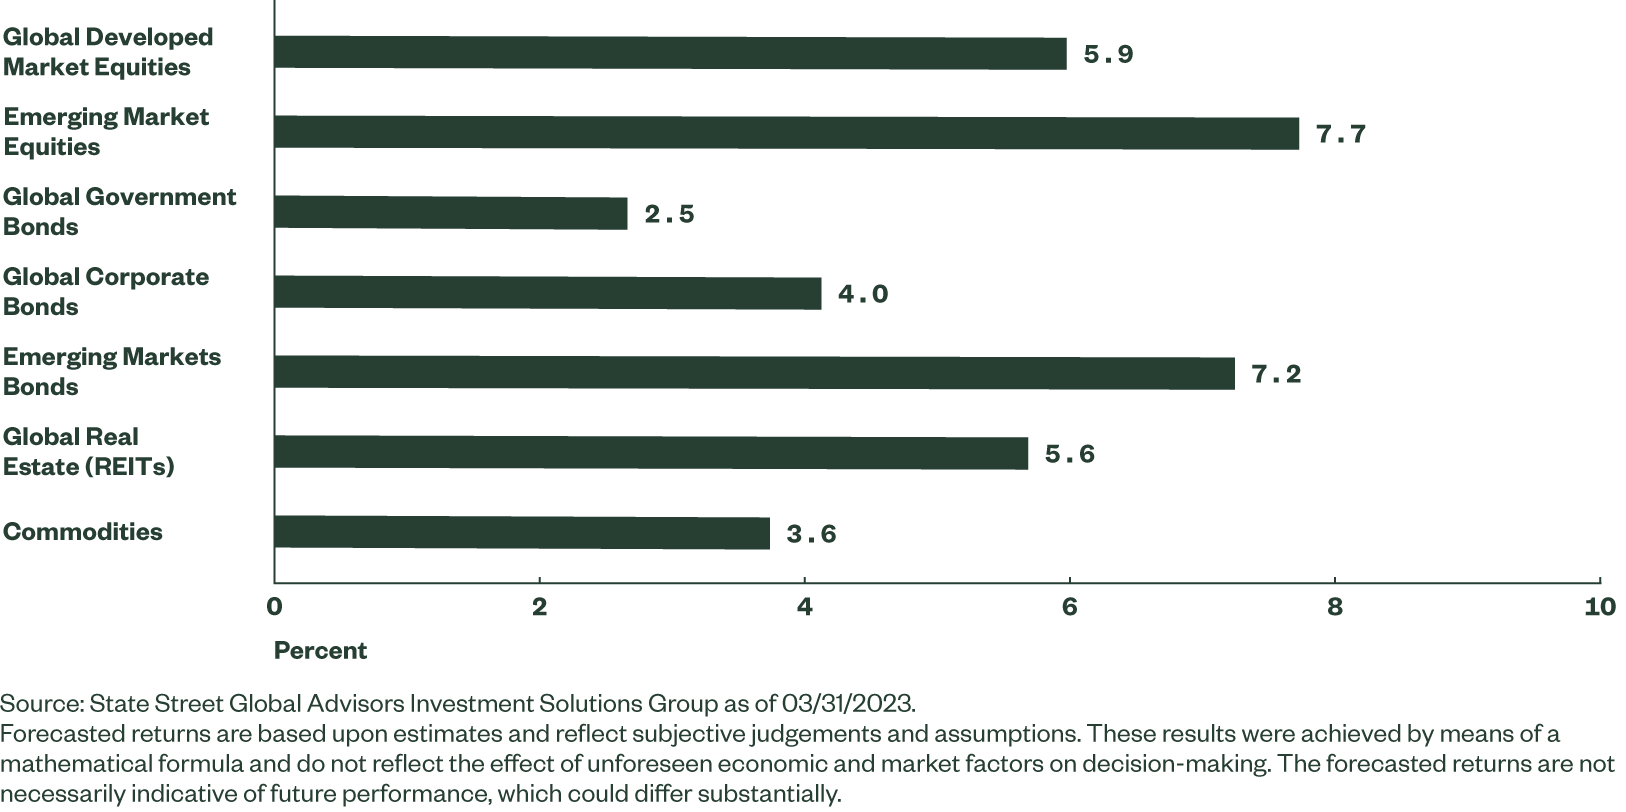
Figure 1: Forecasted Long-Term Annualised Return

Equities
Our long-term equity market return forecasts combine estimates of real return potential, derived from historical and current dividend yields, forecasted real earnings growth rates, expected share issuance or buyback yield, and potential for expansion or contraction of valuation multiples. Our way of estimating real earnings growth rates incorporates forecasts of GDP levels. Across both developed and emerging markets, variations in labour, capital and productivity levels result in region-specific differences in the GDP estimates, allowing for more region-appropriate forecasts for both developed and emerging market equities.
Another important feature of our equity forecasts is that they include elements of ESG through leveraging State Street Global Advisors’ R-Factor scores. Improvements in a country’s aggregated and normalised R-Factor scores are used to incrementally reduce its risk expectations within the forecast and the other way around.
Smart Beta
Smart Beta forecasts are developed using MSCI World index forecasts as a starting point and adding expected alpha and beta adjustments as appropriate.
Private Equity
Our long-term forecast for private equity is based upon past performance patterns of private equity funds relative to listed equity markets and our extrapolation of these performance patterns on a forward basis. According to several academic studies1,2,3 the annual rate of return of private equity funds over the long term appears to be largely in line with that of listed equities after appropriate adjustments for leverage are made. Private equity funds seem to have been outperforming relative to listed equities before fees, but generally in line with them (on aleverage-adjusted basis) after fees.
REITs
Real Estate Investment Trusts (REITs) have historically earned returns between bonds and stocks due to their stable income streams and potential for capital appreciation. Hence, we model it as a blend of two approaches. The first approach is to apply the average historical spread of the yields over Treasuries to forecast the expected return. The second approach is to account for inflation and long-term capital appreciation with the current dividend yield.
Commodities
Our long-term commodity forecast is based on the level of world GDP, as a proxy for consumption demand, as well as on our inflation outlook. Additional factors affecting the returns to commodity investors include how commodities are held (e.g., physically, synthetically, or via futures) and the various construction methodologies of different commodity benchmarks. Futures-based investors have the potential to earn a premium by providing liquidity and capital to producers seeking to hedge market risk. This premium is greatest when the need for hedging is high, driving commodities to trade in backwardation, with future prices that are lower than spot prices. When spot prices are lower, however, the market is said to be in contango, and futures investors may realise a negative premium.
Long Horizon Risk
We believe that over the long term, prices are anchored to some sort of a slow-moving, fundamentals-anchored process, while in the short term, these same prices cycle quasi-randomly around such anchors. Thus, the returns on most financial assets can be effectively separated into a long-term component linked to economic fundamentals and a transient part linked to “excess volatility” or other noise. Such property of asset returns rhythms nicely with the investors’ need to balance strategic portfolio optimality with the short-term risk control. With that in mind, we expanded our Long-Term Return Forecasts to include long-horizon risk estimates alongside ordinary, short-horizon ones.
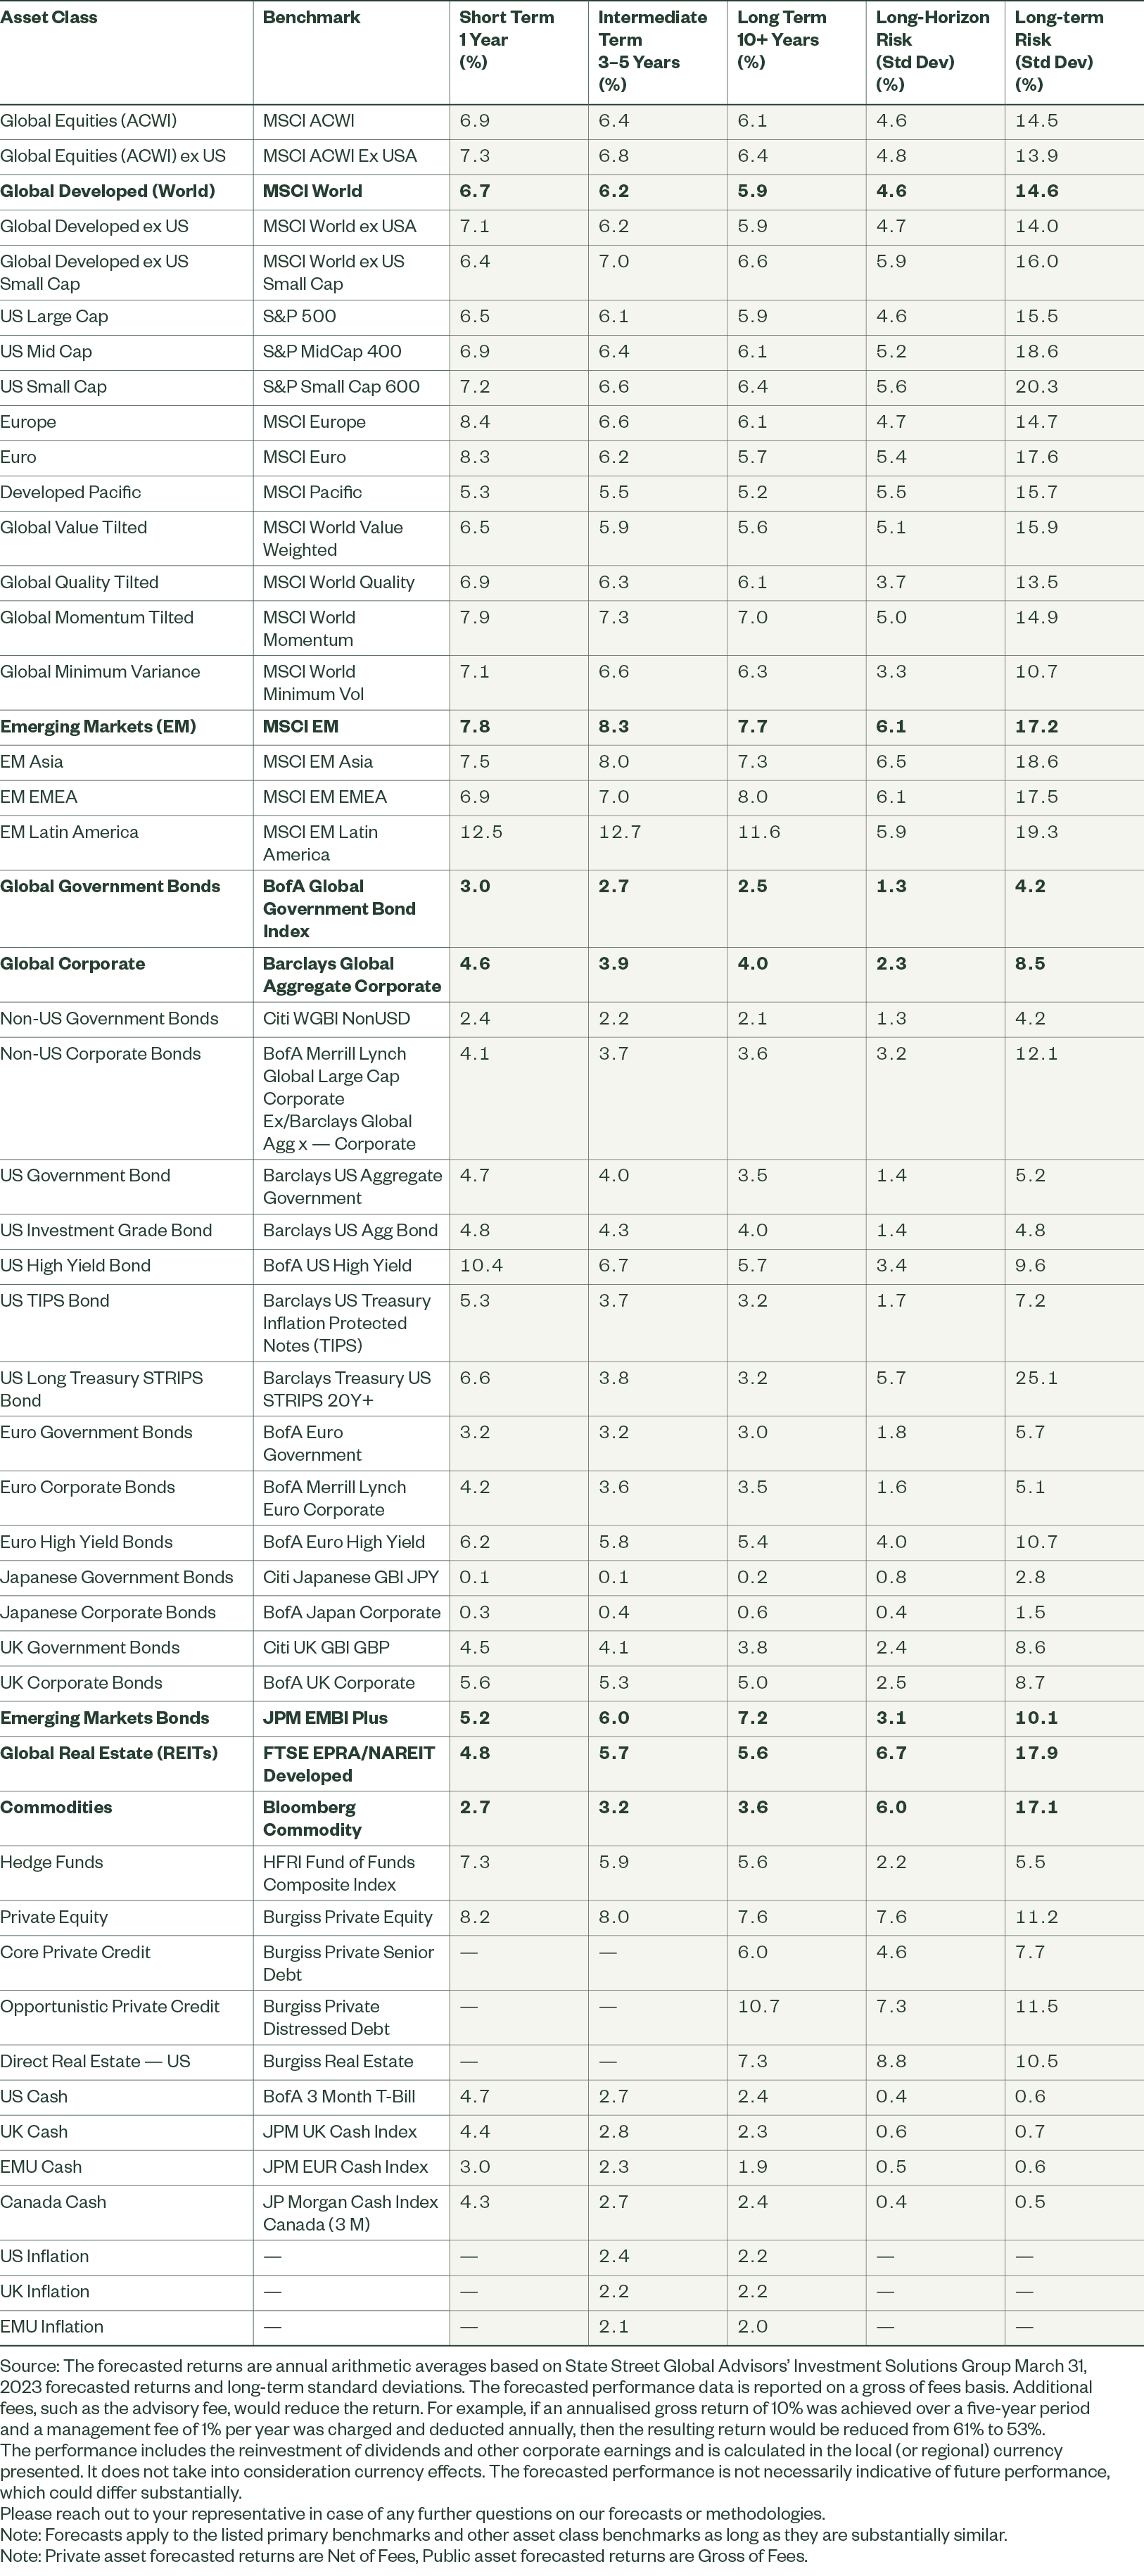
Figure 2: SSGA Asset Class Return Forecasts
