What an 80:60 Equity Strategy Can Teach Investors as Market Volatility Rises
- Defensive equity strategies seeking to participate substantially in up markets while limiting exposure to market downsides (i.e., approximately an 80:60 ratio of upside to downside capture) can significantly outperform their benchmarks.
- Our analysis, stretching back to 1900, shows that an 80:60 defensive strategy can outperform the benchmark not just over the span of many years, but also over a more practical, decade-by-decade investment horizon.
Many commonly used approaches to equity portfolio construction assume that, over time, returns on financial assets will cluster symmetrically within a small range of the mean. In practice, however, the distribution of returns has not followed this “normal” distribution pattern. Instead, returns on assets tend to be “fat-tailed,” with far more instances of extreme losses and gains than a normal distribution would predict. Unfortunately, large losses can impair investment prospects for months and even years. Defensive equity strategies attempt to combat this problem. With their dual return and risk mandate, defensive strategies seek substantial participation in market upsides while limiting exposure to market downsides – an approach that can help investors realize the normal distribution patterns they expect.
The 80:60 Strategy since 1900
A defensive strategy’s upside/downside capture ratio measures the degree to which it has gained or lost relative to an index. An “80:60” strategy is constructed to participate in 80% of up markets and 60% of down markets. This capture ratio is typical of State Street Global Advisors’ defensive equity strategies.
The risk and return outcomes of an 80:60 strategy can vary substantially from those of an index. Consider the 119-year history of the Dow Jones Industrial Average (DJIA), consisting of 1,435 monthly observations since 1900. Of those, 58% of the monthly returns were positive; 42% were negative. The average monthly return during positive months was 3.73%, while the average monthly return during negative months was -3.85%.
Two notable points emerge from this analysis. First, at 42%, the proportion of negative monthly returns is much higher than many investors might expect. Second, there is a noticeable degree of asymmetry in average returns between the up and down months; in other words, on average, markets sink lower when they’re down than they rise when they’re up.
This combined phenomenon can significantly impair overall outcomes over time – but our analysis shows that a portfolio with 80% upside participation and 60% downside participation can indeed yield significant improvement in both returns and risk.
For example, 80% upside and 60% downside participation in the DJIA over 1,435 months (until July 2019) would yield annualized returns of 8.74%, compared to 5.16% for the DJIA alone. In fact, the gap between index performance and the 80:60 strategy’s performance on returns progressively widened, as the asymmetry in negative versus positive returns compounded over time. And from a risk perspective, total annualized volatility of the 80:60 portfolio was only 12.74%, compared to 18.09% for the DJIA. This represents a relative risk reduction of nearly 30%.
The 80:60 Strategy, Decade by Decade
Investors working within the span of a career – rather than a span of more than a century – may well ask whether the 80:60 approach can contribute to positive outcomes over a practical investment horizon.
When we break this 119-year period down into decades, we observe that the model 80:60 strategy tends to outperform in terms of returns in almost all decades.1 (See Figure 1.) In general, the model 80:60 strategy was most effective in delivering excess returns during decades with the highest volatility and the greatest proportion of down months. Importantly, though, from a risk perspective, the volatility of the model 80:60 strategy is consistently lower than the index across all decades.
More Insights
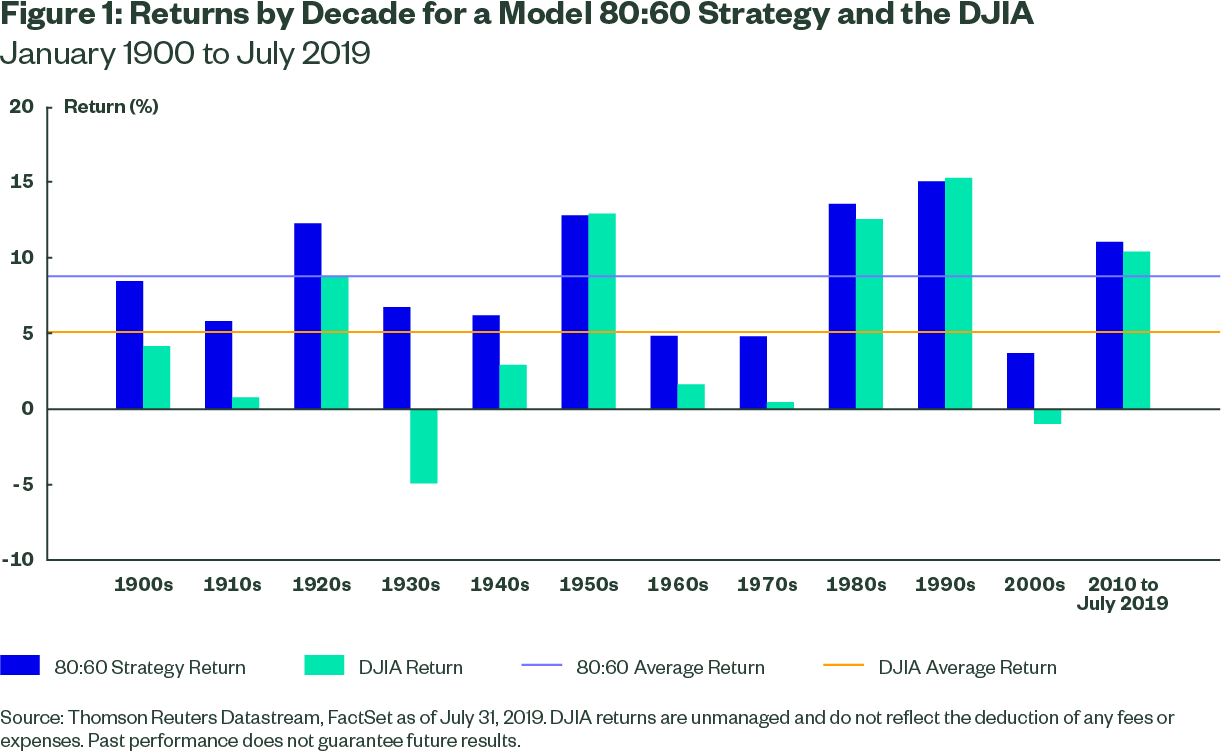
It is worth noting that the 10-year period ending July 2019 has seen historically low levels of market volatility, which has made it more difficult for a defensive, 80:60 portfolio to outperform the market. Even so, the 80:60 strategy outperformed the market over that time frame.
Achieving an 80:60 Outcome
To construct a defensive equity portfolio that achieves an 80:60 capture ratio, we believe it is important to consider the return and risk characteristics of individual stocks in terms of value, quality, and investor sentiment (including price momentum). In general, we find that companies with low volatility, good value (e.g., high dividend yield, high earnings to price, high cash flow to price), high quality (e.g., low balance sheet accruals), and high momentum (e.g., last year’s winners) tend to outperform their peers – and therefore are strong candidates for inclusion in an 80:60 strategy.
The Bottom Line
Our analysis suggests that a defensive strategy seeking to maximize risk-adjusted returns over time may have a substantial advantage over the index. By avoiding some downside participation while continuing to pursue a large proportion of available upside, defensive equity strategies can create compelling return streams while performing well in both up and down markets.