The Retirement Prism: Seeing Now and Later
Since 2018, State Street Global Advisors has fielded the Global Retirement Reality Report (GR3) to understand how individuals and institutions are preparing for, and possibly redefining, retirement across the world. Over the years, State Street has explored:
- The role happiness plays as an indicator of and contributor to retirement readiness and satisfaction
- The alignment of employer insight and employee need specific to retirement saving and spending
- The pandemic as a catalyst for reshaping the global outlook on work and retirement
This year, while the devastation of COVID-19 has decelerated, employees are contending with new challenges: inflation, Russia-Ukraine war impacts (including rising energy prices), and a changing relationship with work. What’s more, people’s perceptions of time have been altered by the pandemic experience, as shown in a “Blursday” online database hosted by the scientific journal, Nature.i The elastic perception of time, which has snapped back in some ways and sagged in others — is important to consider in the context of retirement. This is because time is the institution that backs the currency of retirement income, informing how much one has and how long it will last.
In considering the findings from the 2022 survey, it appears that people are developing a dual view, holding the present (punctuated by acute inflation concerns) and the future (buffered by increased savings and demand for outside expertise) simultaneously. Employers and financial advisors should be equally deft at managing multiple lenses. So instead of thinking about retirement as now versus later, the conversations around when, why, and how people retire and what the right funding mechanisms are might be better had in the context of now and later.
This year’s report features seven key findings that explore work, life, and investment and retirement income expectations. Respondents globally have taken the reins on retirement readiness by delivering the least neutral responses captured by a GR3 survey, asserting their immediate needs, and citing actionable steps toward longer-term goals. As the savers’ collective voice clarifies, employers, financial advisors, and policymakers would be wise to listen.
Finding #1: Budgeting for a Lifetime Depends on the Definition of “Lifetime”
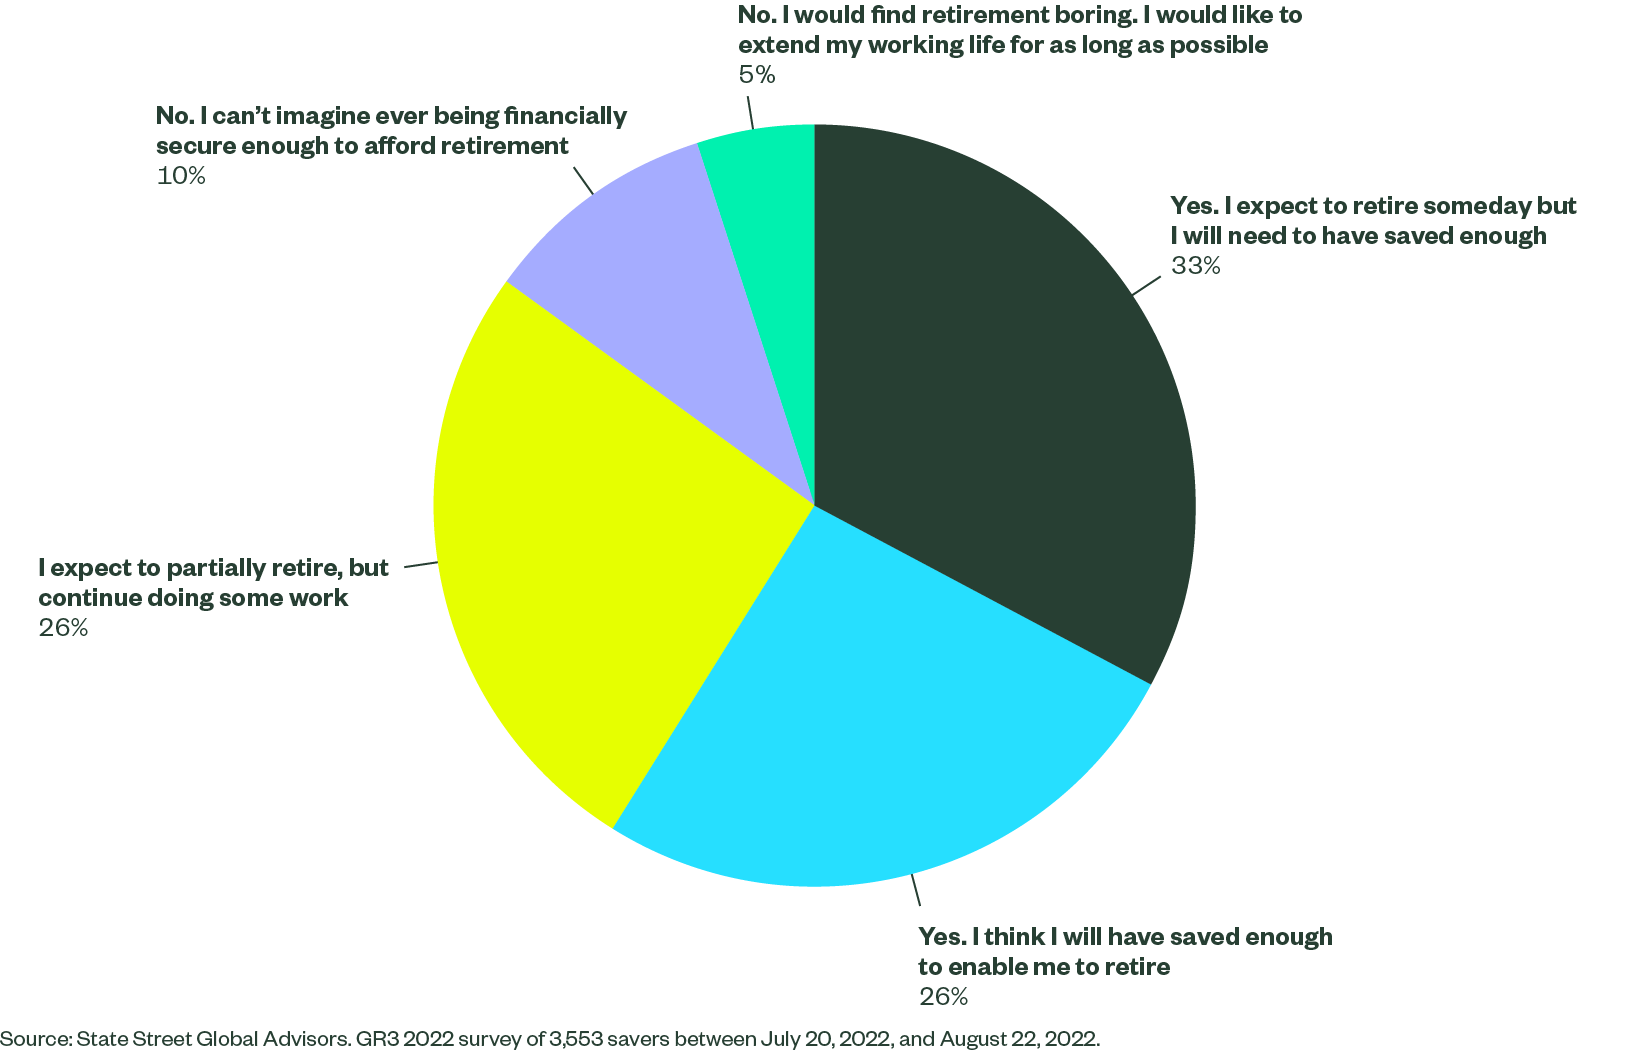
Is retirement within reach? For the majority (85%) of global respondents, the answer was yes, as most expected to enjoy some version of retirement — either a full retirement (59%) or a future of partial work (26%). For those who didn’t see retirement on the horizon, a minority (5%) was eager to stay engaged in work life, while the remainder of respondents (10%) didn’t believe that retirement was financially feasible. But for most, retirement remained the destination.
Figure 1: Do you expect that you will retire?
Of the 85% of respondents who were looking ahead to retirement, 65–69 years was the most predicted retirement age range (40%) and 80–85 years was the most popular life expectancy range (24%). These retirement and life expectancy age parameters reappeared in respondents’ retirement budgeting concerns: 74% of respondents globally were more concerned about budgeting in the early years of retirement, defined as 65–80 years, with the goal of making savings last a lifetime.
Figure 2: What age do you expect to retire? Assuming an uneventful and fairly healthy life, how long do you expect to live?
Source: State Street Global Advisors. GR3 2022 survey of 3,553 savers between July 20, 2022, and August 22, 2022.
Here, the definition of “lifetime” is both critical and consistent. Data from the United States and Ireland further this point: Of the countries surveyed, the US showed the highest concern (30%) for budgeting in the later years of retirement, defined as 80+ years, as correlated with greater concerns around higher later-life healthcare costs. (Medical expenses are Americans’ second ranked financial fear for retirement at 38%, following inflation at 68%. See Figure 11 for global tallies.) Americans also reported the greatest expectation of living past 90 years (26%). Conversely, Irish survey-takers reported the lowest level of expectation to live past 90 years (18%) and the greatest concern for budgeting in early retirement (79%).
Despite incremental differences in responses at the upper end of the life expectancy, respondents were definitive in their focus on budgeting for early retirement, as aligned with life expectancy.
Finding #2: The Great Resignation Has Redefined Work Life
The pandemic has changed the way most people work. For office workers, the cubicle walls crumbled in 2020. Working from home against an apocalyptic backdrop gave people a unique opportunity to reevaluate their priorities. And when employers began calling employees back into the office in 2021, fewer returned — 47.8 million fewer in the US alone. Known as the Great Resignation, this trend of changing jobs (or careers), joining the gig economy, downshifting, or leaving the workforce has emerged as a quest to reclaim what’s important: family, overall health, and passion-oriented pursuits.
“The pandemic has given us new meaning to life. A work-life balance has never been more important and spending time with families and friends is my priority. Life is for living, not working.” —Irish woman, age 35-44, income range €30,000-€49,999.
But does embracing personal priorities today jeopardize retirement readiness tomorrow? Survey respondents whose retirement outlook has changed against the backdrop of the Great Resignation (26% globally) were willing to take the chance — and are betting on evolving earning opportunities.
“I am considering requesting to work fewer hours, which would give me more time to live my life now. It would also give me less money, and lower pension contributions, meaning I'd likely have to continue to work for longer.” —British man, age 35-44, income range £60,000+.
“I might be able to partially retire sooner than I had planned and take a part-time remote job to supplement my savings. So, retiring from the work I do now, but not retire completely. I feel like there will be more jobs available to me as a remote part-timer.” —American woman, age 55-64, income range $60,000-$99,999.
“The workforce and earning opportunities that exist now are much broader, more flexible. This changes the traditional perception of working 9 to 5 until age 70.” —Australian woman, age 55-64, income range not provided.
This year’s GR3 survey explored the types of support that could help those interested in working to remain comfortably employed, with responses offering a possible glimpse of future work life. Globally, respondents favored flexible working arrangements (47%), the ability to transition to a part-time schedule (46%), and an increase in health and medical benefits (27%). Exploring new job responsibilities (19%), reskilling (17%), and job-sharing (17%) were other areas of interest, while fewer than a quarter (22%) of survey-takers did not want to remain employed in any capacity after retirement age.
While the future may portend an easing out of the workforce as opposed to an exit, survey-takers didn’t rank income from part-time work as a top contributor to retirement finances. Instead, nearly all countries ranked the same top three expected retirement income sources, in varying order:
- Employer-sponsored defined contribution plan
- Government entitlement
- Personal investments
An additional channel that found itself in the top third of the ranking, below the top three choices, was a private retirement savings plan offered through a financial advisor and/or retail provider (this survey option was not offered in Australia). The increased interest in leveraging a financial advisor, explored in Finding #4: The More People Save, the More They Seek Support, connects to the assertion made by the majority of survey-takers globally (65%): They are singularly responsible for their financial preparedness in retirement. With this responsibility, savers may be more apt to think outside of the defined contribution plan in an effort to buffer against a volatile economy.
Returning to the income sources rounding out the list, strategies around property — such as refinancing to release liquidity, downsizing, or buying an income-generating property — and inheritance consistently fell to the bottom of the list. These rankings aligned with 2018 survey data, though they showed even less affinity in the current market environment, most likely due to mortgage pressures.
Figure 4: What do you expect to be your main sources of income in retirement?
Property and inheritance detail

Finding #3: When it Comes to Optimism, People Are Shifting Out of Neutral
Investing action is often catalyzed by investor outlooks. Since State Street began fielding GR3 in 2018, the US has consistently been the most optimistic, mirroring America’s sunny cultural consciousness, or at least its reflex of positivity. To account for the American outlook, US trends have been isolated from the global aggregate for a clearer sense of sentiment.
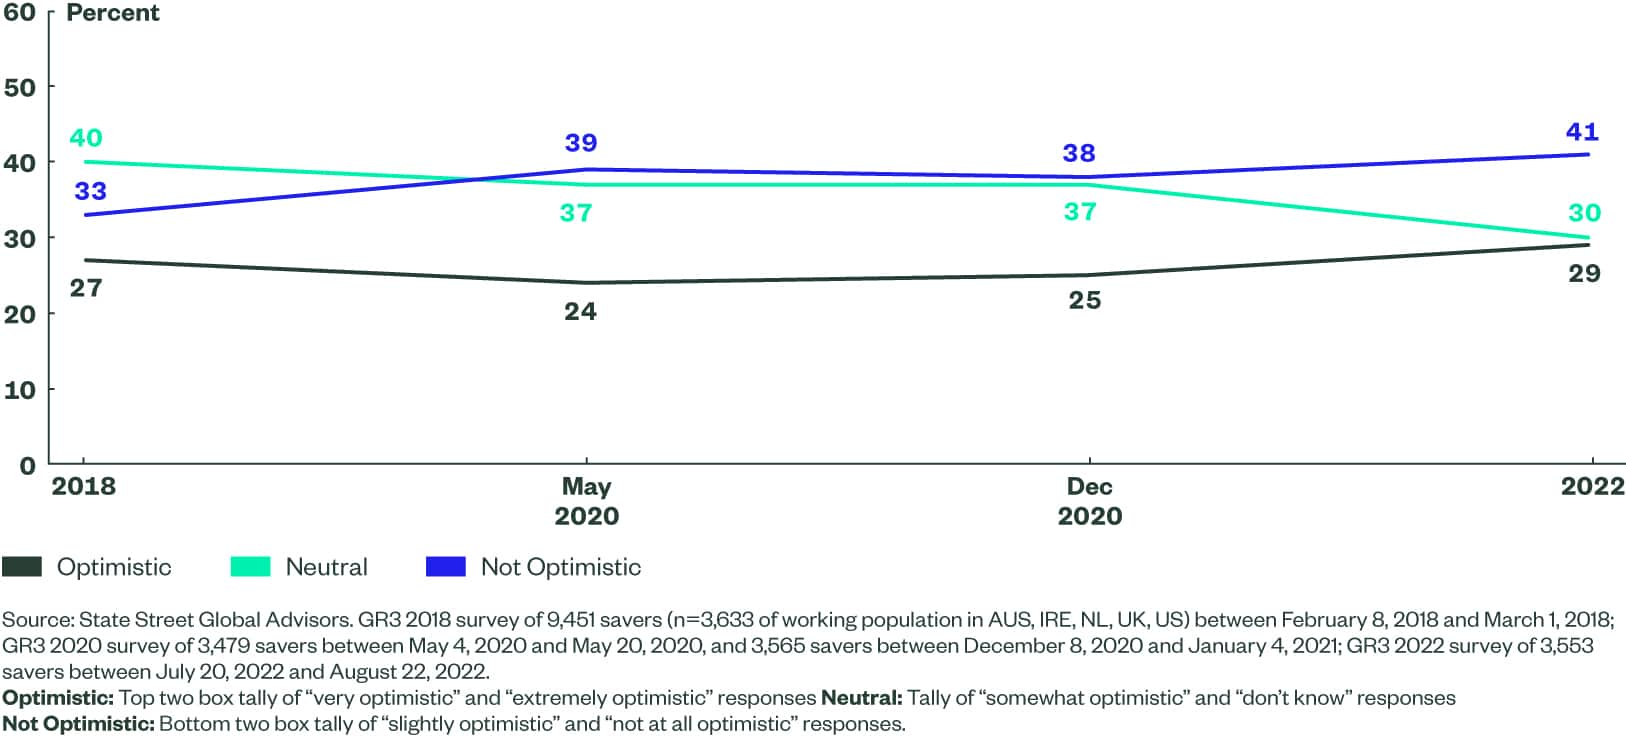
Figure 5: How optimistic are you that you will be financially prepared for retirement by the time you stop working?
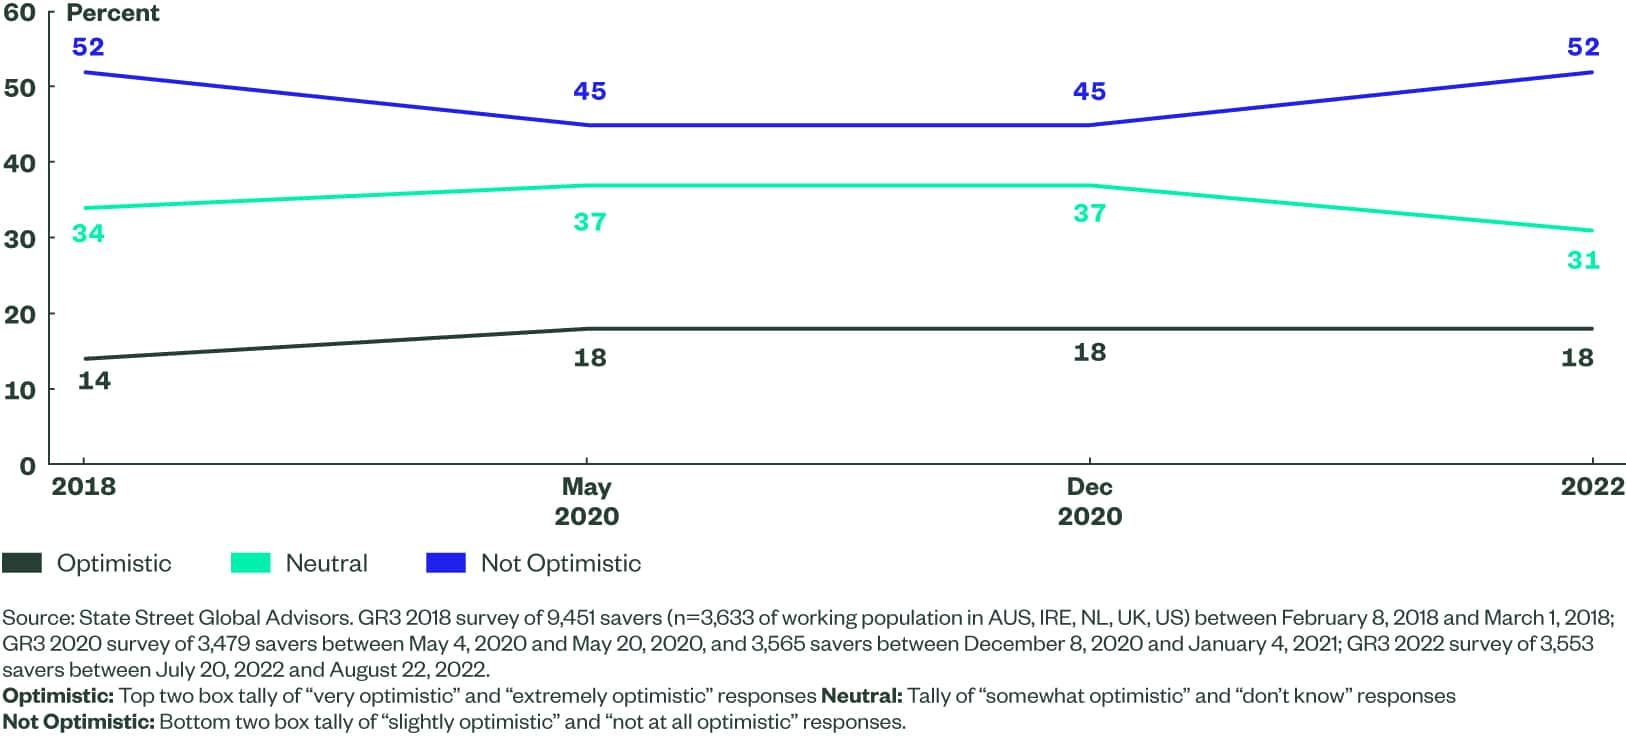
Here a consistent shape emerges for Europe and Australia across four years, with one exception: pessimism, which dipped in 2020 (45%) and returned to 2018 levels in 2022 (52%). This seven-point jump was mirrored by a six-point dip in neutral responses, suggesting that fewer respondents were on the fence. By asking respondents to consider retirement readiness, the survey may have highlighted a more palpable issue, namely a shift in people’s day-to-day sense of well-being from tolerable (neutral) to uncomfortable (not optimistic) — possibly due to the twin burdens of inflation and geopolitical conflict.
In 2022, 60% of respondents in the United Kingdom were “not optimistic,” compared to the global average of 52%. Ireland followed with 48% of survey-takers who were “not optimistic” about their level of retirement readiness.
Turning to the US, in 2022 optimism (29%) about financial preparedness for retirement had both rebounded since its pandemic decline and surpassed sentiment cited in 2018. However, in comparison to changes in neutrality (10-point decrease) and pessimism (eight-point increase) over the same time period, the two-point rise in optimism seems minor. The bigger story appears to be alignment with the global trend, one that suggests people are moving out of the middle and toward the outer ends of sentiment.
Finding #4: The More People Save, the More They Seek Support
But does a change in sentiment translate into action? In 2022, as compared with 2020 survey data, respondents from all countries reported an increase in retirement saving contributions and a corresponding decrease in reducing or ceasing savings. The US and Australia were notable here in realizing meaningful increases in both retirement savings (Figure 6) and short-term savings and investments, yielding double-digit increases in both regions on both dimensions.
Figure 6: During the last 6 months, have you made any changes to how much you are saving in your retirement savings plan/superannuation plan?

When respondents were asked to elaborate on changes made to retirement plans, the global sample cited changes to the frequency of checking one’s balance — either more often (38%) or less (16%), most likely driven by the mercurial market — and increased contributions (28%). Seeking financial advice was the fourth most selected answer globally (13%), most popular among people age 65 and older (24%). Across age groups, Irish respondents had the highest penchant for financial advisor guidance (19%), followed by the US (14%).
Looking to previous GR3 data sets, the trends are consistent, but the emphases have spiked. Compared with the May 2020 survey data, increased balance-checking had soared by an additional 20 points globally (18%), decreased balance-checking followed with a nine-point boost (5%), and seeking financial advice saw a seven-point rise (6%), suggesting that the savers in 2022 were paying more attention to their retirement portfolios than they have in years past — unsurprising, given undulating markets.
Finding #5: Savers Seek a Retirement Income Solution that Balances Flexibility and Security
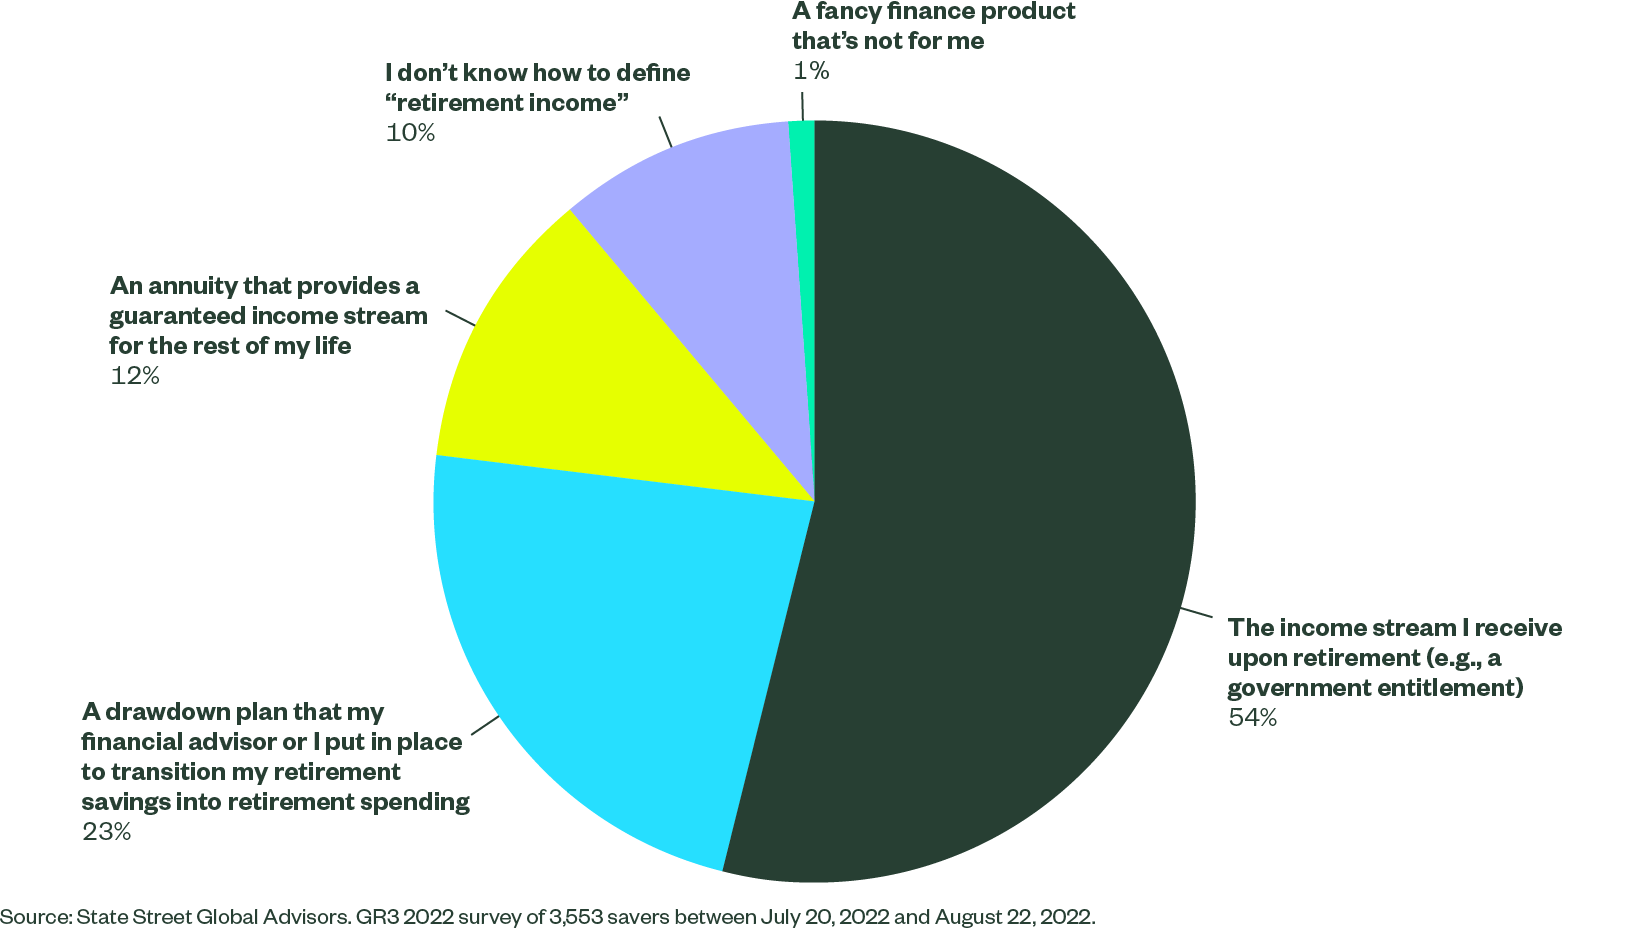
Plan sponsors, consultants and institutional investment managers within the defined contribution space may assume that they share the same definition of retirement income with savers. To challenge this assumption, State Street posed the question to survey-takers. Over half (54%) of respondents globally defined retirement as an income stream, referencing familiar government entitlement programs like Social Security in the US, the State Pension in the UK and Ireland, and the Government Age Pension in Australia. The second–place response (23%) referenced the support of financial advisors, a theme most resonant in this year’s survey, and described a drawdown plan created outside of the employer environment. At a lagging third place (12%), respondents described an annuity that offers an income stream for life. The remaining respondents were unable to define retirement income or feel excluded from the concept, as articulated by one survey-taker:
“Retirement income is glorified to us as a privilege when we shouldn’t have to wait until we're old to receive support and an income.” —Australian woman, age 18-34, income range A$50,000-A$99,999.
Figure 7: Which of the following most closely meets your understanding of the meaning of “retirement income?”
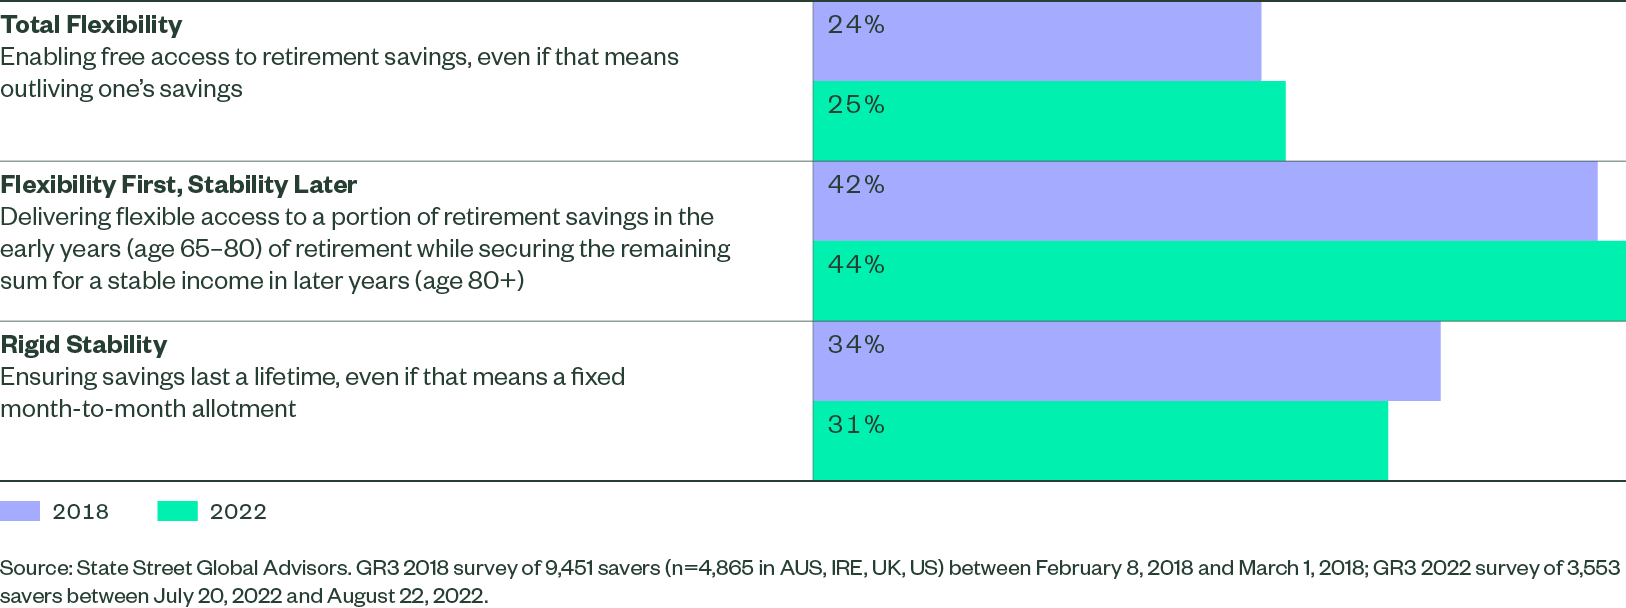
With a clearer sense of how savers define retirement income, the next question becomes, how do they expect to access it? Since its first fielding, the GR3 survey has presented respondents with a spectrum of possible retirement income structures. In 2018 and again in 2022, the most popular option globally (42% and 44%, respectively) was to have access to flexibility first and stability later (Figure 8). Following this top ranked hybrid option, most respondents leaned toward the secure end of the scale.
It is interesting to see the modest increase in preferences for total flexibility from 2018 to 2022 and decrease in rigid stability during the same time period. While stability remains the second choice for respondents globally, both an increase in an adjustable work life and inflation could play roles in the tilt toward flexibility. In the case of the former, part-time or episodic retirement may result in the need for more inventive and flexible financial support. Regarding the latter, as individuals’ purchasing power decreases in inflationary cycles, a fixed income stream translates into a tighter budget.
Figure 8: From the following options below around how you could access your retirement savings, which would you choose?
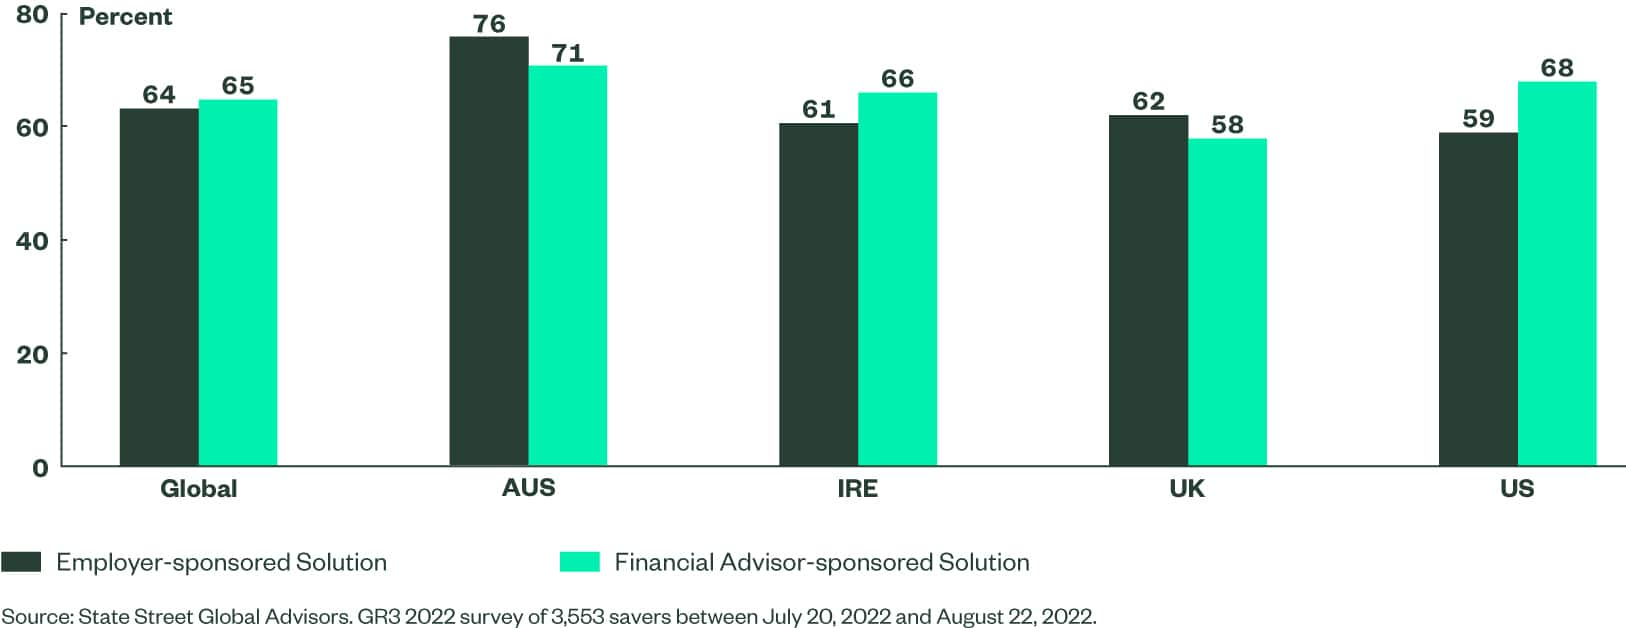
Moving from the shape of the solution to the provider, respondents were asked from whom they preferred to receive the solution — their employer or financial advisor. The survey questions were discrete, meaning all respondents replied to both and suggested that both providers are valued by savers. However, across respondents globally, the financial advisor was the narrowly preferred provider (65%), with the US (68%) and Ireland (66%) showing the greatest penchant.
Figure 9: To what extent would you agree or disagree with the following statements regarding retirement income providers?
I would value a solution from my employer/ superannuation fund that provides a consistent stream of income in retirement, as opposed to receiving all of my retirement savings in one lump sum as soon as I retire.
I would value a solution from my financial advisor that provides an income in retirement.
While the financial advisor has become a notable player in this year’s survey, both the employer and employer-sponsored plan remain critical supports to ensure a successful transition from retirement saving to retirement spending.
Beginning with the employer-sponsored plan, survey-takers were asked how helpful they would find the following employer-delivered resources and which resource(s) they would like to see offered by employers. Solutions ordered by survey popularity:
- Product: A source of regular, guaranteed income offered through your employer/ superannuation fund (e.g., annuity)
- Advice: Access to 1:1 financial consulting
- Tools: A mechanism or tool (e.g., retirement income calculators) to help you safely spend down your retirement savings over the course of your life
- Education: In-person or web-based town-hall style informational forums
Respondents consistently ranked these four resources in both helpfulness and interest in employer implementation; however, when it came to the latter, the UK and Ireland showed near equal interest in product (61% and 62%, respectively) and advice (58% and 62%, respectively) resources while the US and Australia showed a clear preference for product (67% and 72%, respectively) over advice (49% and 64%, respectively).
By suggesting the product could be an annuity, the survey sought to gain respondents’ impressions of that vehicle, an idea that was furthered by asking survey-takers which statements best aligned with their understanding of annuities. In general, the sentiment was neutral to positive. While most respondents were unsure of how to define the product, one in four viewed it positively, as a vehicle “providing safety and stability” (43%). Americans reported the most knowledge of the product (33%), while Australians were most positive about its safety and stability features (53%) and essential nature to providing an income in retirement (52%).
Finally, a further testament to savers’ confidence in the employer-sponsored plan was evidenced by nearly half of respondents globally (46%) expressing an interest in keeping money in a workplace retirement plan that provides income. This inclination was highest in Australia (55%) and the US (51%). State Street believes that those retirees who keep money in an employer-sponsored plan stand to gain from institutional plan pricing, which, due to economies of scale, is generally lower than retail fees, as well as vetted investment options, curated resources, and oversight from a familiar fiduciary able to support the transition from retirement saving to spending.
Finding #6: Immediate Socioeconomic Fears Impact Long-Term Outlooks
In 2020, State Street began asking respondents what variables were casting the darkest doubts on their ability to retire as planned. Given the seismic upheaval of the pandemic, State Street expected to see COVID-19 as the lead driver of discomfort, but it wasn’t the top concern in any country surveyed. While the pandemic’s impact on retirement readiness was cited by almost a third of survey-takers globally, it lagged behind anxieties around the political climate (40%) and not having spare money to save (37%).
In 2022, the list of retirement-derailing variables increased to include inflation and the impacts of the Russia-Ukraine war. For respondents globally, the cost-of-living crisis dominated (69%), followed by the evergreen concern of not having spare money to save (33%) and the current angst of the political climate (31%). Comparing concerns over the 2018 and 2022 time periods shows an interesting shift from existential to immediate unease — and suggests that for many, COVID-19 is a receding, rearview mirror issue.
Figure 11: What factors most negatively affect your confidence that you will be ready to retire when you plan to?
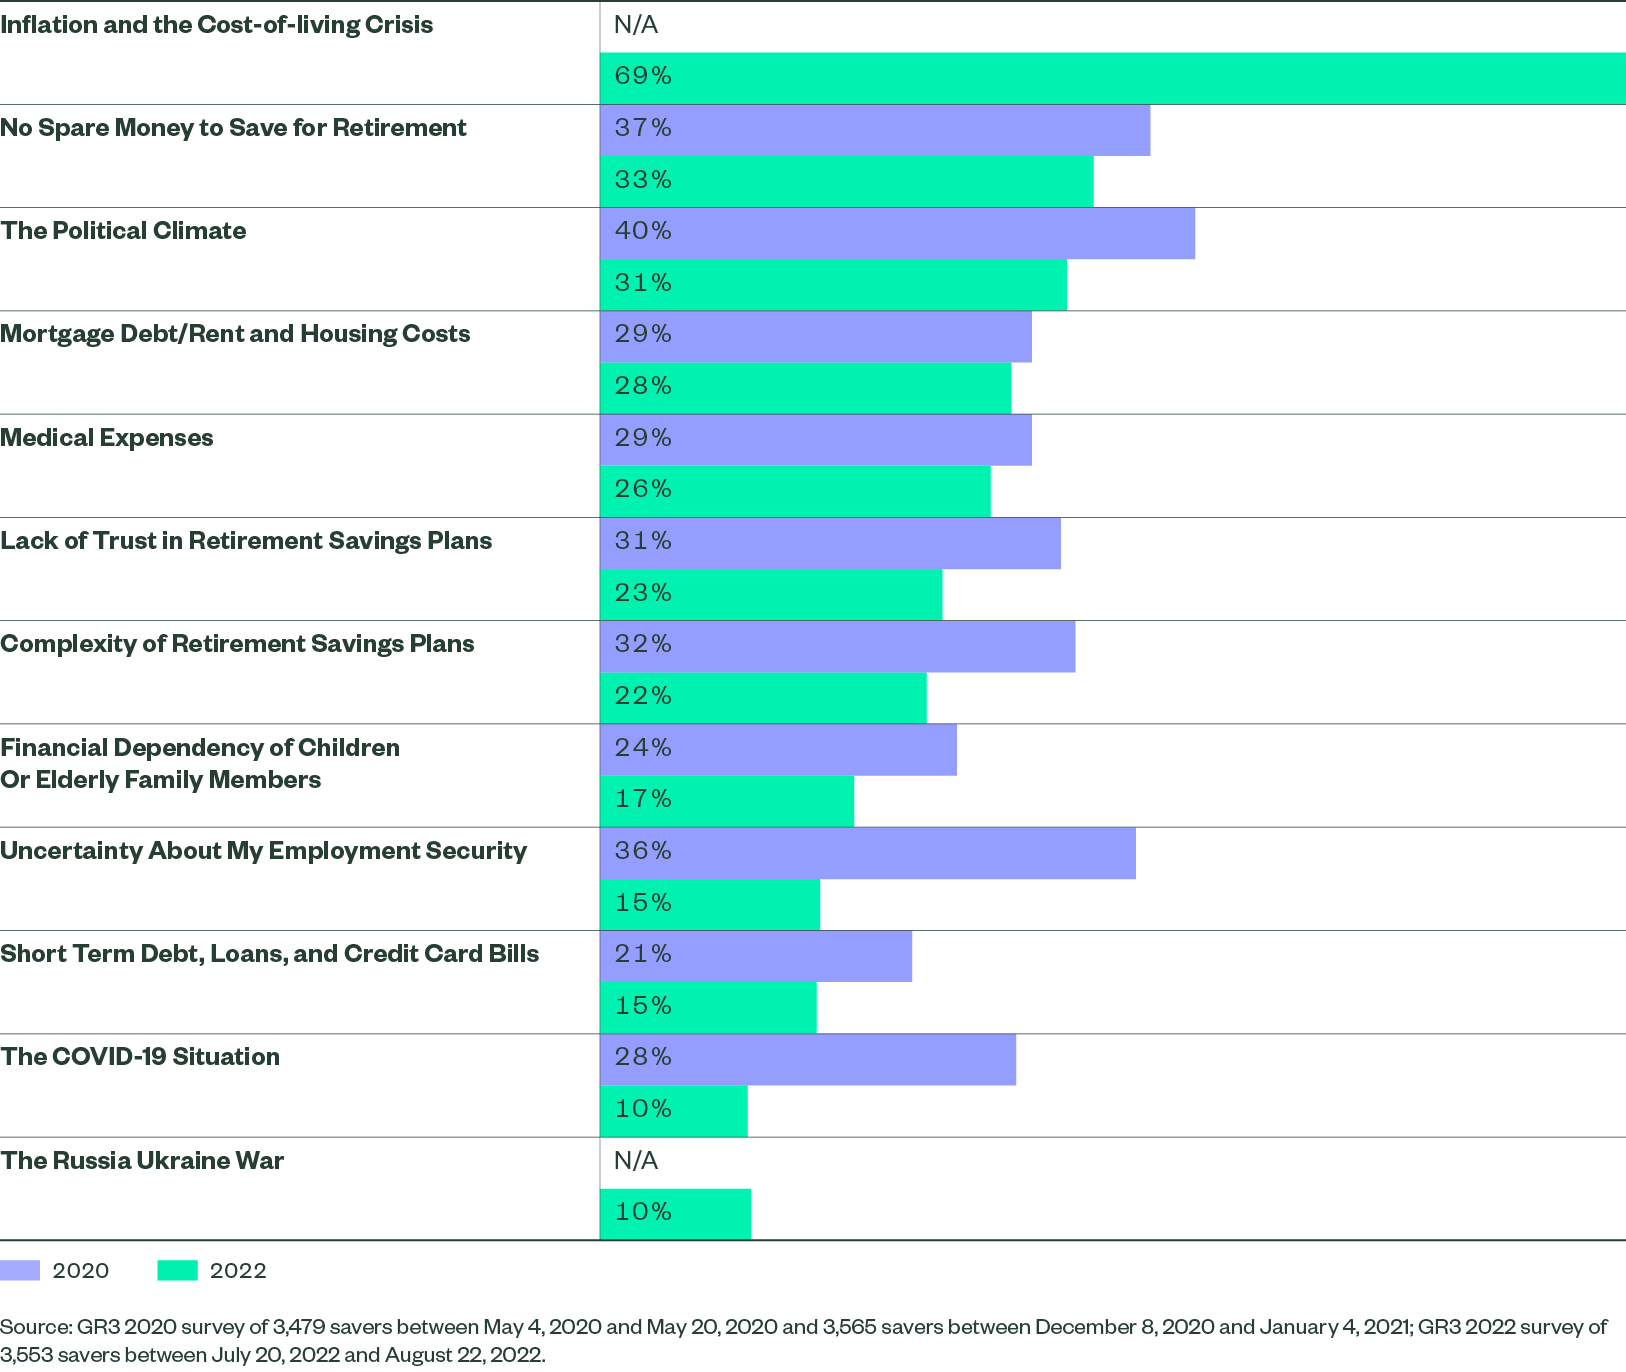
Socioeconomic fears loom large in impacting retirement readiness and mirror the concerns people have around financial management in retirement. While not reflected in Figure 12, respondents also wrote in concerns surrounding inflation and being unable to enjoy retirement, given financial stressors. Reasonably, survey respondents in countries where people expect to live longest — Americans (26%) and Australians (24%) — were more concerned about outliving their savings.
Finding #7: ESG Is in The Mix
In 2022, over half of respondents said that the inclusion of sustainable investments in retirement savings was important. A similar percentage of respondents believed sustainable investing options should be standard features of a defined contribution plan (54%) and that they would like the opportunity to pick the investments that matter most (53%).
Closing Thoughts
For employers, financial advisors, and policymakers seeking to support retirement access, coverage, and income, this year’s survey findings have yielded the following actionable insights:
- To achieve retirement readiness, savers (and those who support them) must have a now and later mindset. Managing the current cost-of-living crisis while preparing for a potentially non-traditional retirement means savers need to consider their finances more strategically. Employers can help by offering an array of resources (ordered by preference): products, advice, tools, and education.
- Longevity expectations inform individuals’ retirement income criteria. Individuals’ budgeting concerns, concentrated either during early or later retirement, depend on their longevity expectations. Employers and financial advisors offering tools (e.g., longevity calculators) and educational resources can deliver a data-driven glimpse of the future.
- Flexibility first. Regardless of longevity expectations, when it comes to retirement income solutions, savers are seeking a hybrid income solution that delivers financial flexibility first (in the early years of retirement) and follows with a stable income when it’s needed most.
- Annuities are not the enemy. While there is an opportunity to raise product awareness in regions where annuities are central to the retirement income solution, one in four survey-takers viewed the product positively as a vehicle that provides financial stability and is essential to delivering an income stream in retirement.
- Survey-takers are saving more as they look to their employer-sponsored plan as their primary stream of retirement income. Savers know they are responsible for their own retirement readiness and view their defined contribution (DC) plan as the primary source for their retirement income. Given the importance of the DC plan, employers have permission, if not a responsibility, to seed, manage and expand retirement saving and spending conversations.
- The financial advisor’s stock has risen, as savers seek outside expertise. Compared with past GR3 surveys, and potentially in response to market volatility and savings trends, respondents’ inclination to seek financial advice has doubled. Per the first item on this list, survey-takers ranked financial advice as the number two retirement planning resource they would like to see offered in the workplace and showed a slightly higher preference for receiving a retirement income solution from their financial advisor, as opposed to their employer. Not only does this finding bode well for advisors, but it bolsters the bridge between employers and advisors, making collaboration toward better retirement outcomes more organic.
Survey Methodology
State Street Global Advisors commissioned global analytics firm YouGov to conduct an online survey across four countries, representing a range of retirement systems. The goal of the 2022 survey was to monitor retirement sentiment and compare trends across 2020, 2019, and 2018 data sets. YouGov surveyed 3,553 individual savers with access to employer-sponsored defined contribution plans between July 20 and August 22, 2022. Gender, age, and regional quotas were balanced to reflect employed populations within each country. The sample was split 48% female and 52% male, with the concentration of respondents globally (48%) earning within the middle household income bracket offered by region: A$50,000-A$99,999, 30,000€-69,999€, £20,000-£59,999, and US$40,000- US$99,999. Respondents’ age skewed younger, with 56% of survey-takers under 45 years old.
Figure 14: Demographic Summary
| Region | Number Surveyed |
| Australia | 618 |
| Ireland | 607 |
| United Kingdom | 1180 |
| United States | 1148 |