EU Climate Benchmarks: Paris Aligned or Climate Transition?
In our previous paper, EU Climate Benchmarks: Standards and Implications, we looked at the minimum standards and investor use cases for Climate Transition Benchmarks (CTB) and Paris-Aligned Benchmarks (PAB). Next in the series, we discuss aspects investors may consider when deciding between a PAB and a CTB.
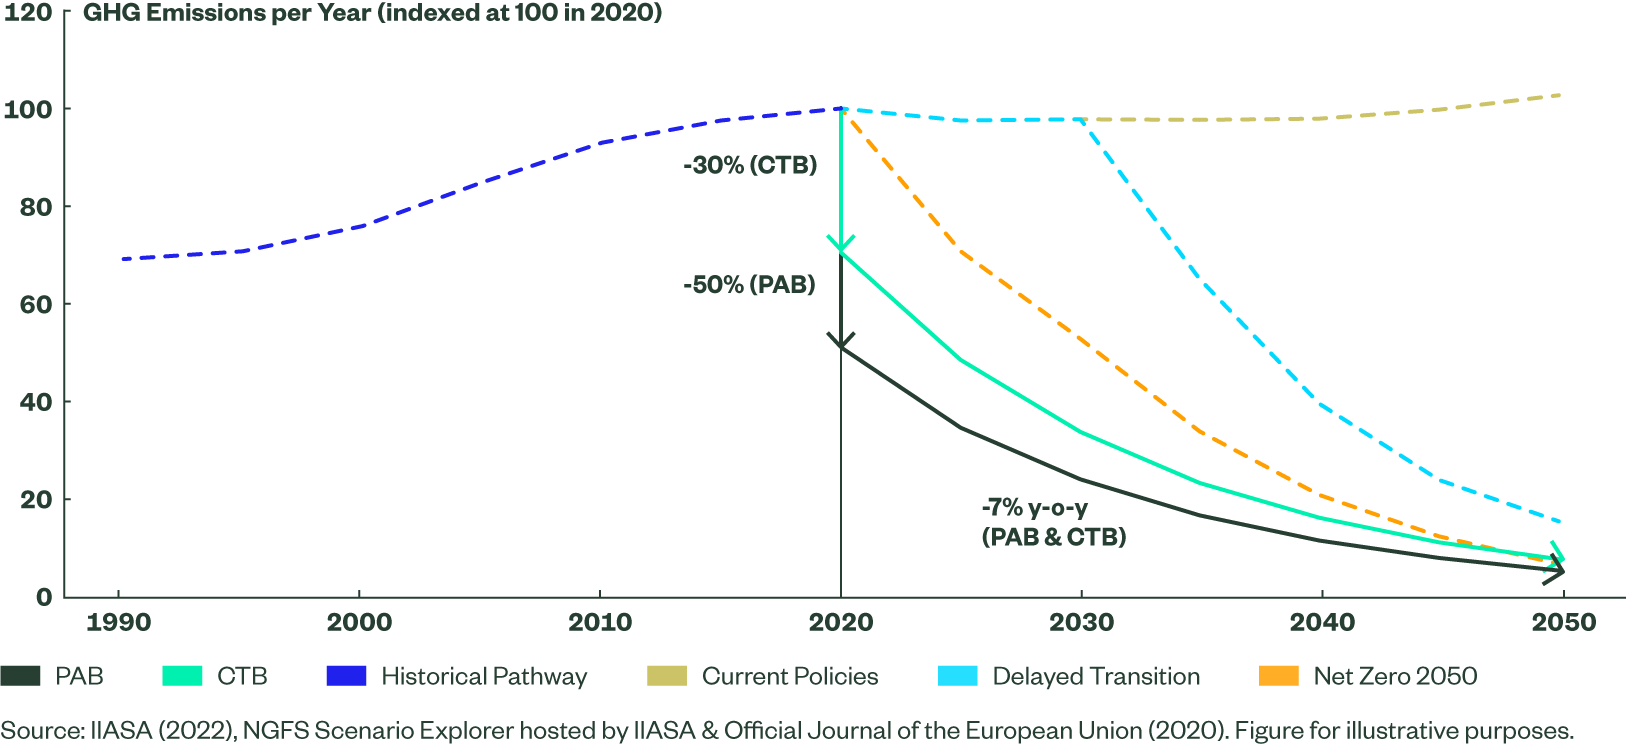
The EU defined two climate benchmarks, Climate Transition Benchmarks (CTB) and Paris-Aligned Benchmarks (PAB), to establish minimum standards for indices to align with IPCC’s 1.5°C trajectory1 and net zero in 2050. When deciding between them, investors may consider two important questions: their views on energy divestment versus engagement, and the trade-off between portfolio climate improvements and tracking error.
Figure 1: Key Considerations in Selecting Paris Aligned or Climate Transition Benchmark
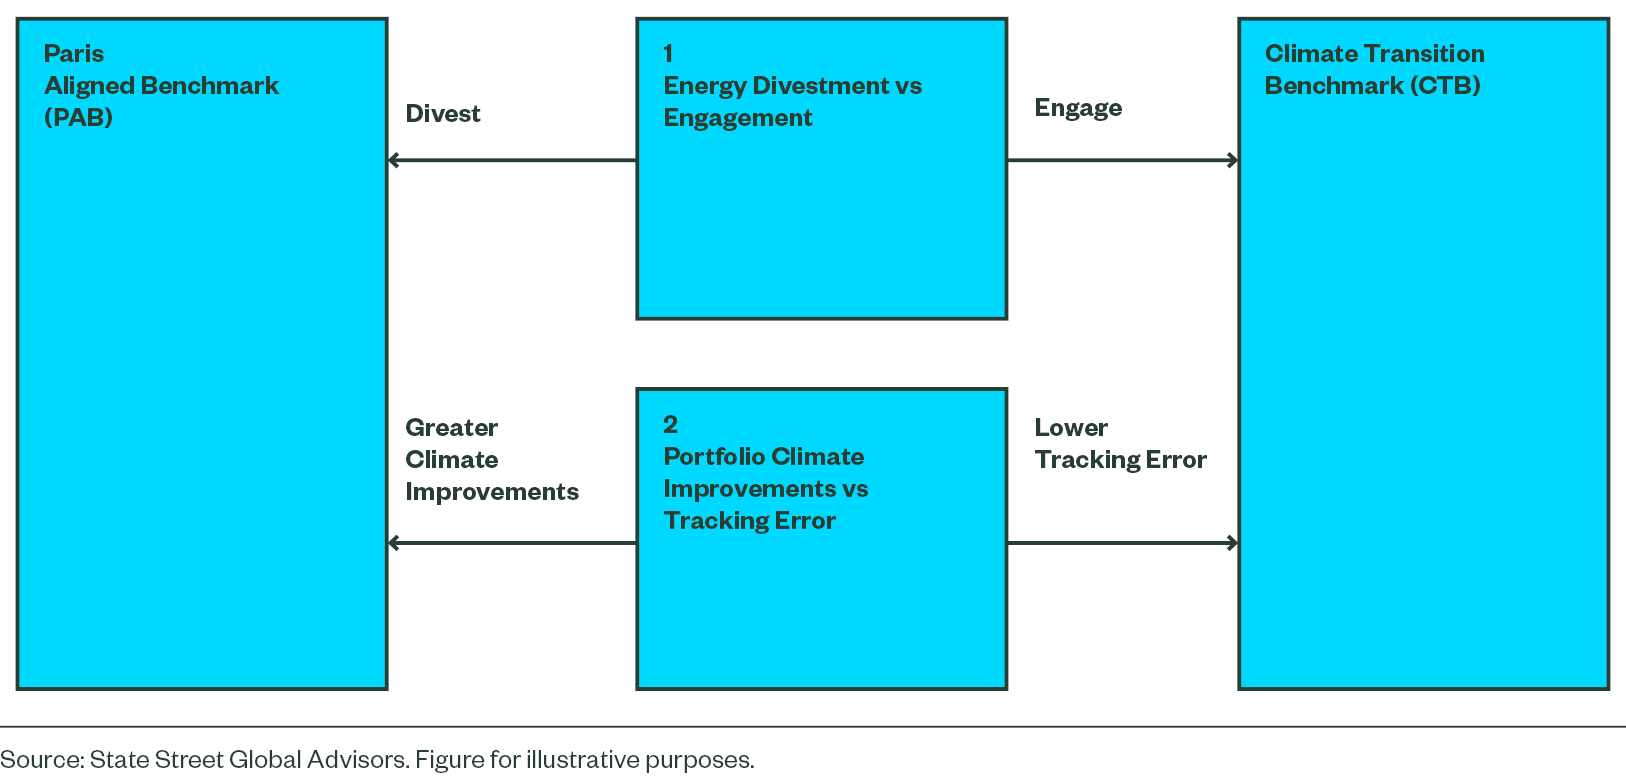
Figure 1 maps out an at-a-glance overview, based on our observation that PABs largely exclude energy companies, making them suitable for investors with a strong divestment preference. Alternatively, while CTBs hold energy companies, they heavily reweight them, tilting towards best-in-class so may represent a class of index more suitable than PABs for investors favouring engagement over divestment. In tracking error terms, the ‘cost’ of greater portfolio climate improvements employed by PABs has been around 20-80 basis points (bps).2
The Benchmarks
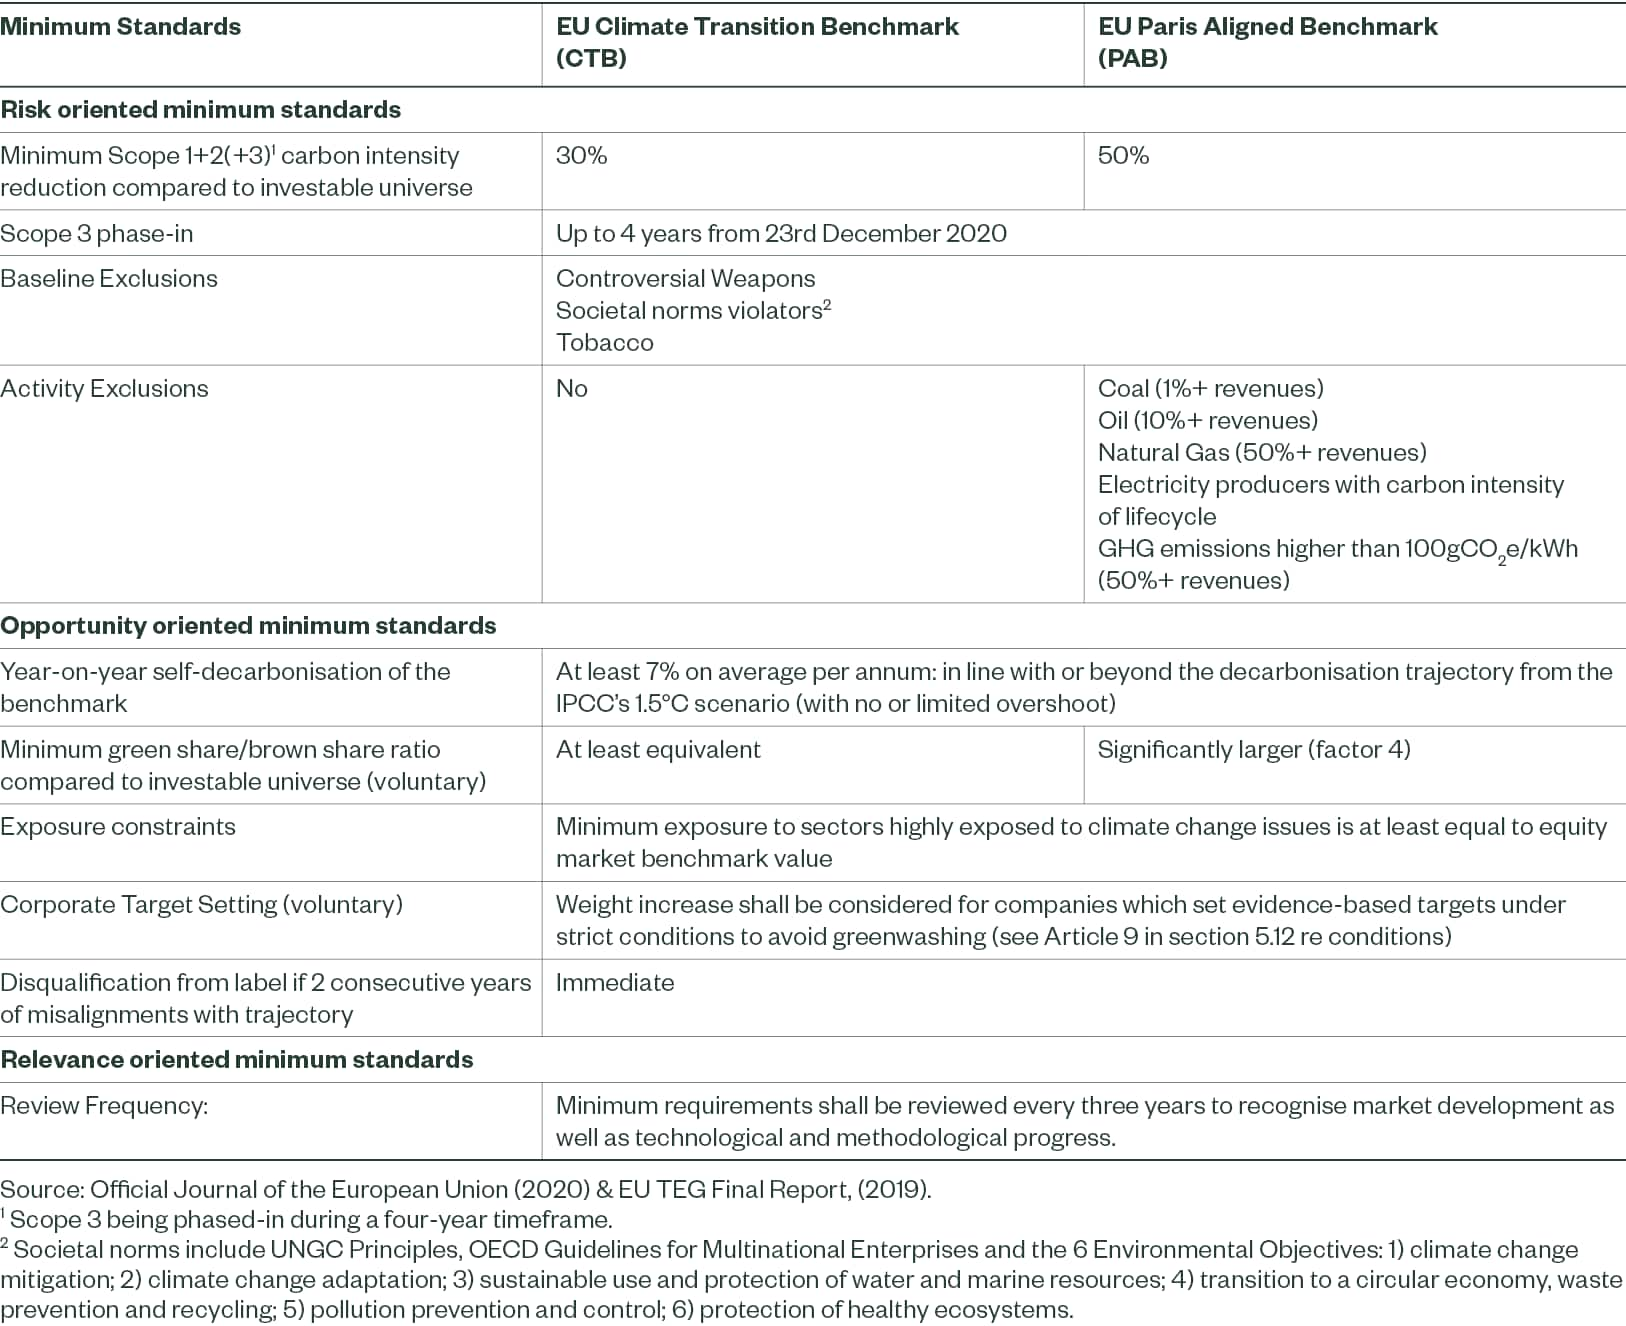
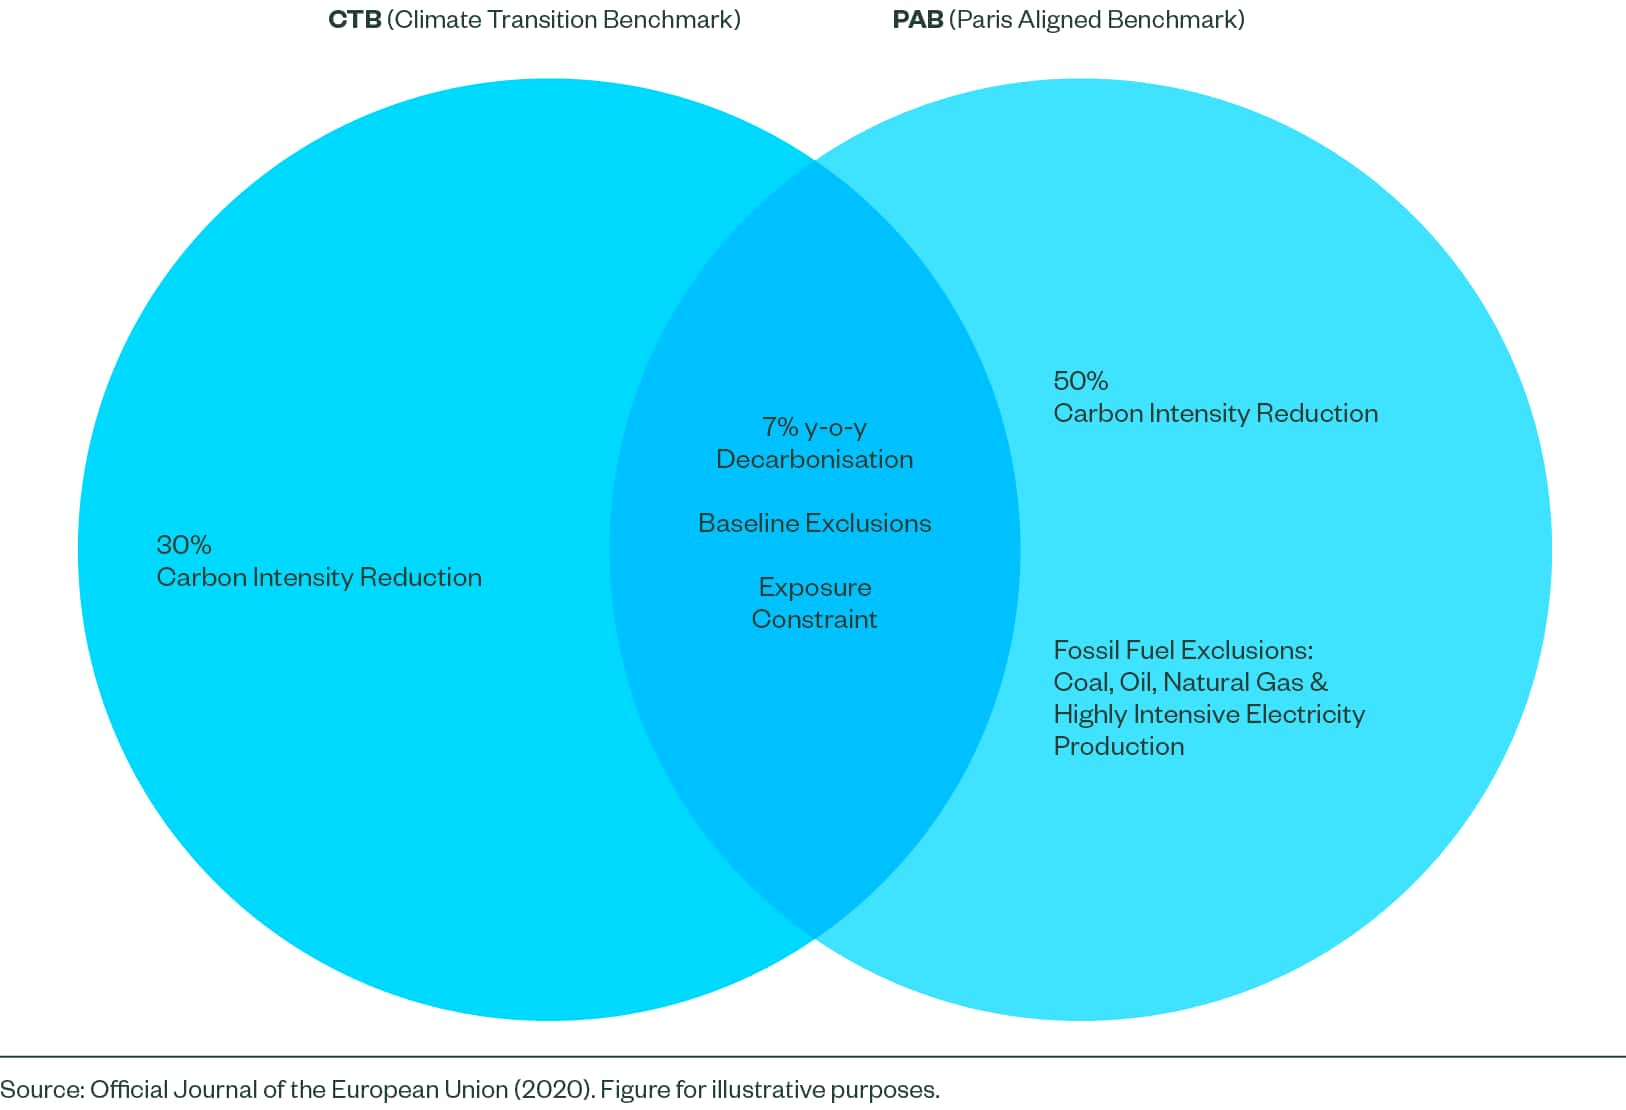
At heart, both PABs and CTBs minimum standards3 are simple: they take the estimated greenhouse gases (GHG) emissions reduction required of the planet to meet climate goals, and apply this to an index that can be leveraged within investors’ portfolios. In this sense, they are similar to each other, but they also have significant differences (see Figure 2). For further details, see EU Climate Benchmarks: Standards and Implications, and Appendix 1.
Figure 2: EU Climate Benchmark Minimum Standards for Equities
Consideration 1: Energy Divestment Versus Engagement
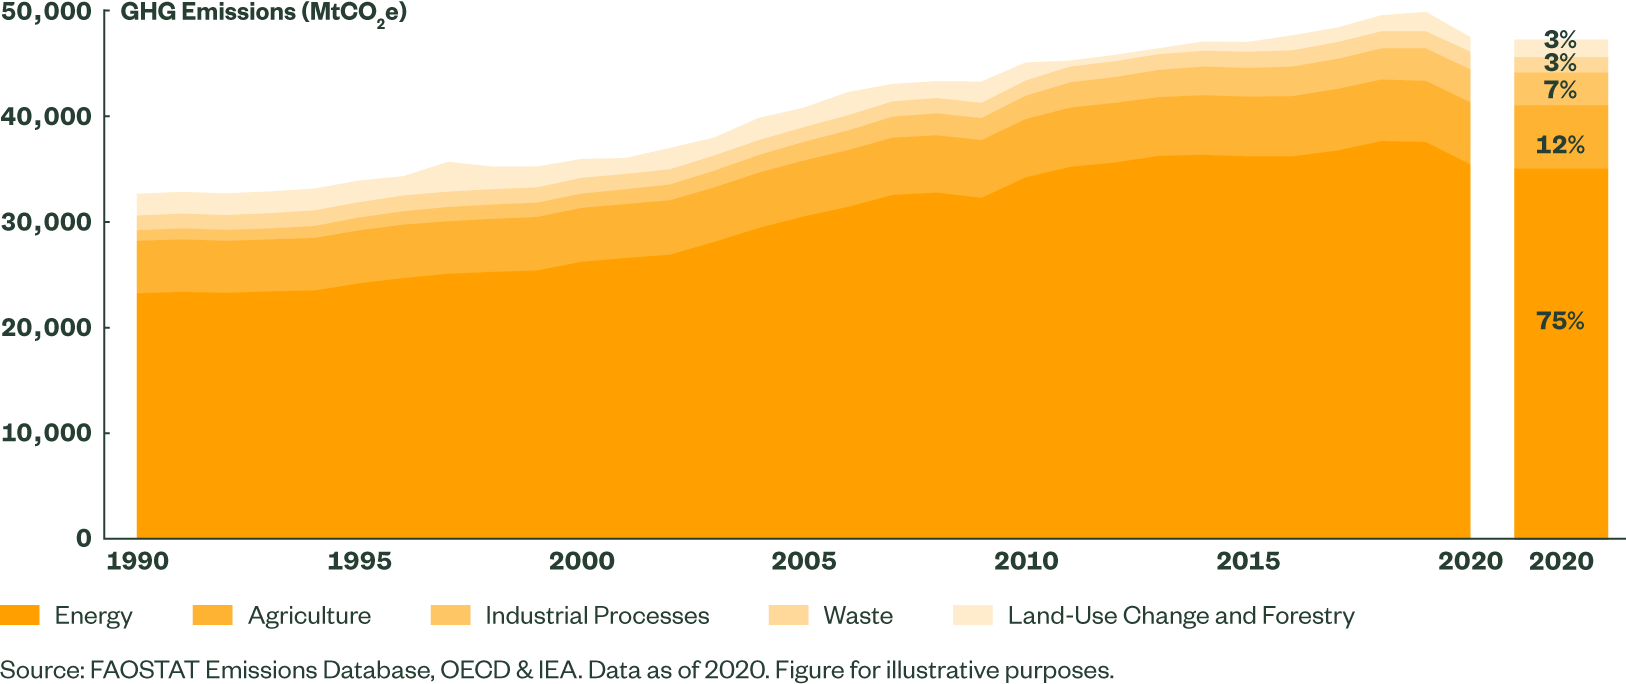
The importance of energy is undoubtable in meeting global net zero goals, with around three quarters of global GHG emissions coming from energy (see Figure 3).4 For investors with decarbonisation goals, the treatment of energy companies within portfolios is, however, less clear. There tend to be two broad alternatives: divest the fossil fuel-based energy companies, or continue to hold them and engage.5
Figure 3: Energy Accounts for 75% of GHG Emissions
Within the MSCI World Index, the Energy sector is highly concentrated in fossil fuel-based activities. The left side of Figure 4 represents each energy company, showing their proportion of revenues generated from fossil fuel activities 6, green activities 7, and those which are neutral (neither green or from fossil fuels). The vast majority of energy company revenues are fossil fuel-based. On a weighted basis, we approximate 95% of the energy sector’s revenues are from fossil fuels, while less than 1% are from green activities.
Figure 4: PABs Greatly Exclude the Fossil Fuel-Heavy Energy Sector
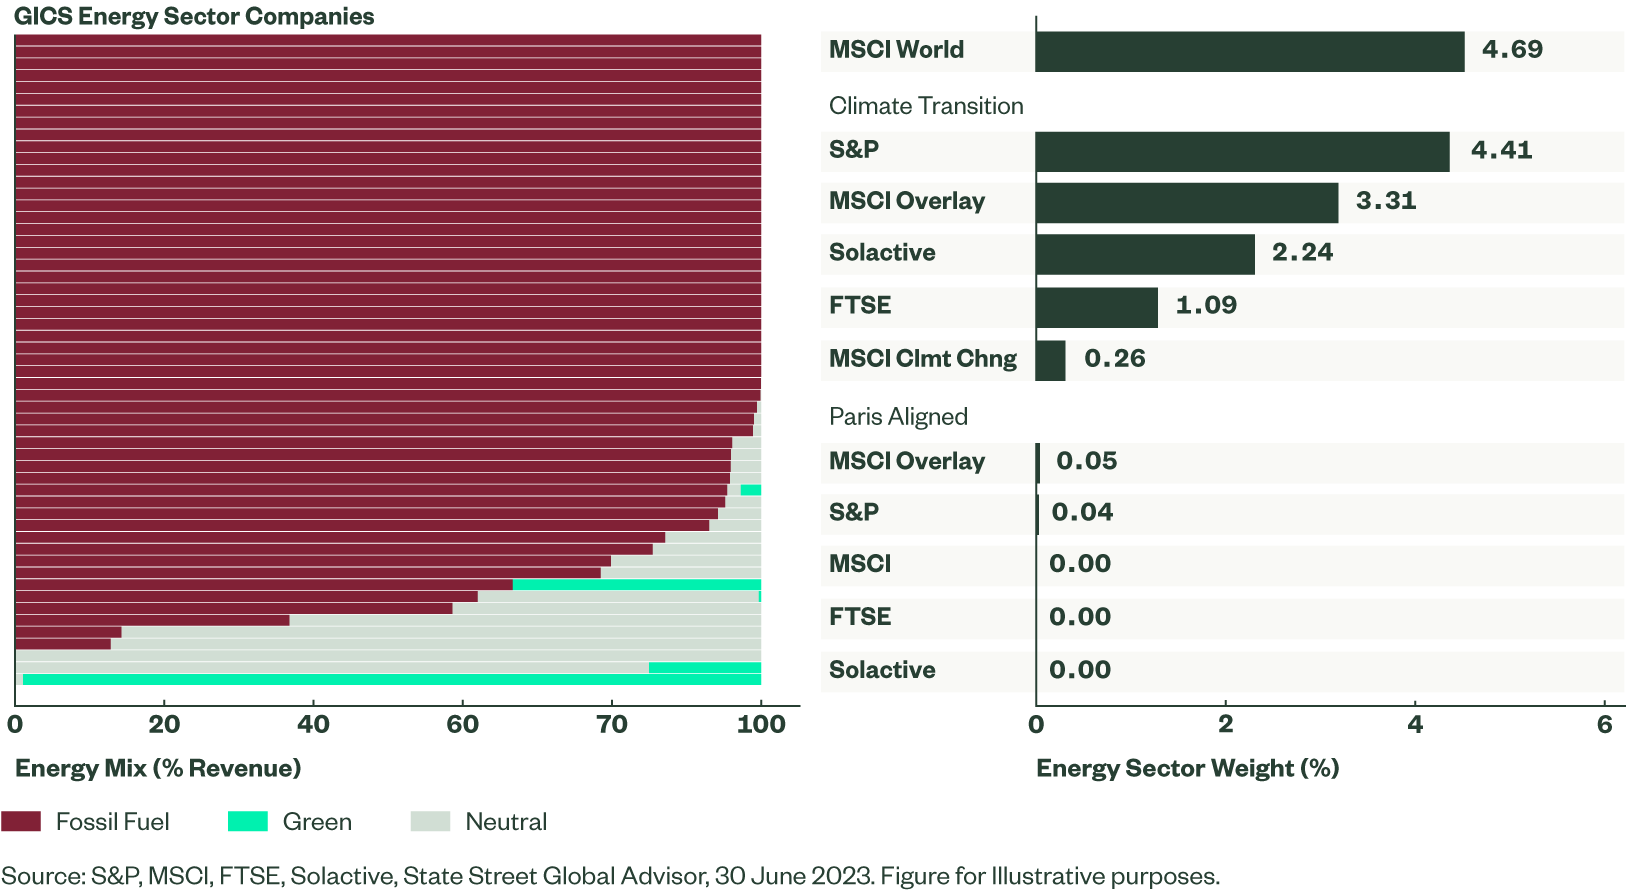
Given the fossil fuel-heavy nature of energy companies and the PAB minimum standards, current index offerings show PABs to mostly or totally exclude the energy sector (see Figure 4). There are only two companies held across PAB indices studied in this paper, with the vast majority likely excluded due to PAB exclusion thresholds of 1%+ revenue in coal, 10%+ in oil and 50%+ in natural gas. This approach may be favoured by those investors with strong beliefs around divestment of the energy sector.
Alternatively, CTBs have some weight in energy companies, albeit an underweight position of the sector as a whole (see Figure 4). Consequently, CTBs may be favoured by investors with a preference for shareholder engagement over divestment.
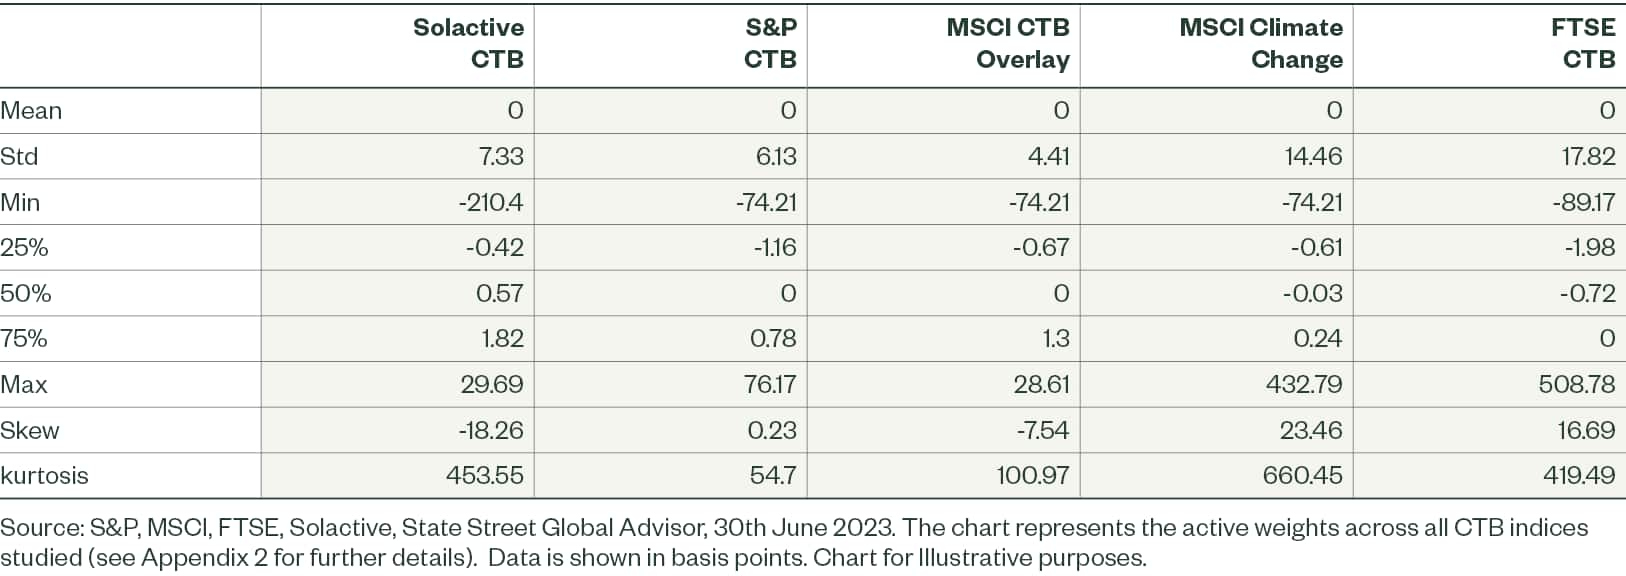
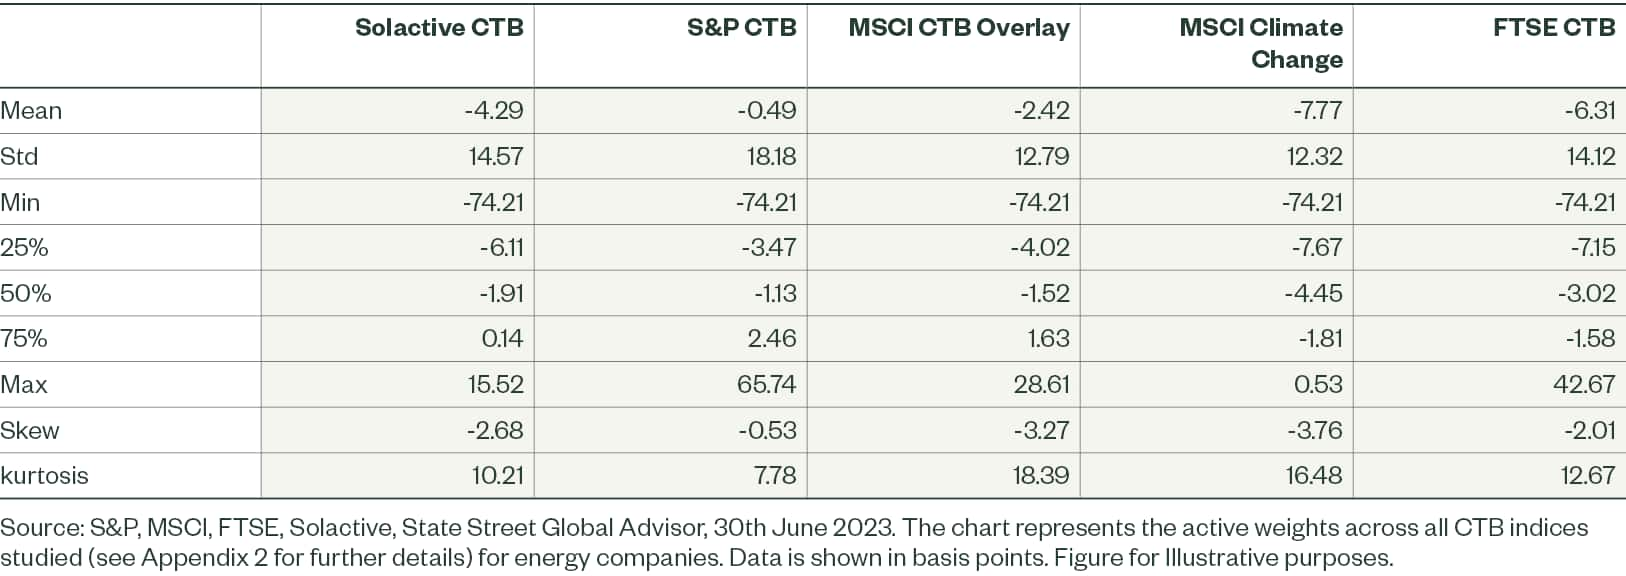
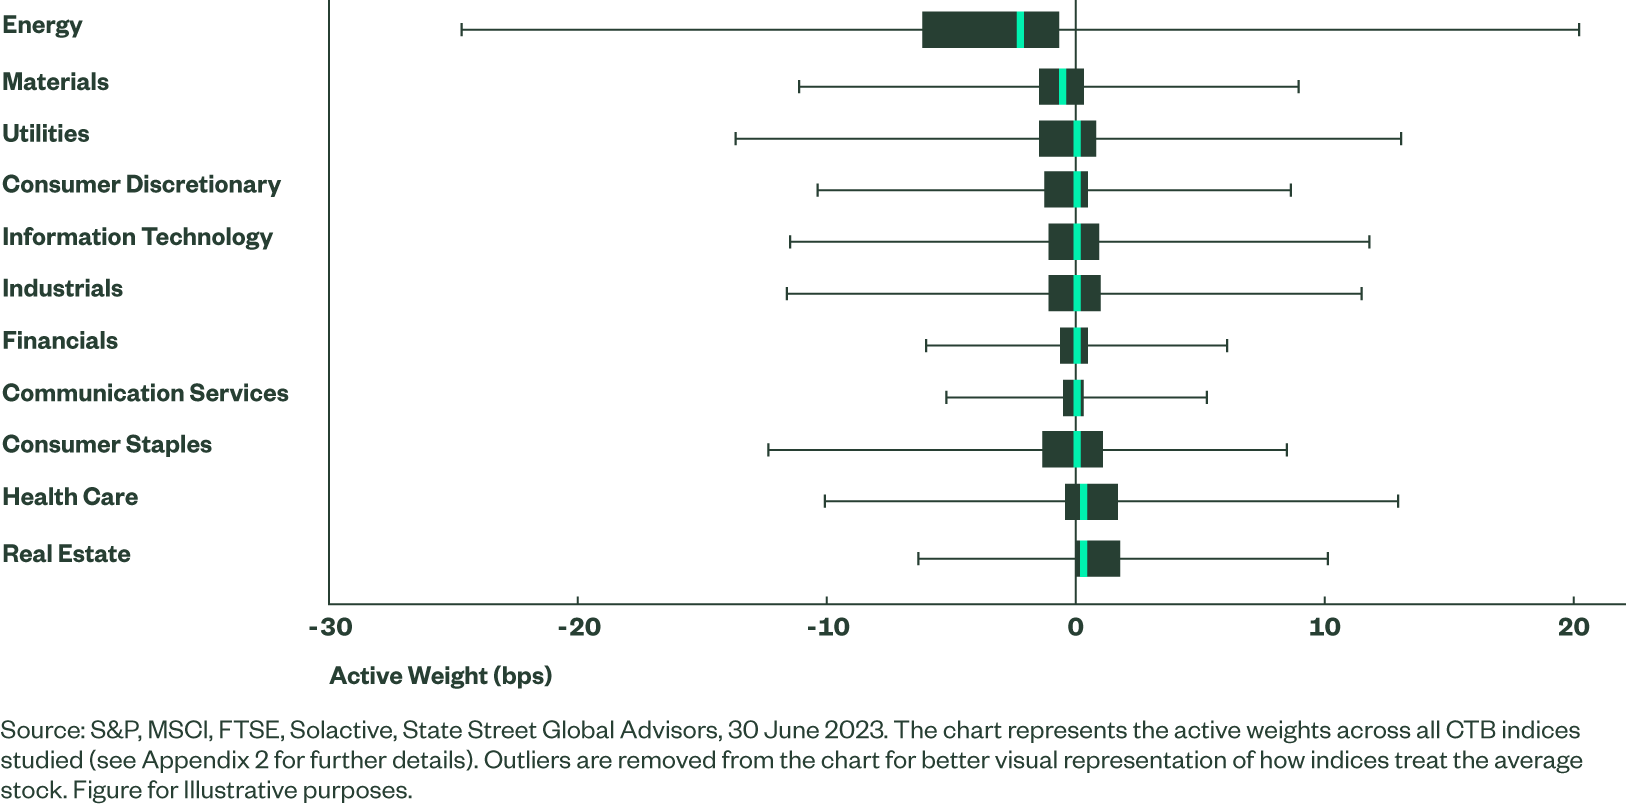
While CTBs still hold energy companies, they do not take the energy challenge lightly. CTBs heavily reweight within the sector – overweighting those which are best-in-class and underweighting those with the poorest climate credentials. We see the energy sector has the largest dispersion8 of active weights across all sectors (see Figure 5), and by a large margin.9
Figure 5: Climate Transition Benchmarks Hold, but Heavily Reweight Energy Companies
Consideration 2: Portfolio Climate Improvements Versus Tracking Error
PABs are more ambitious in their goals, requiring an initial 50% GHG reduction as the starting point for decarbonisation, along with their stricter exclusions requirements. Alternatively, CTBs have a more gradual pathway, starting with a lower 30% reduction (see Appendix 6). The greater requirements for PABs mean they are required to be more different from a standard market-cap universe than CTBs, which in turn means greater tracking error is required, assuming all else is equal. In reality, however, not all else is equal.
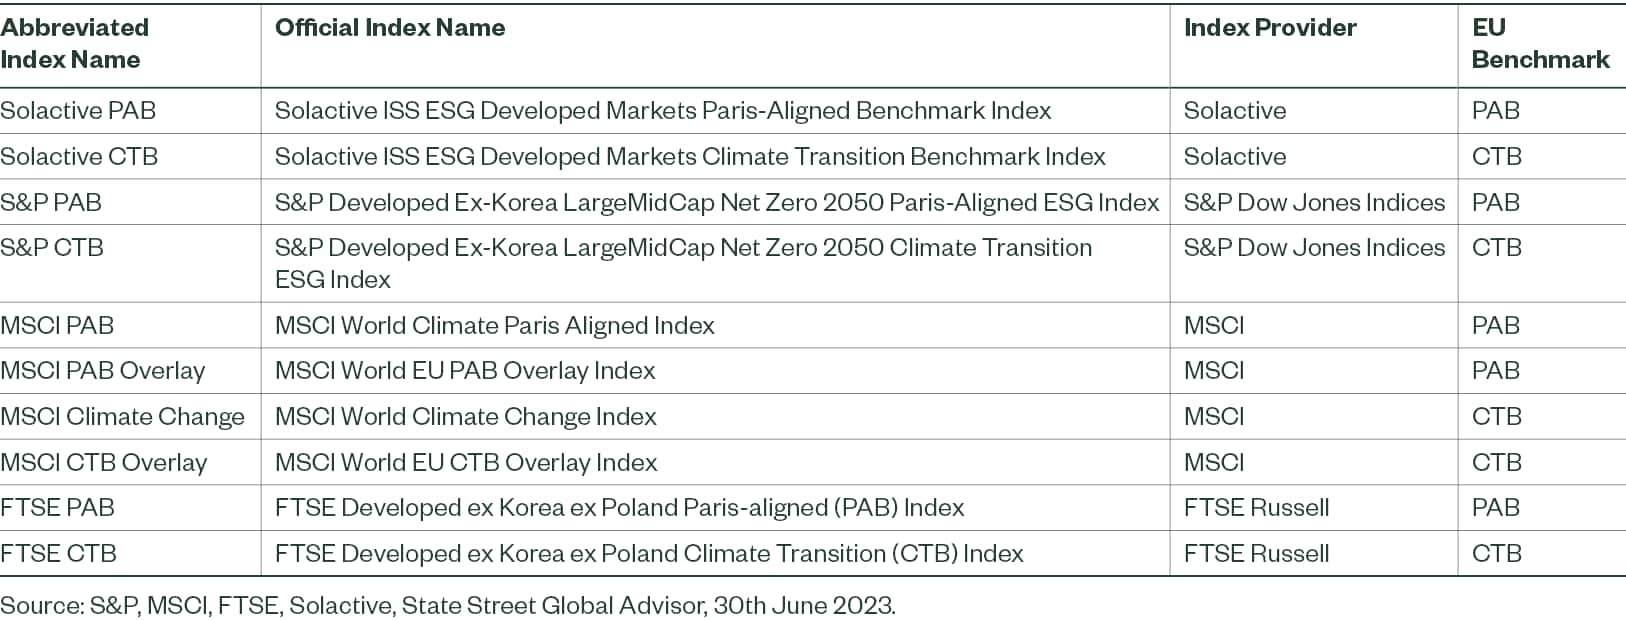
Tracking error for climate EU Climate Benchmarks, relative to the market-cap weighted market, is dictated by the regulatory minimum standards, other objectives beyond the minimum standards, and also the index construction methodology utilised – far more than only whether it is a PAB or CTB (we examine this further in a later paper). To isolate the tracking error difference (albeit imperfectly10 ) between a PAB and CTB, we compare indices from the same provider, where each pair of indices has the same index construction method and similar constraints11 (see Figure 6).
The two MSCI Overlay indices minimise tracking error subject to meeting the regulatory minimum standards. These can be interpreted as an approximation of the lowest tracking error possible while meeting the PAB or CTB label, over this period.12 Consequently, this is likely the closest comparison of the true tracking error impact of meeting PAB minimum standards relative to a CTB equivalent, of the indices assessed. Here, the PAB had 62bps greater tracking error than the CTB – over double that of the comparable CTB. Across providers, the difference in tracking error between similar PAB to CTB indices was around 20-80bps. This is the ‘cost’ of greater portfolio climate improvements, from an active risk perspective. We also see that PABs do not necessarily have a lower tracking error than CTBs, with the index construction method and additional features appearing to play a significant role.
Figure 6: Paris Aligned Benchmarks Greater Decarbonisation & Tracking Error
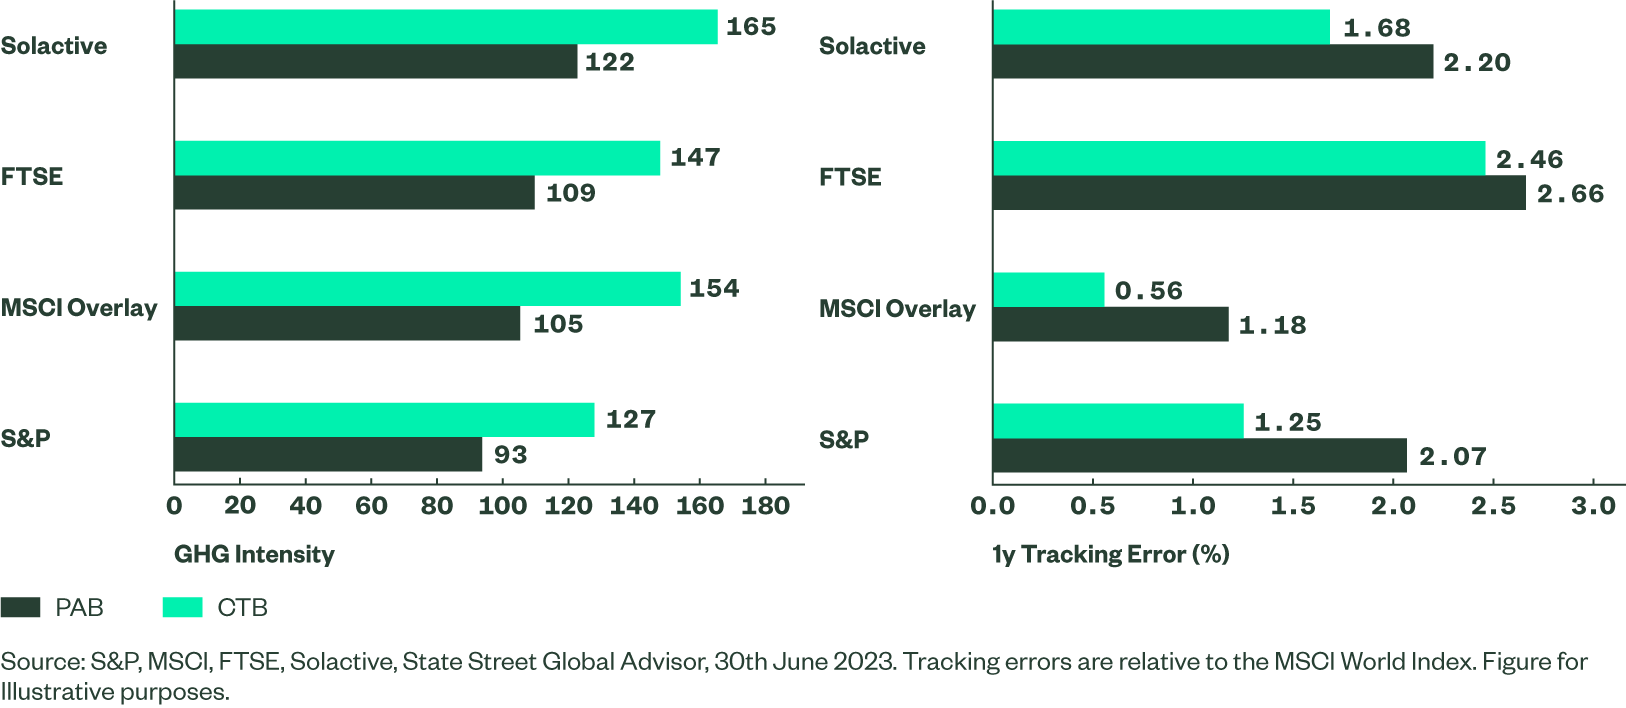
There is a trade-off between portfolio climate improvements and index targets and the tracking error incurred relative to cap weighting. This gives investors a choice of aligning with a 1.5oC pathway and net zero, with different levels of tracking error. It should also be noted that tracking error may increase over time, if the underlying index fails to decarbonise (see our paper, EU Climate Benchmarks Standards and Implications, for further details).
The Bottom Line
The EU defined two benchmarks, PABs and CTBs, to establish minimum standards for indices to align with IPCC’s 1.5°C trajectory, and net zero in 2050. When choosing between a PAB or CTB, we see two key considerations investors can use to guide their choice: views on divestment vs engagement and how they trade-off between portfolio climate improvements and tracking error.
The MSCI World’s Energy sector is largely a fossil fuel sector, which is mostly or entirely excluded within PABs due to their minimum standards. These offer a solution for investors who hold strong beliefs in divestment over engagement. For those who believe in engagement, the CTBs would likely be a more suitable option that hold energy companies, but heavily reweighted towards best-in-class energy companies.
Regarding portfolio climate improvements, PABs are more ambitious in their climate goals, but this comes with the trade-off of greater tracking error: around 20 – 80 bps more than their CTB counterparts.
