A Letter From Our CIO: Systematic Equity Update
Much of the world has changed dramatically since 2020. We are now in the fastest period of monetary contraction since the 1980s, and inflation has pressured economies globally. Against this backdrop, we believe that our disciplined investment process and newly integrated team position us well to identify market opportunities through the remainder of the year and beyond.
At the end of last year, equity markets had fallen almost 20% in response to the outbreak of war in Ukraine and a sharp rise in inflation, thereby impacting interest rates as a corollary. Nine months later with rates still elevated and the war persisting, inflation is seemingly under control and investors have adjusted to an expectation of interest rates staying higher for longer. Equity markets have gained back much of what was lost in the prior year, albeit in a somewhat concentrated rally led by US large-cap technology companies.
While market dynamics change quickly, what remains consistent is that our clients continue to look for solutions to capitalize on these changing dynamics and rely on us to support them regarding their investment decisions. In that vein, I want to highlight a trend that we have observed and share a recent organizational change that we have made to accommodate it.
Evolution of Systematic Equity
Client demand for ever more specific solutions for systematic equity investing continue to garner greater share of client assets as evidenced by the growth in Smart Beta ETFs in the US. In recent years the line between passive factor investing, sometimes defined as “Smart Beta,” and active factor investing, under the broad moniker of “Quantitative Equity,” has blurred in the sense that clients come to us with very specific risk, return, and exposure requirements. Accommodating those requirements cannot always be achieved by taking a strictly “passive” or “active” approach.
In order to best align our business with the needs of our clients, we merged in April 2023 our Active Quantitative Equity team (AQE) and our Global Equity Beta Solutions team (GEBS) to form the State Street Global Advisors Systematic Equity team, which I now lead as CIO. The combined team has 78 portfolio managers, 18 traders, and 26 researchers responsible for managing over $2.4T in US dollar assets. This total comprises assets across the full spectrum of systematic equity solutions spanning from passively managed, fully replicated third party index funds, to active, alpha-seeking quantitative equity strategies.
Figure 1 : Broad Exposures, Custom Solutions
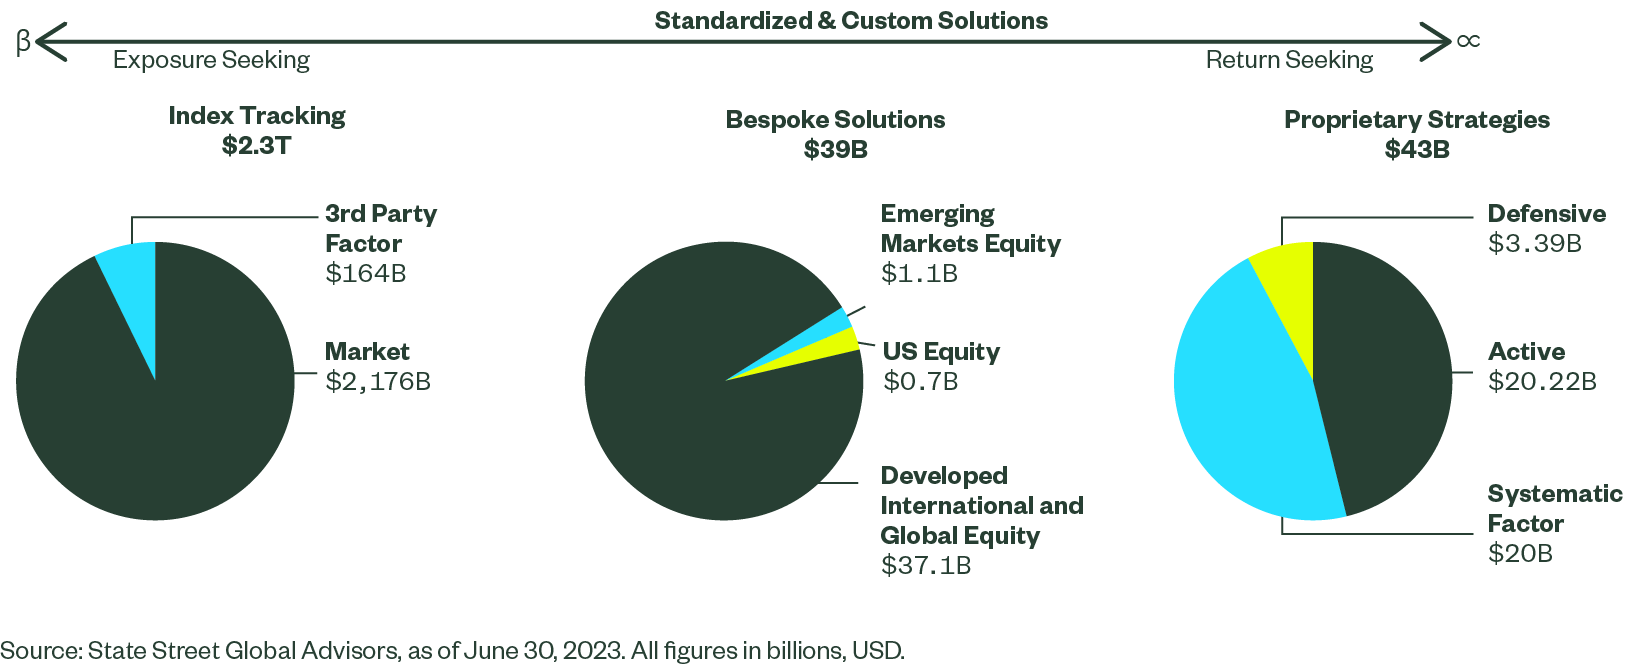
Olivia Engel, who was previously CIO of AQE, has transitioned to a new role as Head of Investment Strategy and Operations. Alejandro Gaba, formerly Head of Research for AQE is now Head of Research for Systematic Equity. Jenn Bender, formerly Head of Research for GEBS is now Head of Custom Solutions for the team. Importantly, there were no other changes to the leadership team in general aside from those already noted. This is inclusive of index and active.
Performance
In the first half of 2023 our assets under management (AUM) grew by over 10% primarily due to market appreciation. While we experienced inflows going into US equity ETFs from our intermediary channel, institutional flows were more challenged with a few very large client reallocations leading to net outflows overall in both our systematic passive and active portfolios. US defined contribution (DC) clients continue to be the driver of inflows. Strong client demand for systematic equity inputs for multi-asset and target date solutions is reflective of the broader trend towards lower fee, high-efficiency retirement solutions.
In terms of performance, 99% of our index tracking portfolios continue to track within expectations. Our systematic active strategies, the standard (non-customized) benchmark-aware strategies, as of the end of the second quarter, had a benchmark relative one-year performance that has been strong on average — with 75% of portfolios turning in above-benchmark performance over a one-year timeframe, and approximately 98% of these same standard (non-customized) benchmark-aware strategies outperforming over three-year periods.
We are pleased that several of the active strategies held up exceedingly well in the face of an extreme reversal in market sentiment in January 2023 given the concentration in the US market and multiples-driven expansion.
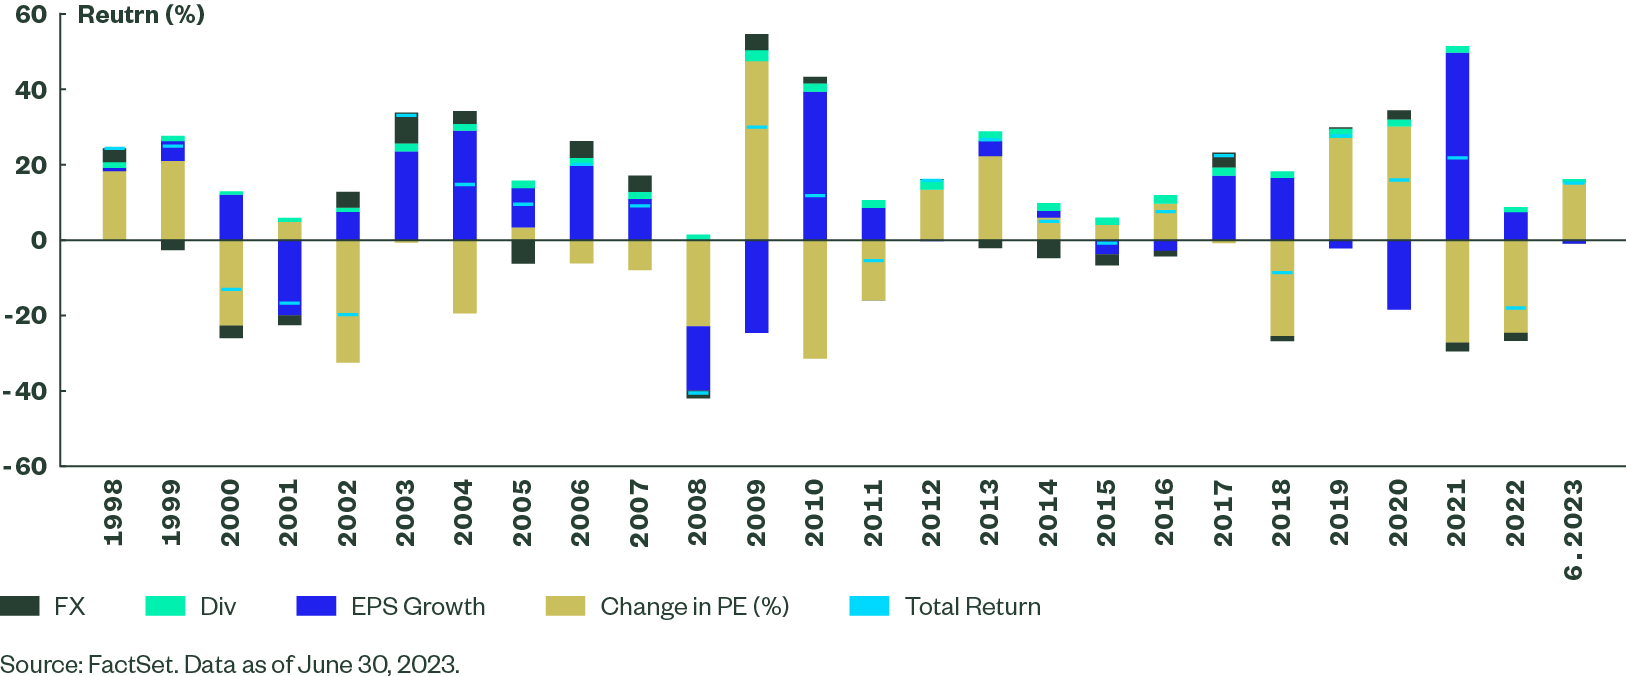
Of the 15.1% year-to-date MSCI World Index return, essentially all of that return was price-earnings multiple expansion indicated by the blue bar in 2023 (Figure 2).
Figure 2 : Return Decomposition of MSCI World Index
Stock Selection Model Performance
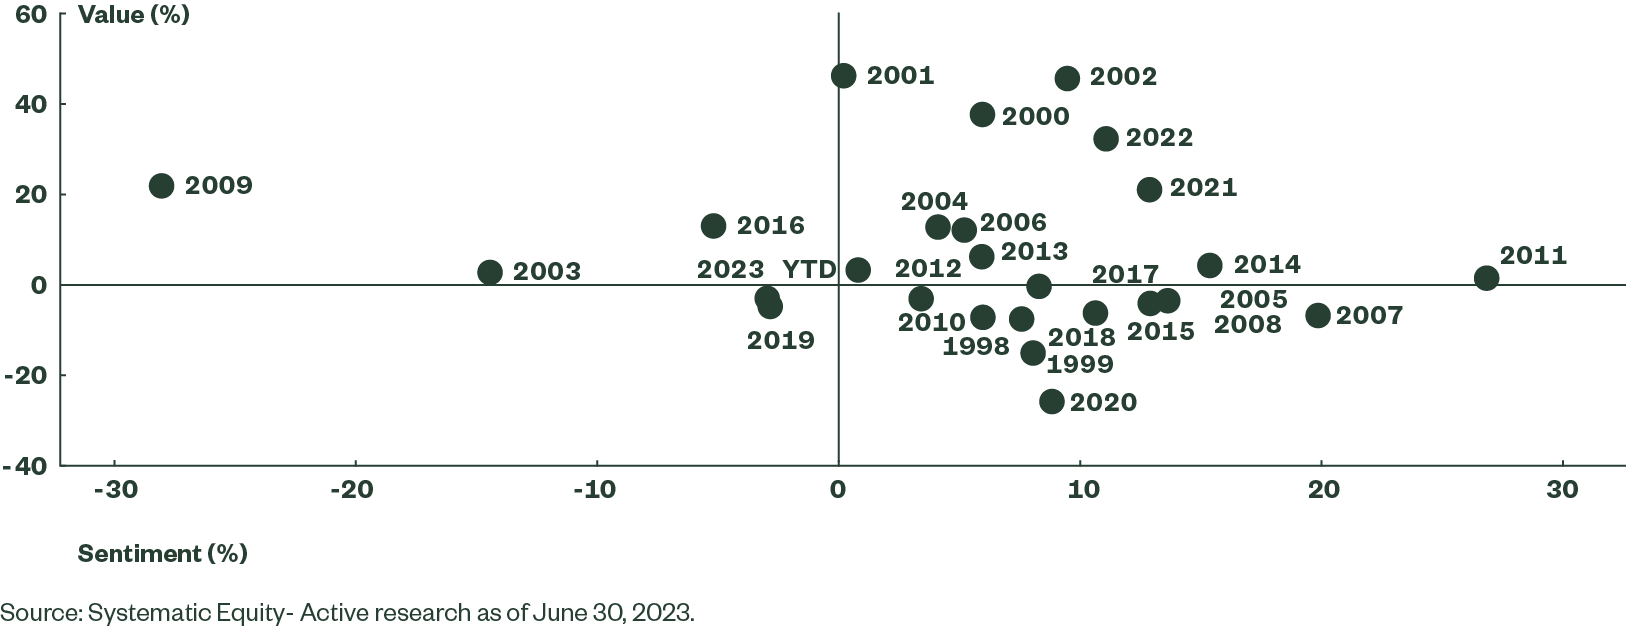
Overall, it is useful to evaluate the annualized returns of two core drivers in the stock selection model, with two strong years, 2021 and 2022, of back-to-back first quadrant (Figure 3, top right) returns for value and sentiment.
We have reverted to a similar print to 2019, although the current economic conditions are dramatically different with challenging interest rate levels and increasingly sticky inflation levels. The negative performance in January 2023 was quite rare with all drivers of the model not providing any diversification as market participants took on a highly risk-on stance. The model suffered from the short-lived banking crisis as Silicon Valley Bank and several regional banks experienced liquidity and solvency events.
Figure 3 : Developed Market Large Cap Equity Universe (Back-casted)
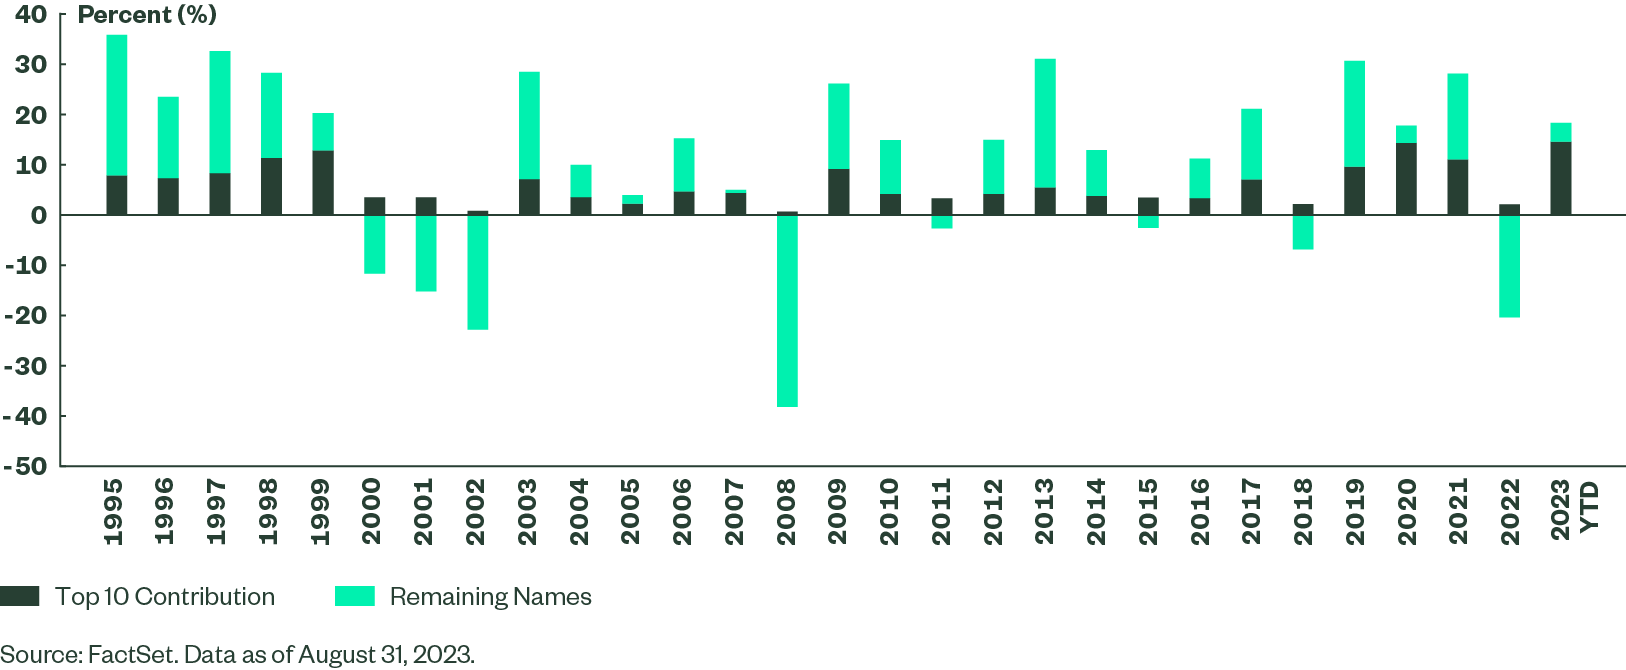
Broadly, the US equity market still exhibits a significant degree of concentration with 7-10 names driving the bulk of the performance year to date as is shown in Figure 4 below. From time to time, we have seen these concentration periods in the past such as 2020 and 1999 (Figure 5), and they are typically followed by strong bursts of value outperformance as the concentration dissipates and the reasonably valued high quality businesses tend to perform well.
Figure 4 : Year-to-Date Concentration Increases
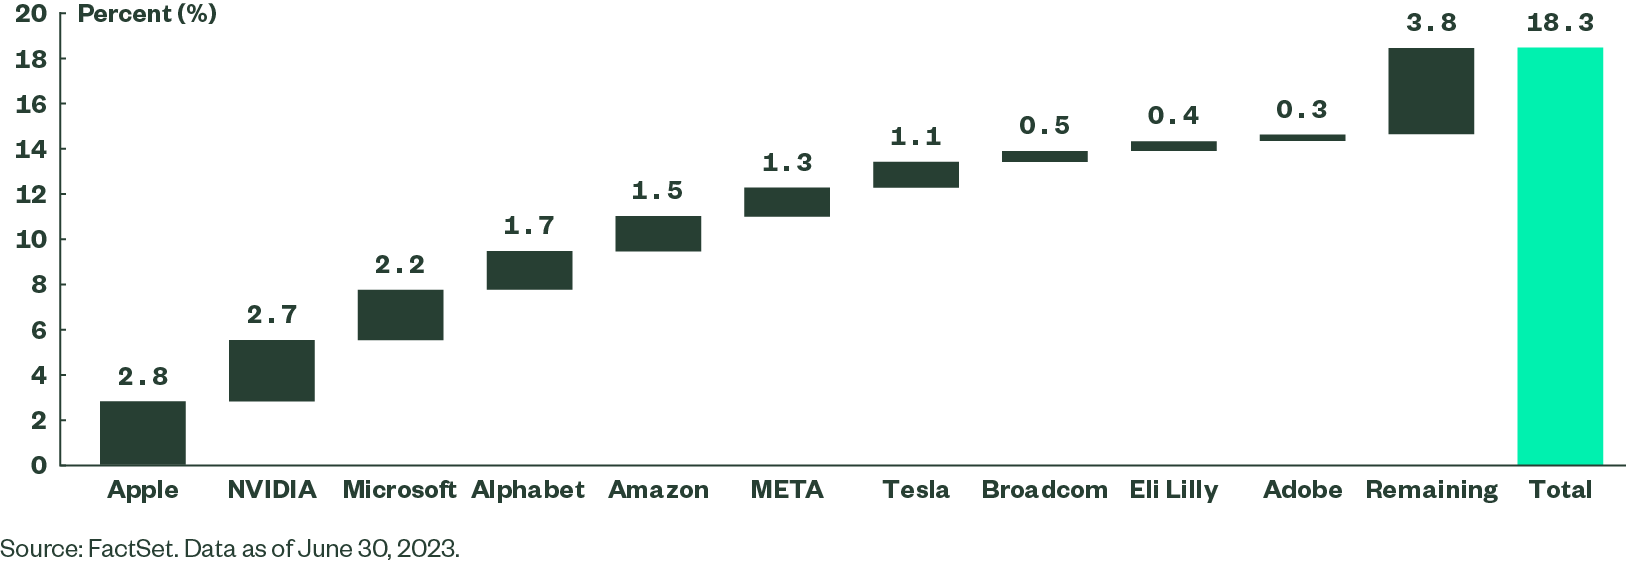
Figure 5 : Top 10 Contribution to Total Return
Evolving with Research
As it pertains to performance, our investment process has evolved further along several dimensions which I will describe below.
Continuous evolution is vital to staying relevant in a dynamically changing industry and market environment. Every research project we undertake is guided by our investment philosophy, which has three main pillars:
- Markets are not efficient due to behavioral biases and limits to arbitrage, effecting opportunities for excess return.
- Our insights are best applied to a wide investment universe with a robust and systematic investment process.
- A strong emphasis on economic rationale, vetted by rigorous research, is critical to ensuring successful outcomes.
I have provided a small cross section of research projects that have kept our research team focused for the past several months. They broadly cover the areas of intellectual property and patents, and advances in our catalyst family of signals.
Patents
The motivation for the project on patents is that generally speaking, patents serve as a proxy of a firm’s capital allocation decisions, research and development (R&D) spending, and ability to capitalize on technological innovation.
Given the uncertainty of patents on future firm valuation, both the mis-pricing and the compensation for risk suggest that firms with more patents, claims, and citations are likely to deliver higher future stock returns. In addition, we tested and verified the following hypotheses which state that:
1) Firms with higher innovation intensity tend to outperform, for a successful R&D pipeline often leads to granted patents.
2) Firms with higher patent applications citation strength generally outperform as a reward to their technological leadership and/or as compensation for their systemic risk.
3) Stock prices of firms with similar patent portfolios exhibit peer group momentum distinct from industry momentum. Focal firms’ returns exhibit a predictable lag with respect to recent news affecting their technology-linked peers given investors’ limited attention.
Catalyst Signal Breadth Expansion
The motivation for this project stems from the fact that earnings conference calls reveal a lot more information on a company’s business than just the immediate financial results. However, such information is often nuanced and hard to capture manually as there are hundreds of calls taking place across multiple geographies during the earnings season.
The hypotheses are that the positive sentiment of a conference call is associated with higher future stock returns, and furthermore, that complexity is negative. Lastly, management’s increased control of a conference call is often also viewed as a negative indicator, boding poorly for future stock returns.
Outlook
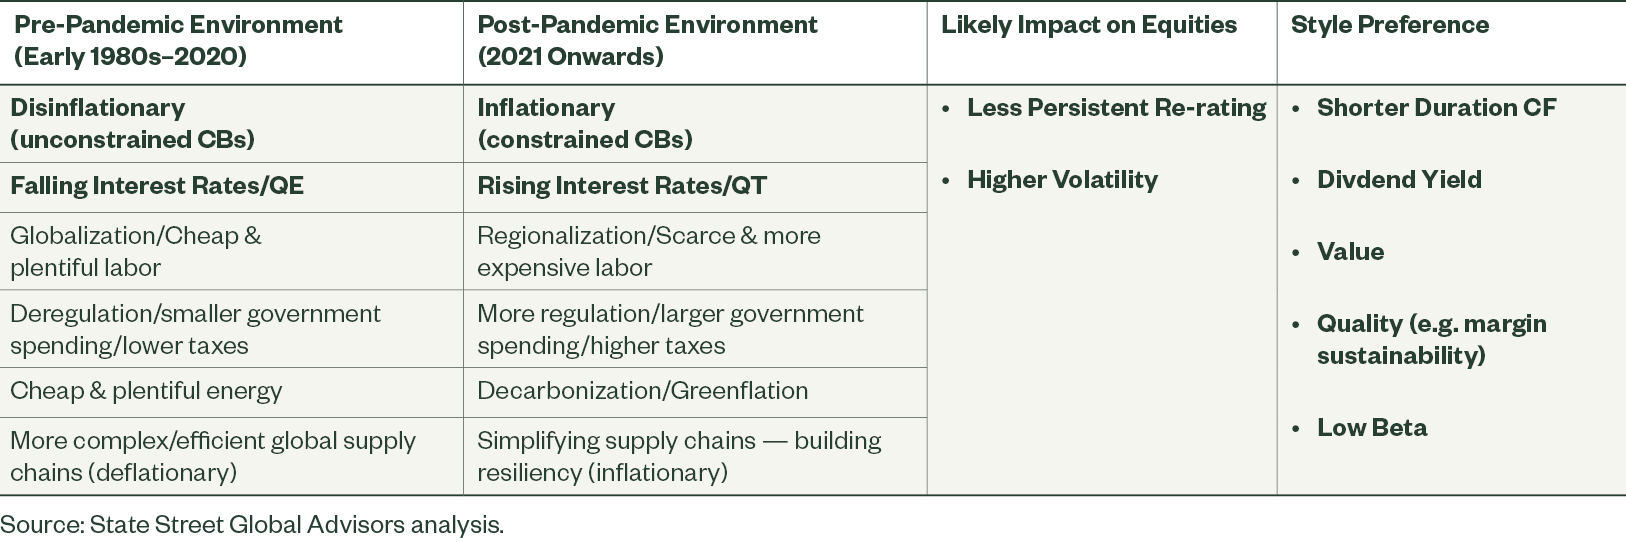
Much of the world has changed dramatically since 2020. We are now in the fastest period of monetary contraction since the Paul Volcker-era (1979-1987) and inflation has again become a problem for several economies. There has also been a push toward regionalization and away from highly efficient and complex supply chains which will further exacerbate, or at the very least, keep inflation sticky. Energy costs have risen and are likely to crimp businesses and put pressure on margins. The move to cleaner modes of energy will likely also have inflationary undertones. The one constant going forward will be more regulation as it relates to big technology, artificial intelligence (AI), banking and energy policy. Many of these shifts will alter the styles to broadly align with the Systematic Equity- Active group’s core preferences. For instance, we believe that there will be somewhat of a preference for shorter duration cash flows and a value discipline. In addition, we believe that businesses that have been disciplined and have not accumulated excessive debt over the last several years will have healthy balance sheets to weather multiple storms as credit and financial conditions potentially deteriorate into 2024. Moreover, these high quality businesses should be able to command some level of pricing power with consumers, as margins are compressed for other poorer quality firms with less brand power.
Figure 6 : Market Environments and Impact on Equities and Style Preferences
As one might expect, trade dependent countries have had a challenging year. A slowdown in trade, onshoring, and weakening global growth, are taking its toll on company earnings in 2023. Calendar year 2023 earnings-per-share (EPS) levels are expected to come in at 71.8, down -11.7% from the prior year. The majority of the decline in EPS is stemming from the big exporters namely South Korea, Taiwan, and Brazil. The sole exception is China with expected growth for 2023 optimistically projected to be over 7%. Nonetheless, the economic story in China has proven less than ideal which has kept investors shy of increasing exposures – especially given the rising regional geopolitical tensions. The other notable positive contributor to EPS is India. Viewed as the shining start of the group, India has an forecasted EPS growth at over 25% for 2023. The Indian economy is still growing strongly and the country has positive demographics (rare) and very low debt.
We expect a big recovery in emerging markets, but there are certainly some headwinds: China’s property market and debt troubles, a potential for a lackluster rebound in the Korean technology sector, or increased tensions around Taiwan, to name a few.
In China we remain focused on avoiding high risk and expensive names, and anything overvalued. High quality is critical, especially balance sheet quality with some exposure to under owned names. Some caution is recommended particularly with financials and real estate.
The Systematic Equity – Active (SE-A) emerging markets model favors India; however, one needs to be well positioned within the country. The market has benefited from some China outflows, yet the main risks tend to anchored around overvaluation.
Interestingly, there has been a divergence of factor returns between emerging markets and their developed market peers. For example, year-to-date Value (SE-A proprietary) is up over 11% on a quintile spread basis in emerging markets. In contrast, Value is down nearly -3% in developed markets.
We do anticipate this trend to persist into the near future as investors remain focused on fundamentals and are keen to avoid unnecessary risks in emerging market equities. The rest of emerging markets priced for a China slowdown.
In Summary
We believe our investment process, which uses a balanced set of attributes to select stocks, will be well positioned to capture the opportunities that markets offer in the remainder of 2023 and looking forward into 2024. We anticipate society will adjust to a new world with changing monetary and fiscal conditions as the global economy experiences contractionary forces. Furthermore, the newly integrated Systematic Equity Team allows us to capitalize on our infrastructure, scale, and expertise in order to maximize our resources and deliver the best results for our clients.