Keep a Foot in Each Camp with Convertible Bonds
Global convertible bonds fell alongside risk assets in October as 10-year US Treasury yields reached 5% for the first time since 2007, tensions flared in the Middle East, and corporate earnings yielded mixed results. Meanwhile, underlying stocks of convertible bond issuers struggled as investors remain wary of companies that may need to raise capital in the current rate environment.
Whether rates have already peaked has been hard to determine, although Federal Reserve (Fed) Chairman Powell cheered markets on 1 November, hinting that the Fed may be finished with its most aggressive tightening cycle. This significant increase in yields across the developed market curve has had its expected effect on a segment of debt issuance long ignored under the former Zero Interest Rate Policy (ZIRP) regime, namely convertible bonds.
As issuance revives and valuations are much more enticing relative to history, investors may want to consider the benefits of the asset class — as a hedge against a potential fall in equity markets and a way to stay invested should markets price in that softer landing and look for areas of growth in the portfolio.
Still Among the Best (Least Bad?) Fixed Income Performers Year to Date
After “one deadly summer”1, autumn did not give bond yields much respite. The Bloomberg US Treasury Index is now negative, with year-to-date performance at -2.7%2. The US Corporate Index (tracking the performance of investment-grade corporate bonds issued in USD) was down 1.9% over the same period.
Investors have been left with just a few options: take a bit more risk by investing in high yield or convertible bonds, or use the advantage of lower interest rate sensitivity and stay at the front end of the curve.
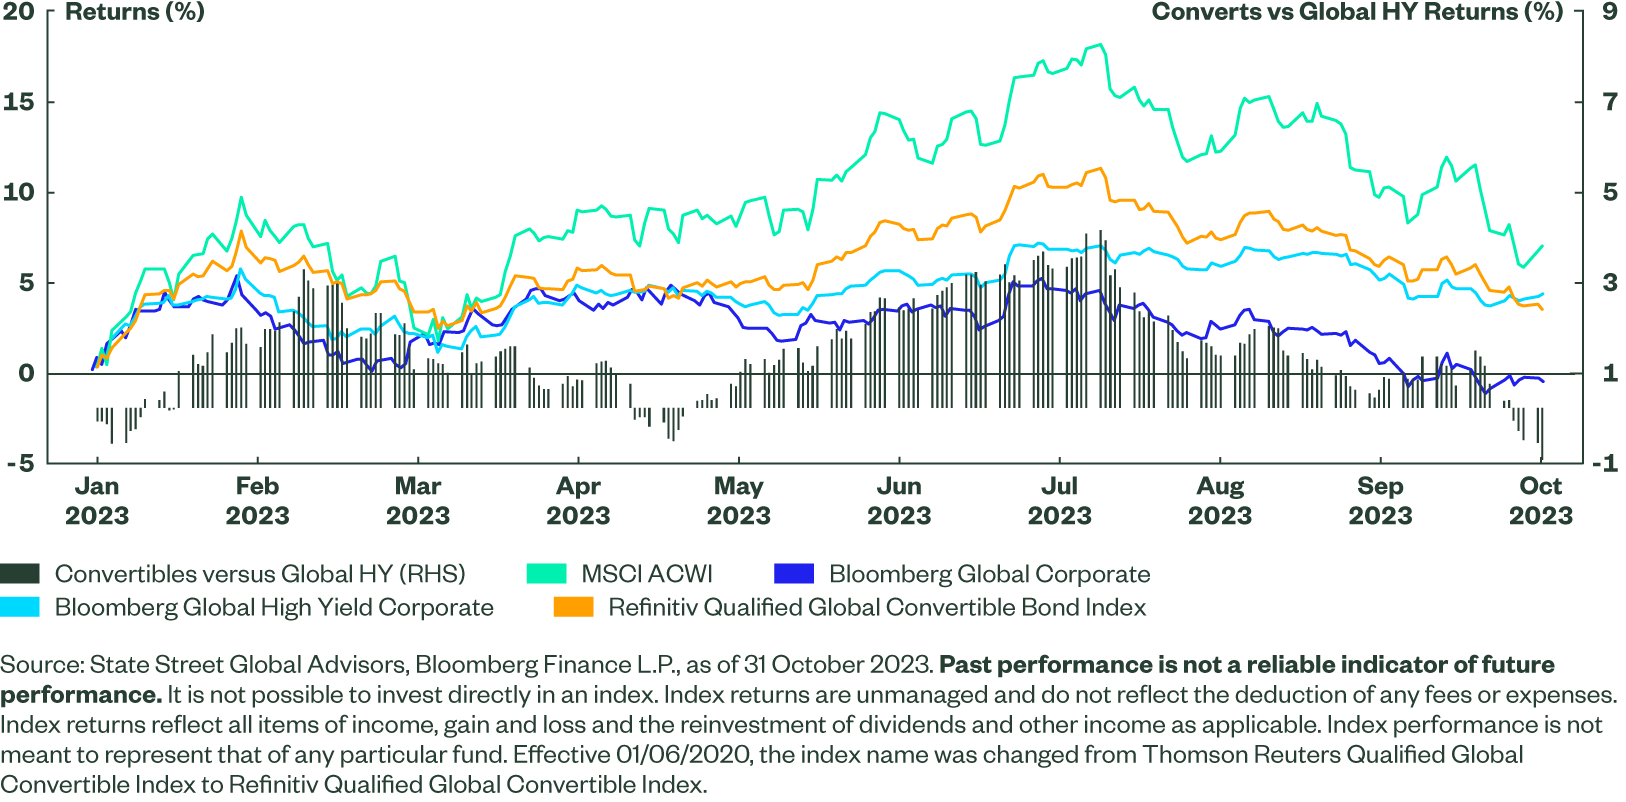
Against this backdrop, global convertible bonds returned circa 3.2%, settling nearly at the midpoint between global high yield (+5.6%) and global investment-grade corporate indices (-0.4%).
Figure 1: Cumulative Returns YTD 2023 (USD Unhedged)
Issuance Revival
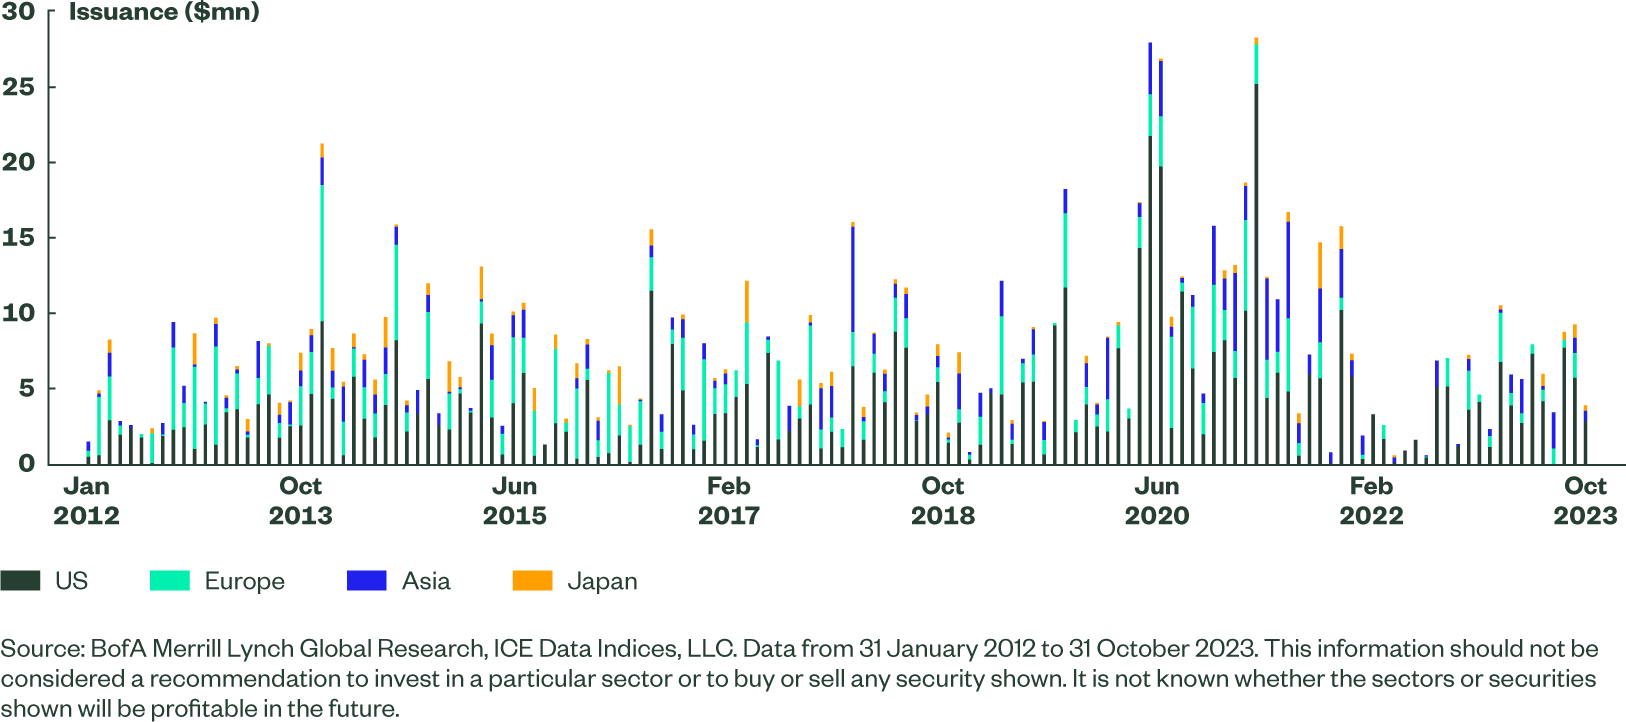
As the market reassesses the potential of higher for longer rates, new issuance of convertible bonds has begun returning to longer-term levels. As in previous periods when yields spiked higher, CFOs are realizing two things: call options can be less dilutive based on how they are offered, and convertible debt can be much cheaper. In the current environment, issuing convertible debt over traditional nominal debt may save companies approximately 3% on interest payments. With approximately US$65bn of new issuance already this year, 2023 total issuance is expected be almost twice that of 2022.
Figure 2: Monthly Convertible Bond Issuance by Region
Valuations at issuance are also better than we saw in 2021. Convertible issuers tend to have a higher growth profile than the broader market, and saw their share price fall in 2022 / into 2023 as yields kept creeping higher. This creates a potential entry point that is much more attractive from a delta standpoint.
Valuations Look Attractive Versus Long-term Averages
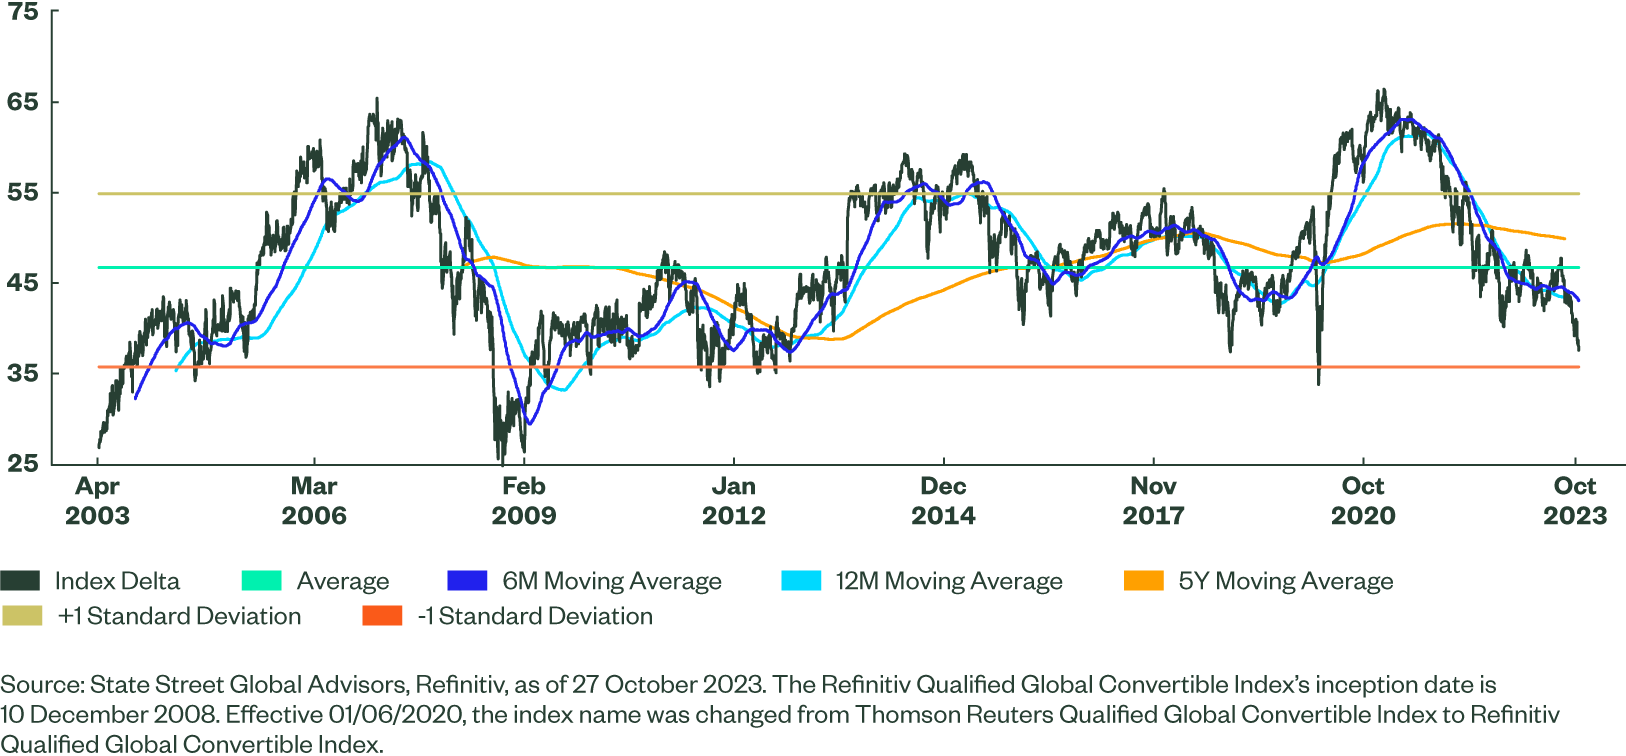
Based on deltas (sensitivity to equity prices) the Refinitiv Global Convertible Bond Index now trades lower than 1 standard deviation below its long-term average. That level was last seen during the height of risk aversion in March 2020, and in September 2022 during the mini budget crisis in the UK.While it’s hard to call the trough of the market — and there are still some risks of data disappointment — these levels have historically tended to be good entry points for long-term investors to consider.
Figure 3: Refinitiv Global Convertible Bond Index – Delta Evolution
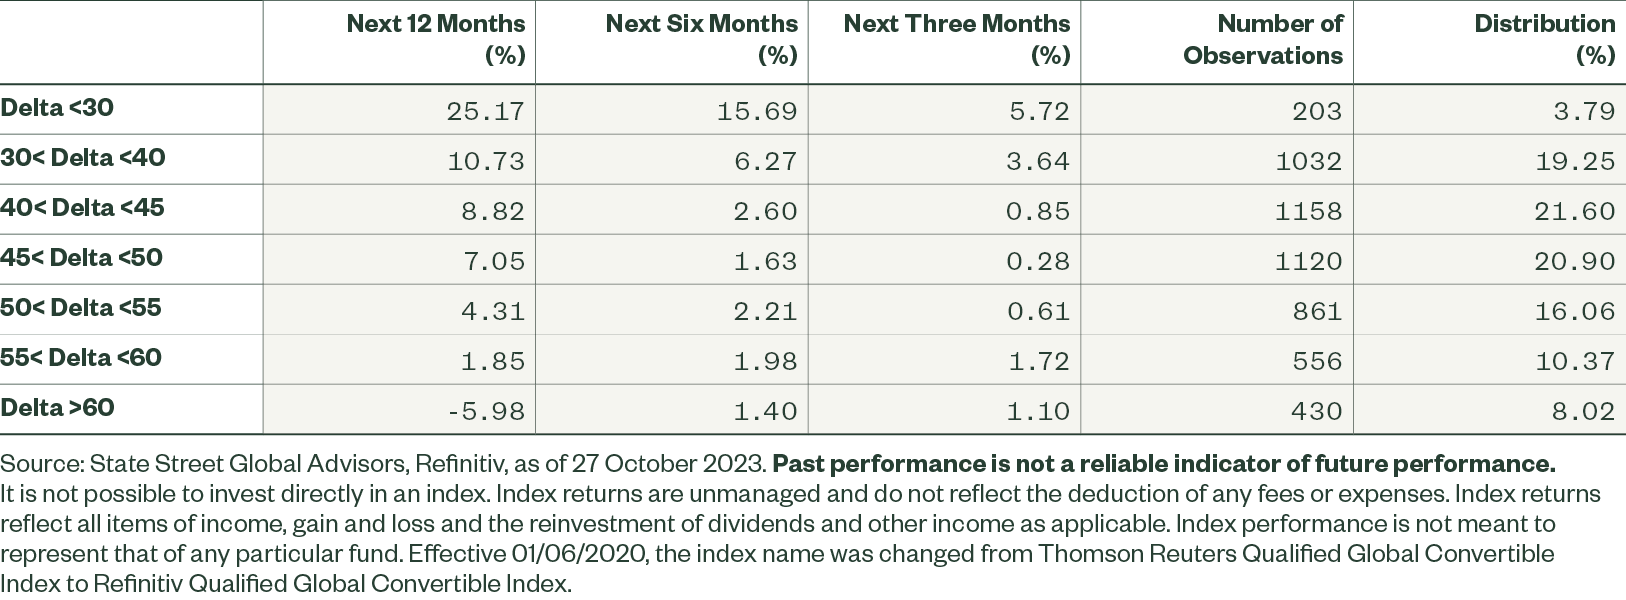
Based on 5360 daily observations and looking at the various historical performance development, on average, performance over the next three, six, and 12 months has been positive when deltas are between 30 and 40 in the index:
Figure 4: Refinitiv Global Convertible Bond Index Average Performance per Delta Band
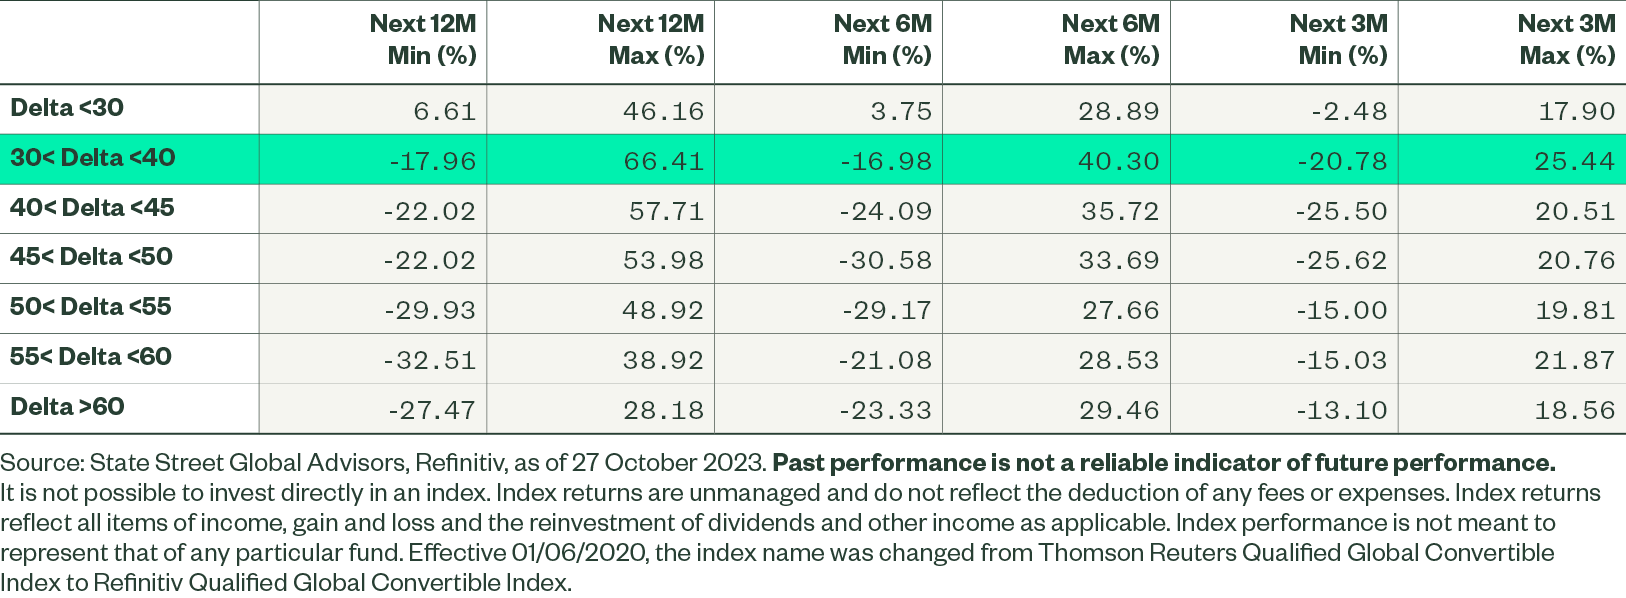
There are significant deviations from averages within these ranges and past performance cannot guarantee future returns. There have also been some further drawdowns. But as deltas are in more balanced territory now, we can also see the better skew of the asymmetry of minimum and maximum performance over close to 20 years, especially when taking slightly longer-term horizons.
Figure 5: Refinitiv Global Convertible Bond Index Minimum and Maximum Performance per Delta Band Over Different Time Horizons
Whether it’s about long-term valuation advantage, bringing convexity into a portfolio, or blending with higher yielding fixed income exposures, convertible bonds may once again have a place in investors’ toolkit. Valuations have not been that attractive for a while, making convertibles a good way to keep one foot on the “risk” pedal with an equity linkage and growth tilt while having a lower potential drawdown than equities should higher volatility burst into year end.
How to Access the Theme
Seeking exposure to global convertible bonds while also hedging currency risk?