State Street Global Advisors Market Regime Indicator: Q2 2023
The Market Regime Indicator (MRI) is a proprietary macro indicator developed by State Street Global Advisors’ Investment Solutions Group (ISG). Based on forward-looking market information, it is designed to identify the level of risk aversion/appetite in the market. The factors utilized to generate the signal include implied equity and currency volatility as well as spreads on fixed income.
ISG uses the MRI as one of the inputs into its global Tactical Asset Allocation decision-making process. The MRI is the result of over 12 months of rigorous testing by the Investment Solutions Group. The test results show that the MRI tracked historical market stress events and trading strategies based on the level of outperformance generated by the indicator. By design, the MRI signal varies between 0% and 100%. On this scale, a high level is often characterised by market tensions, such as a significant increase in volatility and a drop in risky asset prices.
We Have Identified Five Different Market Regimes
Crisis (level close to 100%) — Extreme risk aversion (‘Fear/Panic’)
High Risk Aversion (level above the average) — Aversion toward risky assets
Normal (level oscillating around the mean) — Characterized by neutral market sentiment
Low Risk Aversion (level below the average) — Appetite toward risky assets
Euphoria (level close to 0%) — Extreme risk appetite (‘Greed/Complacency’)
Figure 1: Market Regime Indicator Table

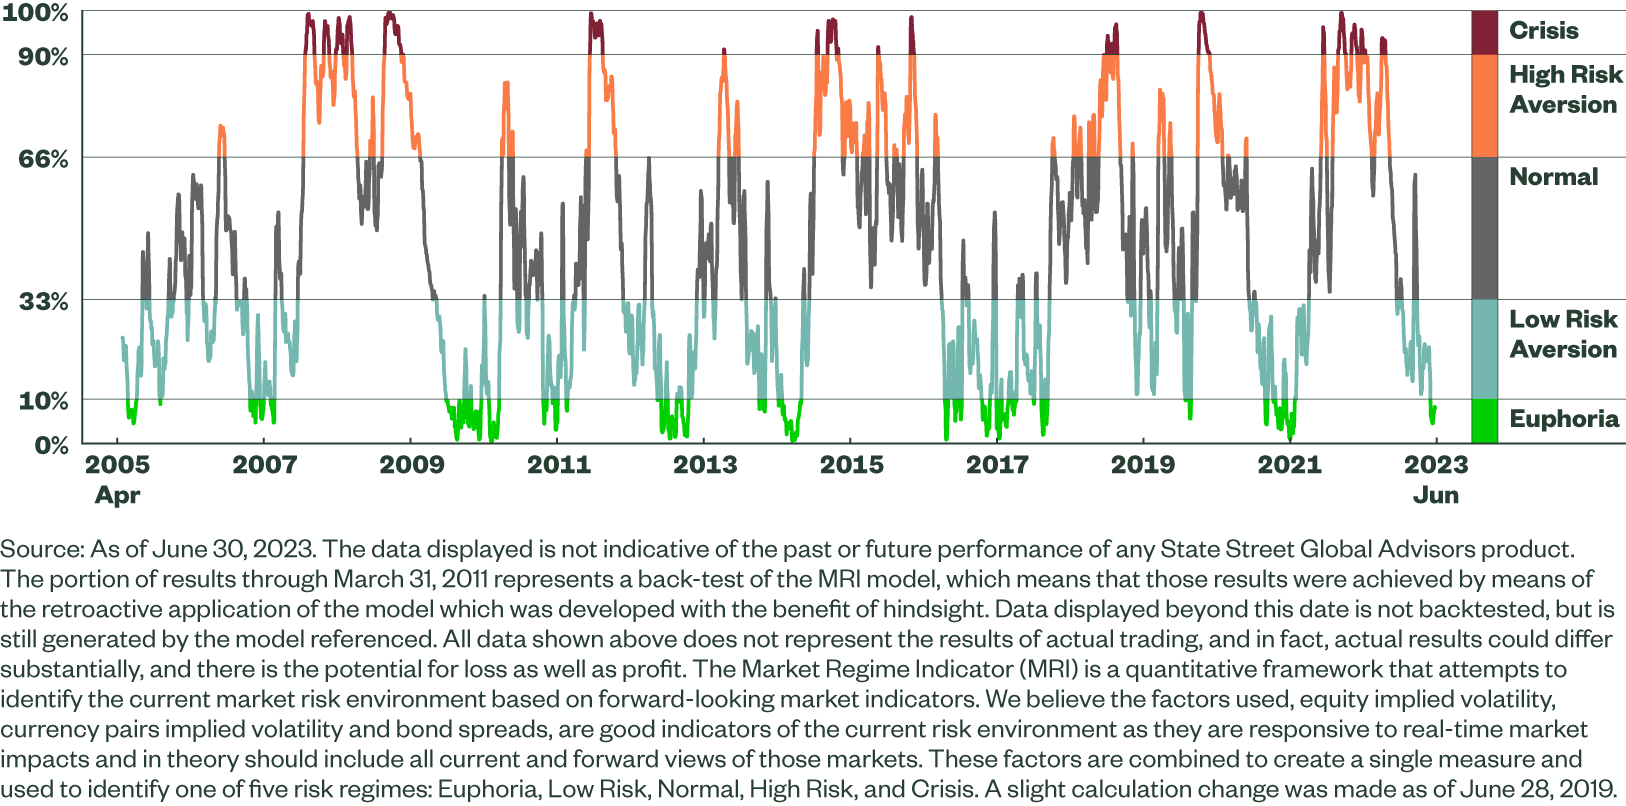
Figure 2: Market Regime Indicator (MRI) Evolution

Market Commentary
The second quarter of 2023 was generally a strong one for risk assets. Global equities gained amid enthusiasm over AI (artificial intelligence) and speculation that central banks could be closing in on the end of the rate hiking cycle. Against this back drop the MRI moved lower over the period. Having moved back into Low Risk regime at the end of March the signal moved into Euphoria regime in early June. This was the first move into Euphoria regime since the summer of 2021 at which point markets were still in the midst of the post COVID rally.
The Implied Volatility on Equities factor began the period in Low Risk regime, which given mid-March had seen the demise of Silicon Valley Bank and Credit Suisse, was somewhat surprising. Equity volatility had however reverted remarkably quickly after this episode and continued to move lower at the start of the quarter with the factor moving into Euphoria regime. Hawkish developments including the surprise move by the Bank of New Zealand to hike by a larger-than-expected 50bps, and U.K. inflation remaining in double-digits, alongside weak data that increased fears regarding a potential.
US recession, dented sentiment somewhat in early April, however equities remained resilient and the factor stable.
Early May saw the Implied Volatility on Equities factor move higher into Low Risk regime as renewed banking turmoil hit markets. First Republic was seized by regulators and then sold to JPMorgan and the KBW bank index fell beneath the lows it had reached during the SVB and Credit Suisse collapses. In addition US debt ceiling concerns moved to the fore as Treasury Secretary Yellen warned that the government could default on debt as soon as June 1. The factor moved between Low Risk and Euphoria regimes for the reminder of the month as debt ceiling concerns continued but markets grew more confident that the Fed would pause their rate hikes following a CPI release that pointed to a lasting slowdown in inflation.
In early June the factor moved lower once again into Euphoria regime as the debt ceiling deal was approved by Congress and the VIX Index (Cboe Volatility index) moved to its lowest level since February of 2020, prior to the COVID pandemic. The factor remained in Euphoria until the end of the quarter with the key market event the Fed pausing as it ended a series of 10 successive rate hikes.
The movements of the Implied Volatility on Currencies factor were rather uninteresting over the second quarter. In mid-April the factor moved from Low Risk into Euphoria regime where it remained until the end of June. This stability was however in itself very unusual and is in fact the longest single period the factor has been in Euphoria regime since 2014, and one which could of course still extend into July.
The Risky Debt Spread factor was the most elevated of the three MRI inputs over the quarter. The factor began April in Normal regime where it remained until the end of May with spreads remaining largely stable throughout the two months.
The improvement in the risk environment in June with the debt ceiling resolution and the Fed pause saw risky debt spreads tighten with both Emerging market and High Yield spreads tightening towards their lows for the year. The High Yield market was also supported by technical factors in the US where close to $65 billion of have been bonds upgraded to investment grade ratings this year, while new issue volume has remained manageable. The factor moved into Low Risk regime in early June where it closed the quarter.