Gold Nuggets: Records Are Made to Be Broken
2023 was a year of records for gold, with many new records being set or nearly matched. The average price of gold was $1,940.54 an ounce,1 a record. The year-end closing price was $2,078.40 — also a record.2 In fact, the gold price reached record levels in most currencies in 2023.
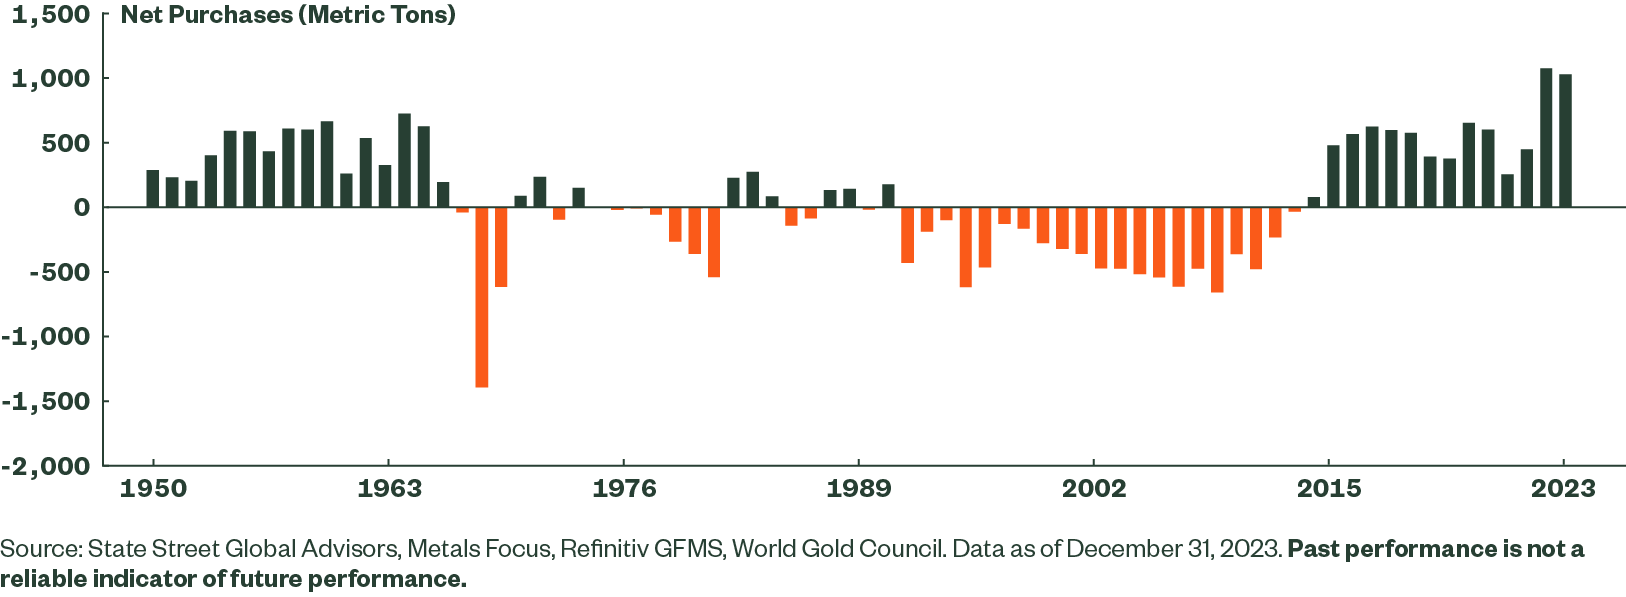
The annual Gold Demand Trends Report from the World Gold Council found that 2023 saw total demand of 4,899 metric tons (t), the highest ever recorded.3 Mine production (the primary component of supply) was at 3,604t last year, not far behind the record set in 2018 of 3,656t.4 And net purchases by the official sector, primarily central banks and sovereign wealth funds, reached 1,037t. This is just shy of the 2022 record figure of 1,082t.5
Official sector buying was a particular focus for me in nearly all of my gold commentary last year. The 2022 figure was so big, such an outlier from all prior statistics, that I felt it necessary to try to moderate investor’s expectations. I was pretty sure there was zero chance of exceeding the 2022 record in 2023. In fact, I didn’t expect purchases to get anywhere close to the 2022 record…but it’s time to eat my words!
Figure 2: 2023 Marked 14 Consecutive Years of Net Buying for Global Central Banks
Gold Supply and Demand Factors
There was widespread expectation throughout 2023 that mine production (supply) would reach a new all-time high, but it was not to be. Predictions for 2024 once again point toward a new record. While we won’t know the answer until the end of the year, it may not be the key figure to watch. Annual production from gold mining companies around the world tends to go up or down by about 1% every year. So a new record won’t necessarily imply a significant increase in supply.
On the surface, gold demand in 2023 wasn’t particularly noteworthy. Jewelry — the biggest single component of gold demand — was little changed from 2022, softening just 1% to a fraction under half the total.6 Demand in industrial and technical applications edged down 4%, and net official sector purchases, as noted above, came in 4% below the record set in 2022.7 Identified investment demand was also lower, by 15%.8 Traditional investment through small bars and coins was down 3%, as declines in the US and Europe offset growth in Asia, mainly in China. And gold-backed ETFs experienced net outflows for the third straight year. Total identified demand fell 5% below the strong performance of 2022.9
But there is an “unidentified” component of gold demand, and this element jumped from 53t in 2022 to 450t, helping to lift total demand to that record 4,899t.10 According to the World Gold Council’s report, “This number captures demand in the over-the-counter (OTC) market for which data is not readily available, changes in inventories on commodity exchanges, any unobserved changes in fabrication inventories, and any statistical residual.”11 What does that mean in practice? The quoted figure for bars and coins covers bars up to and including one kilogram, together with official coins issued by governments. The figure does not capture any investment purchases of bars in sizes above one kilogram. The likely explanation for this large OTC number could include investment buying of such bars by family offices, together with investors in the Asian region and Turkey, where there was evidence of growing investment interest.
Will Gold Continue Breaking Records in 2024?
What lessons can we draw from 2023 for 2024? Demand looks likely to continue to grow, although some of the sources may remain opaque. Official sector purchases look set to build on 14 straight years of significant net buying, primarily from emerging market countries. But the more recent interest on the part of sovereign wealth funds, which unlike central banks have no obligation to report to the International Monetary Fund (IMF), could lead to a further reduction in transparency. Nevertheless, China still holds less than 4% of the country’s huge official reserves in gold, resulting in continued over-exposure to US dollar instruments, and buying has continued in 2024.12 Poland has announced plans to increase its gold allocation to 20%, which currently sits at 12%.13 Other large buyers from last year are harder to gauge, so we’ll be watching as signals emerge throughout the year from countries like Singapore, Libya, the Czech Republic, India, and Iraq.
Similarly with investment, the growing use of the OTC market, especially by family offices in the US and Asia, is not conducive to greater clarity in the statistics. But investment looks set to continue to grow, if history is any guide. The Federal Reserve (Fed) has indicated it believes three rate cuts will be appropriate in 2024, while the markets continue to expect more than that. The last three times the Fed cut interest rates occurred during 2001-2003, 2007-2008 and 2019-2020. During those periods, the gold price rose 27%, 31%, and 12%, respectively.14 Historically, gold has offered investors diversification for their portfolios. And in some years, gold has also offered a rising price. Protection plus performance? What’s not to like about that?