EU Climate Benchmarks: Standards and Implications
The creation and adoption of EU climate benchmarks have implications for investors, warranting evaluation of the standards themselves and index solutions. This article, the first in a series, focuses on the minimum standards and investor use cases.
The EU 2018 Action Plan on Financing Sustainable Growth1 included an action point to develop sustainability benchmarks. The subsequent outcome being the Paris Aligned Benchmark (PAB) and Climate Transition Benchmark (CTB). One of the EU 2018 Action Plan’s goal was to propose measures that would enhance the ESG transparency of benchmark methodologies and create standards for the methodology of low-carbon benchmarks in the Union. As of June 2023, financial products referencing an EU climate benchmark are estimated to be over EUR 116 billion.2
The two types of climate benchmark may have important implications for investors. This paper aims to help investors understand the PAB and CTB benchmarks’ minimum standards; investor use cases of each; and potential impacts on investors’ portfolios over time.
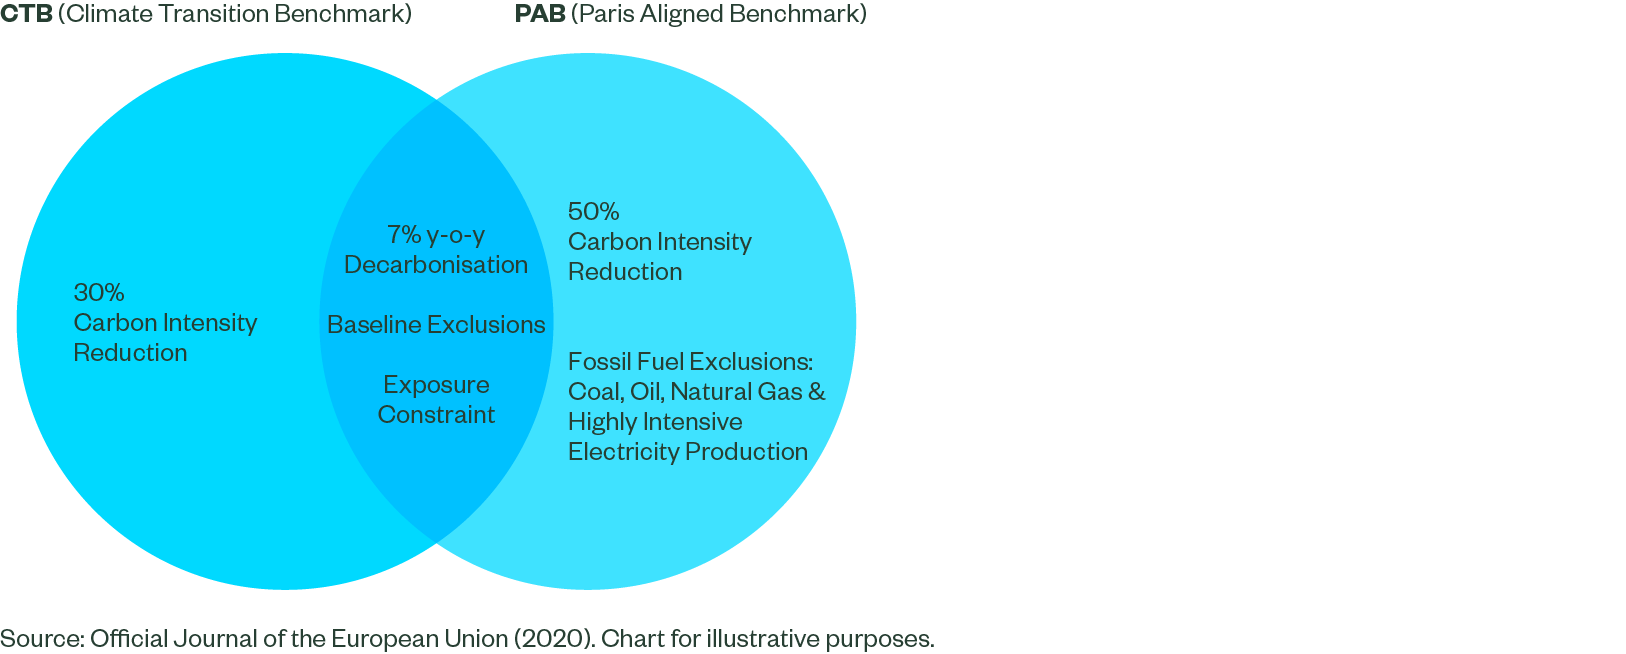
Figure 1: EU Climate Benchmark Minimum Standards for Equities

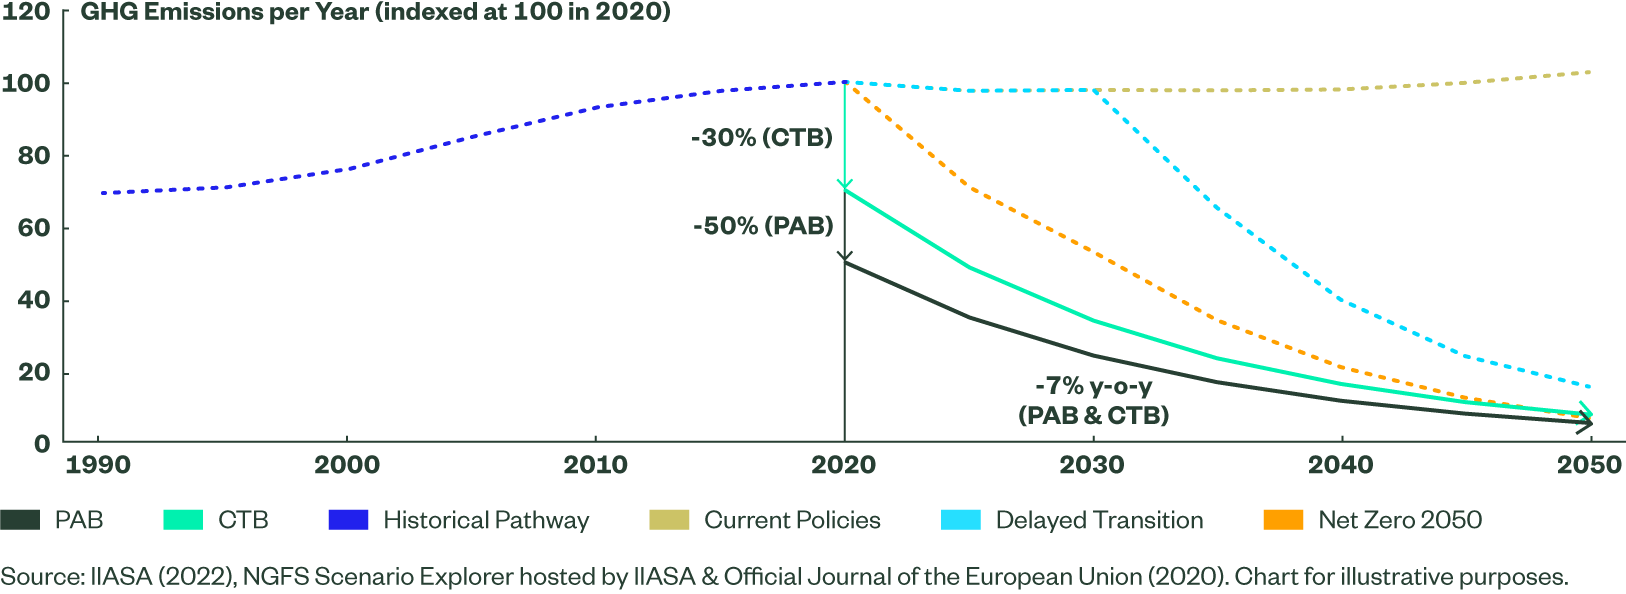
At heart, both PABs and CTBs minimum standards3 are simple; they take the GHG emissions reduction required of the planet, and apply this to investors’ portfolios, via an index. For the planet to align with the IPCC’s 1.5°C trajectory,4 and meet net zero targets by 2050, the EU calculated the planet needs to reduce its GHG emissions at 7% year-on-year from 20205 based on the world’s remaining carbon budget - a very similar figure to that calculated by the UN Environmental Programme released at a similar time.6 This trajectory is applied to PABs and CTBs, thus giving an investor the ability to align a portfolio with the IPCC’s 1.5°C trajectory, and net zero target.
PABs and CTBs also employ a set of ‘baseline exclusions,’ removing controversial weapons, tobacco and social norms violators, as well as an exposure constraint, so decarbonization goals cannot be met by simply allocating away from high climate impact sectors. Instead, the indices are forced to reallocate between and within those high climate impact sectors.7
There are two areas where PABs and CTBs differ. First, a CTB requires an initial decarbonization of 30%, while the more ambitious PAB requires a 50% decarbonization (see Figure 2). In addition, a PAB requires exclusions of fossil fuel energy at strict thresholds.
These minimum standards may help investors; by using PABs or CTBs they can, at a portfolio level, hedge against an array of climate transition risks, as laid out by the Taskforce on Climate Related Financial Disclosures (TCFD).8
Figure 2: EU Climate Benchmarks Apply What Is Required of the Planet to Portfolios

Investor Use Case
Both CTB and PABs can be used by institutions and intermediaries alike; however, the differences described above may lead an institutional investor to prefer one over another. Generally speaking, CTBs are suitable for institutional investors such as a pension fund or (re)insurance companies, whose objective is to protect assets against investment risks related to climate change and the transition to a low-carbon economy. Given CTBs also have fewer exclusions than a PAB, some investors may also prefer a CTB for engagement purposes. PABs, on the other hand, are designed for institutional investors that want to be at the forefront of the immediate transition towards a +1.5°C scenario.
Potential Implications for Investors’ Portfolios Over Time
Prior to the introduction of PAB and CTBs, many low-carbon strategies simply offered a lower carbon footprint than an underlying index. While well intentioned, if the GHG intensity of the underlying index continuously rises over time, so would the low carbon index. So while the carbon footprint of the index is better on a relative basis, it does not address carbon exposure in absolute terms. The EU climate benchmarks, on the other hand, account for this problem. The addition of a year-on-year decarbonization feature in PABs and CTBs means they not only have a lower carbon intensity than their underlying index, but also a lower carbon intensity than the index had the previous year, and at a rate aligned with the IPCC’s 1.5°C trajectory, making it more an absolutely sustainable strategy. This represents a seismic shift where climate ultimately comes first.
By being absolute in nature, an important nuance arises: the tracking error cannot necessarily be controlled to a specific level and is dependent on the GHG pathway of the underlying index. If the underlying index does not follow a 1.5°C trajectory, a PAB or CTB will need to be increasingly different from the misaligned underlying index and take on further tracking error to meet its decarbonization objective.
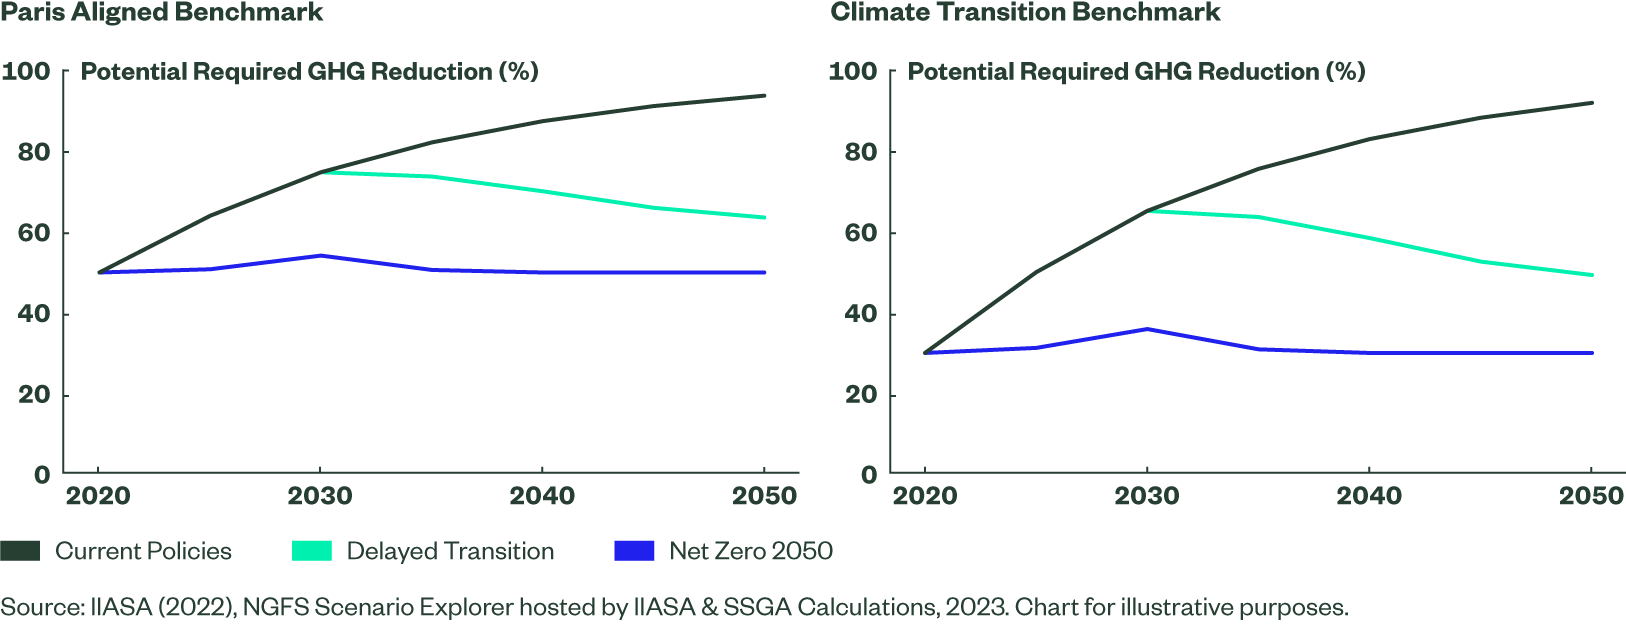
To further understand this, we can simulate the potential GHG emission reductions required in the future, under certain climate scenarios (see Figure 3). If the underlying index follows global climate scenarios, we can understand point-in-time reduction requirements in the future, based on the difference between the scenarios pathway and that required of a PAB or CTB. Under a net zero 2050 scenario for the underlying index, a PAB or CTB would maintain a similar level of GHG reduction relative to the underlying index through time – very similar to how a relative strategy would work. However, if the underlying index does not decarbonize and the current policy scenario prevails, PABs will see their GHG reduction jump from 50% in the base year to 75% by 2030 and surpass 90% before mid-century (see Exhibit 3).
Figure 3: No Broad Market Decarbonization Will Require More Relative GHG Reduction

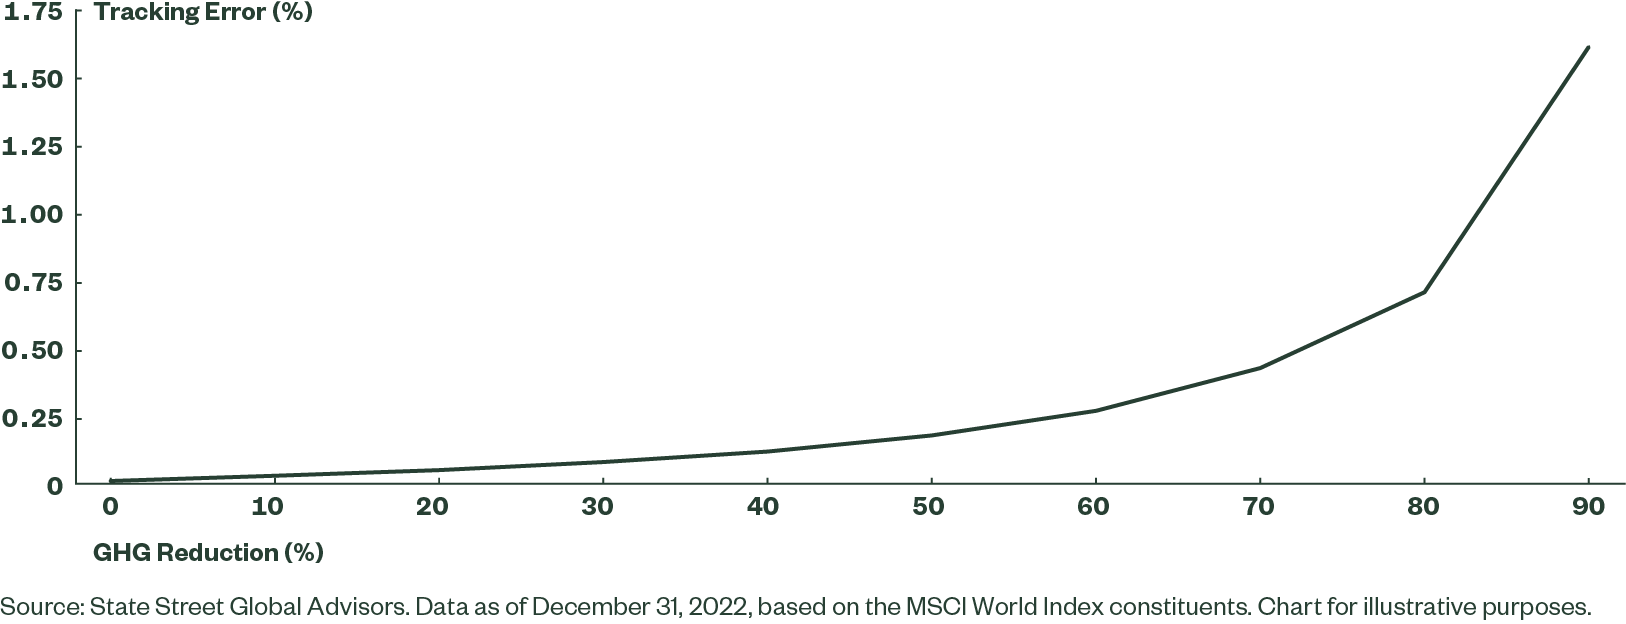
With regards to tracking error, there is a non-linear relationship with GHG reduction. A strategy or index can take on little tracking error to gain a modest reduction in carbon footprint by reweighting a handful of the most carbon intensive stocks, but as the requirement to decarbonize intensifies, there is a diminishing marginal GHG reduction per unit of tracking error.
This relationship is evidenced in third-party index research; showing a PAB index at a 50% decarbonization level shows a predicted tracking error of a little over 1%, at an 80% decarbonization, this grows a little to around 1.3% and to nearly 2% at 90% decarbonization.9 This non-linear relationship between GHG reduction and tracking error is well known, as shown within SSGA10 (see Figure 4) and academic research.11 This shows, if broad market indices do not decarbonize, their PAB and CTB counterparts will need to become more active over time – a shift from relative strategies.
Figure 4: Non-Linear Relationship Between Tracking Error and GHG Reduction

The Bottom Line
The two EU climate benchmarks, CTBs and PABs, intend to provide simple and robust minimum standards to align portfolios with the IPCC’s 1.5°C trajectory. The two are conceptually similar, with the PABs , however, being more ambitious in its decarbonization pathway and its exclusion of fossil fuel energy.
CTBs may appeal to investors aiming to protect assets against investment risks related to climate change and the transition to a low-carbon economy, while PABs may appeal to investors who want to be at the forefront of the immediate transition towards a +1.5°C scenario.
The approach and adoption of these benchmarks represent a shift in the way investors and regulators are addressing climate change. Even if the underlying index does not decarbonize in line with a 1.5°C scenario, the climate index will still reduce its GHG intensity in line with the requirements of a 1.5°C scenario. But as with any choice, there are always trade-offs. So, while the climate-first approach may help achieve more ambitious climate goals, it could come at a cost over time in the form of higher tracking error if the underlying index does not decarbonize sufficiently.