Debt Addiction and Outlook for Equities
We examine the short- and longer-term implications of sovereign debt accumulation. Historically, reducing public debt from its generational peak involves a prolonged period of fiat currency devaluation and a trend shift in steady state inflation, which could benefit active equity investors.
In this paper, we expand on a theme expressed in a recent publication “The Hard Truth About Market Volatility,”1 which argues that the large-scale build-up of debt can lead to and has indeed led to previous crises and bouts of equity market volatility.
For over a decade now, developed economies (and particularly the US) have been flooded with an unprecedented amount of liquidity via quantitative easing (QE) alongside historically high levels of government debt build-up and ultra-low interest rates.
We examine the short-term and longer-term implications of sovereign debt accumulation, and how policy makers are likely to act in order to avoid a disorderly debt crisis. In the past, debt crises typically occurred because debt service costs rose faster than the incomes that were needed to service them, and this precipitates the economy to delever.
While central banks can often help to avoid a short-term debt crisis by lowering real and nominal interest rates, severe debt crises (i.e., depressions) can occur when this is no longer possible.
With the US credit rating having recently been downgraded to AA+ from AAA by Fitch, fiscal deterioration is becoming an increasingly pressing problem. We take this opportunity to examine the most likely scenarios for unwinding the extraordinary monetary policies implemented over the last decade or so, and what that might mean for factor themes and equity market volatility.
Short-Term Outlook
Disequilibrium Conditions Mean-Revert
At present, it is important to recognize that many major economies and markets are far from steady-state equilibria (i.e., some form of balance). The two principal economic conditions that we see as being severely out of balance are:
- Demand and supply – Spending should be balanced with the economy’s output and capacity
- Debt growth vs. income growth – Credit growth that is not too high or too low relative to income growth
The closer an economy is to being in a balanced state, the easier it is to fix problems and the lower the volatility of markets. The further away an economy is from a balanced state, the more painful it is for problems to be fixed and the higher the volatility of markets. While conditions can diverge significantly from a balanced state in the short run, over the long run economic swings and market volatilities will ensue, driving changes toward equilibrium being reached sooner.
Today, we are faced with significant levels of imbalance in developed market economies that are difficult to resolve; most notable is the divergence between demand (nominal spending) and supply (economic output). The current high levels of nominal spending were triggered by the unprecedented liquidity injection and the fiscal debt build-up during the COVID-19 pandemic, which have outstripped the ability of developed market economies to produce more, leading to an inflationary overshoot. Unsurprisingly, policy makers are left with no appetite to inject more stimulus into the economy and are now forced to engineer a broad economic slowdown to rein in demand.
The path toward a more balanced economic state has impact on financial markets. In most developed regions, the excessive debt accumulation over the previous decades that created the large economic imbalance today has already begun to reverse. The combination of central banks raising interest rates, draining reserves and banks tightening lending standards, in addition to other fiscal policy conditions, has combined to reduce the flow of money to markets and economies – causing significant market volatility.
Figure 1(a) and 1(b) show the sharp liquidity drain and the more constrained capital conditions in the US and Europe. Currently, the negative impact on spending and income has yet to be fully realized.
Figure 1(a) and 1(b): Liquidity Withdrawal at the Fastest Pace on Record
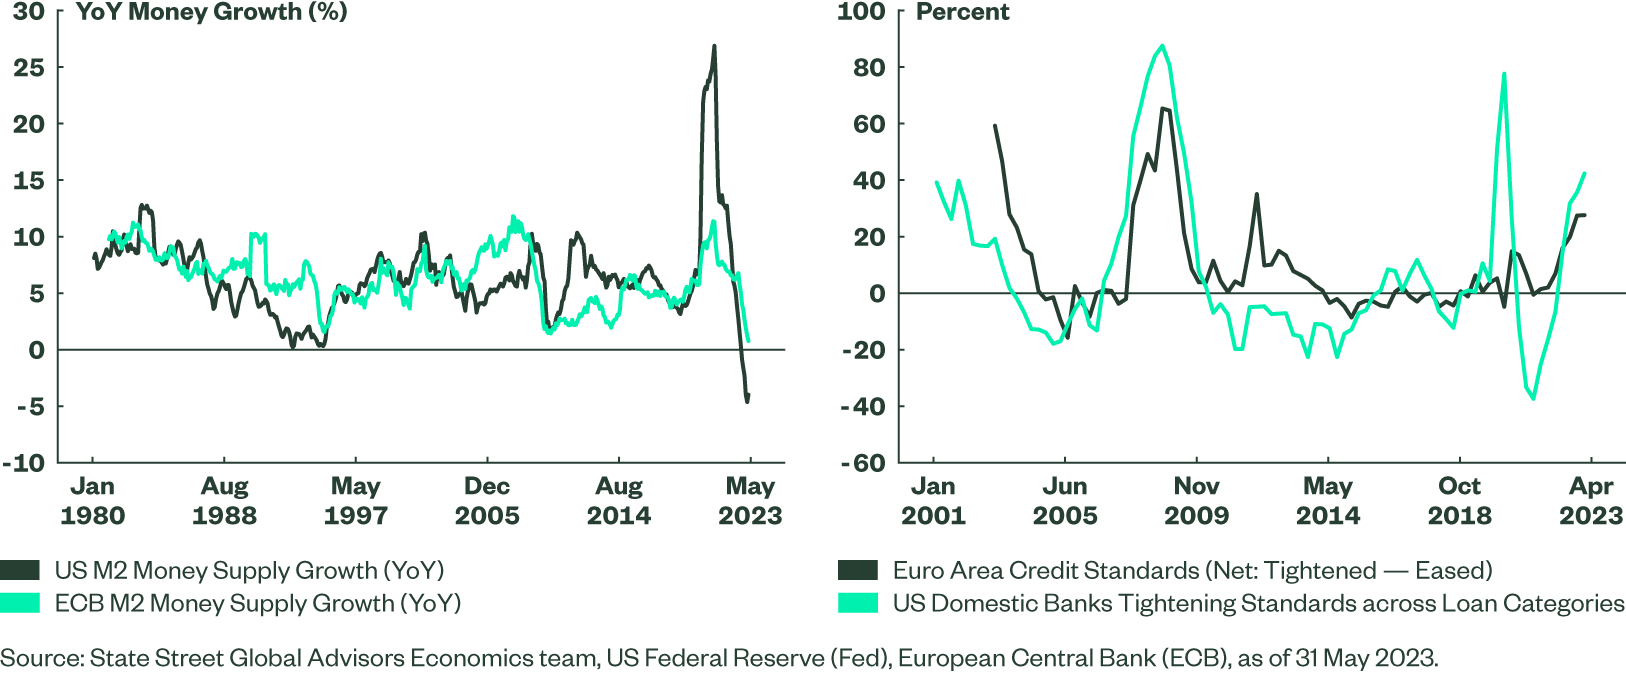
We foresee more economic damage and market volatility stemming from the lagged impact of tighter monetary policies over the next year or so. Historically, nothing easy or pleasant has been usually associated with episodes of liquidity withdrawal as intense as the one that the global economy is now experiencing. While today’s disinflationary episode is likely to moderate further, given slowing demand and normalizing supply chains, secular changes in the global economy are complicating the fight against inflation. As we mentioned in “An Overview of Secular Trends,”2 the confluence of inflationary and disinflationary factors, alongside uneven lead-lag effects of monetary and fiscal policies, is now sowing the seeds of economic instability ahead.
Impact on Markets
Governments and central banks rely on monetary and fiscal policies to deal with excessive inflation and balance demand and supply. Their success in bringing inflation down in a timely manner, unfortunately, has been mixed due to external factors that are difficult to predict and control. Prior periods of inflation in developed markets typically come in waves and do not simply retreat in a linear way. Multiple inflationary spikes are common for a variety of reasons, including changes in labor policies, demographics, energy dynamics and inflation expectations.
Historically, the path toward normalization from higher inflation regimes has typically brought higher market volatilities and contracting valuations. Volatility can rise because of macro forces or because of market factors. From a macro perspective alone, periods of broad disinflation like the one we are experiencing now have historically been observed alongside higher unemployment (Phillip's Curve), slowing growth (Okun’s Law) and higher market volatility.3 Further, varying degrees of policy intervention can result in a greater dispersion of outcomes – depending on region, sector and industry. For example, cyclical industries tend to suffer disproportionally more during a sustained period of tighter financial conditions as earnings upside and investor sentiment are constrained.
From a market perspective, the current equity valuations are too optimistic and are not reflecting risks posed by the ongoing restrictive monetary policy. The MSCI World Index is currently trading at 17.3x – a 17% premium to long-term history;4 US non-tech sectors are also trading at ~17x (vs. the 15x long-term median), while tech valuations are back to their all-time highs (27x). The combination of high valuations, relatively slow profit growth, tight financial conditions and reasonably priced alternative assets (e.g., bonds) suggests that investors risk being overconfident of a recovery regime, and that a flat but volatile return for equities is likely in the short term. The risk of a mild recession would bring with it more equity market downside. In a hard landing scenario, history suggests that equity market returns could deteriorate even after policy makers begin to cut interest rates.
What If Policy Makers Cut Interest Rates?
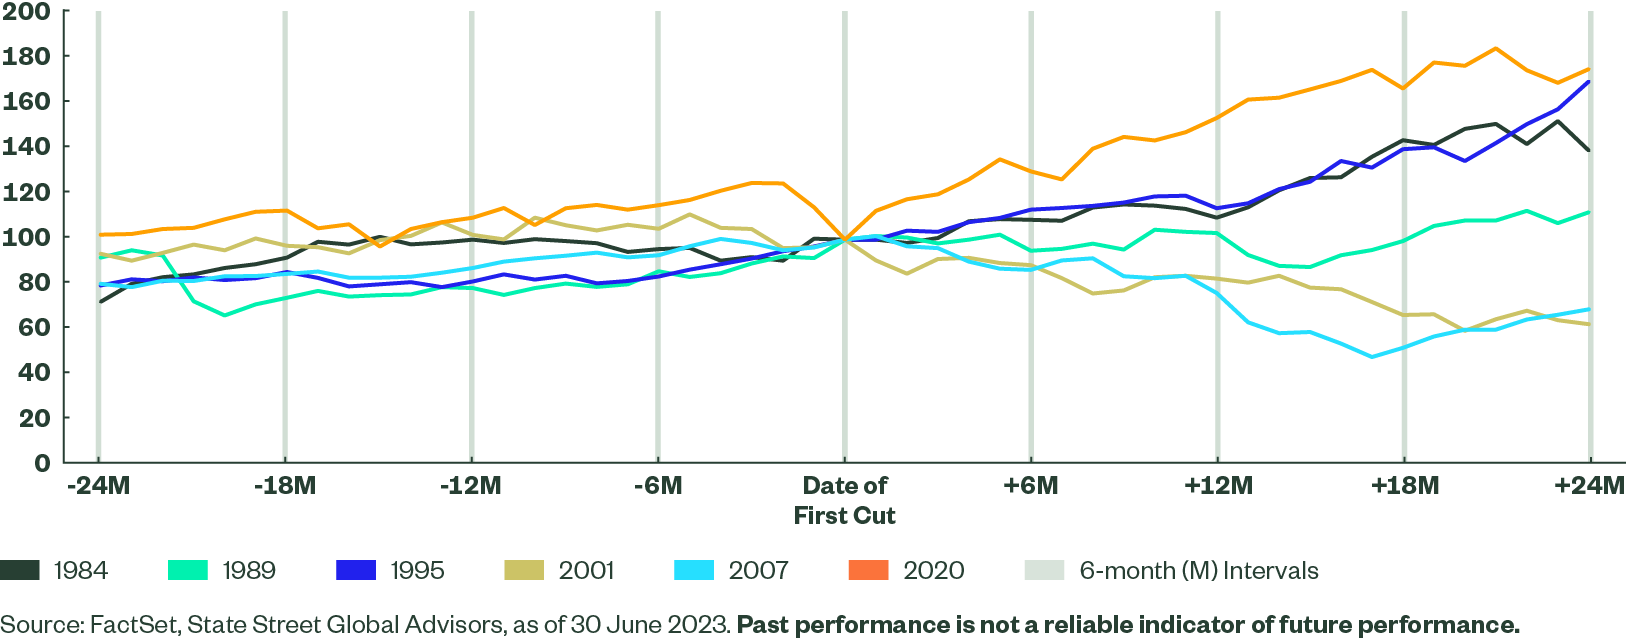
A hard-landing scenario, involving persistent deterioration in the economic environment and a severe global recession, could force policy makers to ease and cut interest rates. But policy easing does not guarantee an end to market volatility. Figure 2 shows that in recent cycles, the path of equity returns, once interest rate cuts begin, depends on several factors – most importantly, starting valuations, central bank liquidity injections and the path for growth. For example, a persistent deterioration in the economic environment, even after rate cuts, had continued to weigh on equity returns during the global financial crisis (GFC) in 2007–08.
Figure 2: S&P 500 Price Performance Indexed to 100 on First Rate Cut in a Cutting Cycle
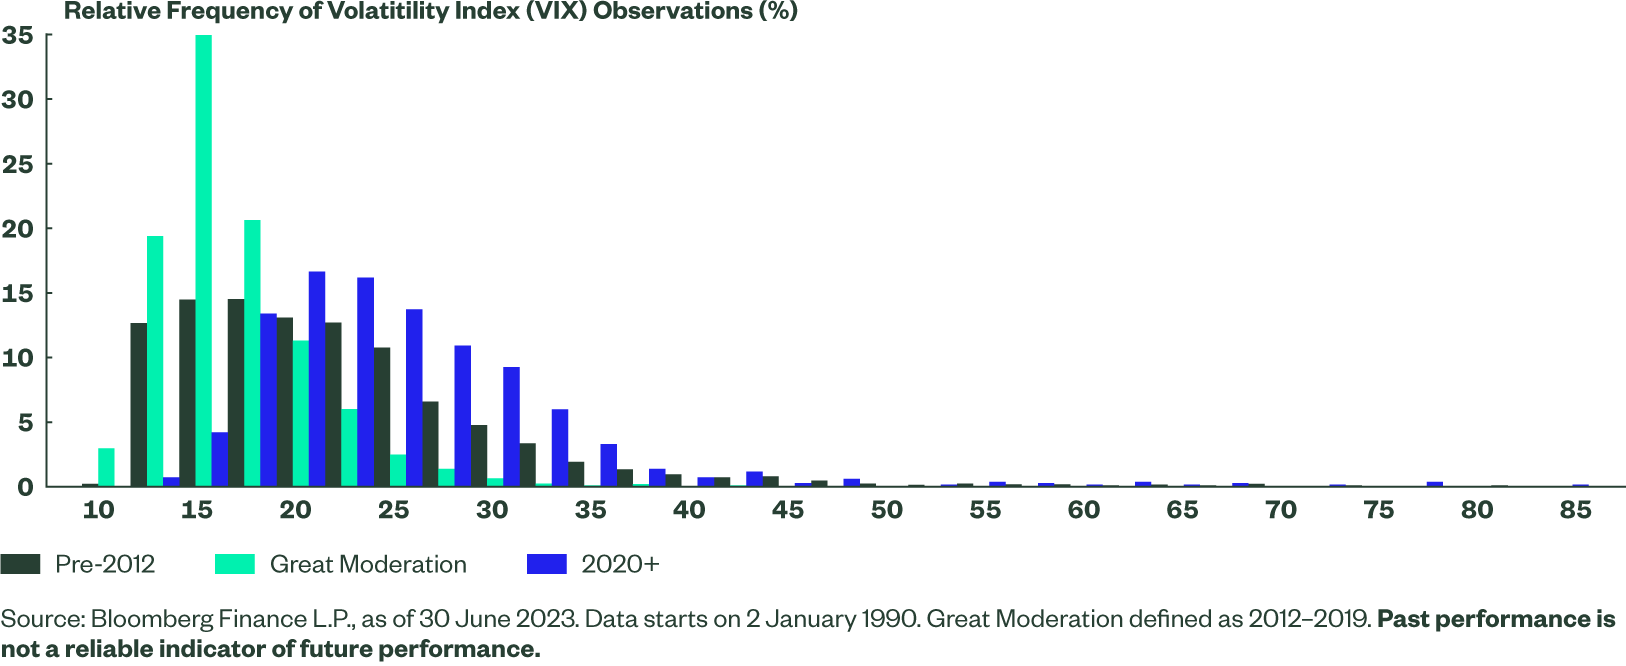
In the medium term, without the same level of liquidity injection that markets have become addicted to in the post-GFC era, we expect equity market volatility to resemble those of the pre-2012 era as shown in Figure 3.
Figure 3: Volatility Here to Stay as Central Bank Support of 2010s Comes to an End
Long-Term Outlook
Debt-Deleveraging via Inflation and Currency Devaluation?
The long-term debt cycle only reaches a turning point every several decade, and it is generally not given enough justice in financial literature. While a more normal amount of system-wide debt can be deleveraged nominally (e.g., through bankruptcies and austerities), long-term debt peaks involve huge amounts of system-wide debt (few hundred percent of gross domestic product [GDP]) and are difficult to deleverage nominally because they can sink the entire economic system.
Usually in US and international history, generational peaks in debt levels see the currency itself being eventually devalued by some extent instead of just a nominal debt collapse occurring. This is a path with far fewer frictions than austerity, debt defaults/restructurings or raising taxes.
A century of available data on US public debt provides a sound template for us to study the long-term debt cycle and its impact on equity markets. If we separate total US debt into 1) public debt and 2) non-public debt, it is clear that they have peaked at different stages. Non-public debt peaks have historically resulted in disinflationary banking crises (i.e., The Great Depression and the GFC), while public debt peaks have historically gone the inflationary devaluation route. Since non-public debt had already peaked during the GFC (as a percentage of GDP), for the remainder of this paper we focus on US public debt – which appears to have reached a new generational peak in the last two years.
If we view debt through the lens of “Total Public Debt/Money Supply,” generational peaks in public debt tend to be deleveraged, in part by an expansion of the money supply.5 At the end of a long-term debt cycle, the volume of money supply tends to go up (via quantitative easing) more than how much nominal debt goes down.
Figure 4: Peak US Total Public Debt vs. Money Supply
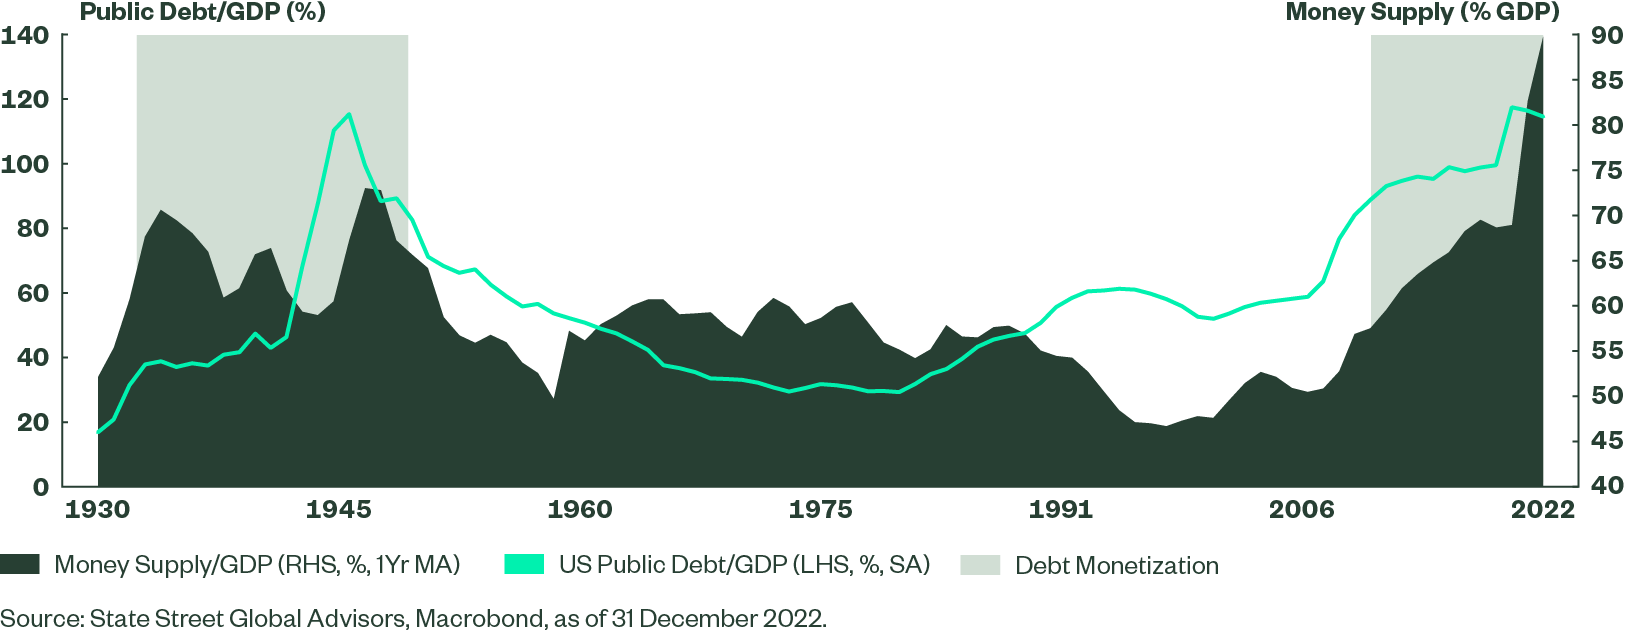
Figure 4 shows there have been two long-term public debt cycles over the past century. The first cycle peaked in the 1930s/’40s as the US entered World War 2. The war was financed by massive deficit spending and a peak in public debt, partly monetized by the Fed via money printing (money supply as a % of GDP increased substantially). An inflationary devaluation of the US dollar ensued, thus devaluing a large portion of the existing dollar-denominated debt bubble. After the war ended, the federal debt was never deleveraged much nominally. Instead, they held nominal debt relatively flat as nominal GDP caught up. The US was able to boost GDP growth by re-purposing the productive wartime infrastructure that they had built through federal deficit spending – improving overall productivity in the subsequent peacetime economy. As nominal GDP caught up (partially from growth and partially from inflation), interest rates were capped by the Fed at below the inflation rate, and federal debt as a percentage of GDP was reduced by more than half over the subsequent decades.
Fast forward to 2020, as governments around the world unleashed the biggest fiscal stimulus seen outside of wartime in response to the COVID-19 pandemic, US public debt once again reached its previous peak of 120% of GDP. However, in most developed countries the unexpected surge in inflation has subsequently reduced the real value of outstanding debt as a share of GDP. The resultant rapid increase in interest rates has further reduced the market value of the outstanding debt. This is a classic case of “inflating away the debt” where an expansion of money supply is eroding away the real value of debt today.
If history is any guide and we have passed another secular peak in federal debt, the longer-term solution to reduce existing debt will likely involve a combination of:
- A trend shift from disinflation to inflation, with policy makers accepting a higher “steady state inflation rate” and a prolonged period of fiat currency devaluation; and
- Negative or low positive real yields, given current high debt levels and large structural deficits in major advanced economies, and interest-servicing costs are becoming increasingly problematic.
To help monetary policy achieve price stability, fiscal policy needs to work hand-in-hand with monetary policy. If governments have fiscal restraint, cost of borrowing can be kept in check and real rates will not have to rise as much. In the absence of fiscal restraint, inflation pressures will worsen and real rates will need to remain higher for longer. This is less likely, in our view, as the political ramifications for irresponsibility will ultimately lead to disproportionate suffering for some cohorts in the economy and those in power to lose authority.
A Look at Factor Returns
Assuming governments are fiscally responsible, the combination of higher inflation, low real yields and falling federal debt has several implications for equity markets; from a systematic equity perspective, we can get a sense of how factors might behave in the forward environment by looking at their relative performance during similar debt reduction and inflationary environments in history:
Figure 5: Factor Returns and Market Volatility Were Higher During Past Secular Debt Reduction Periods
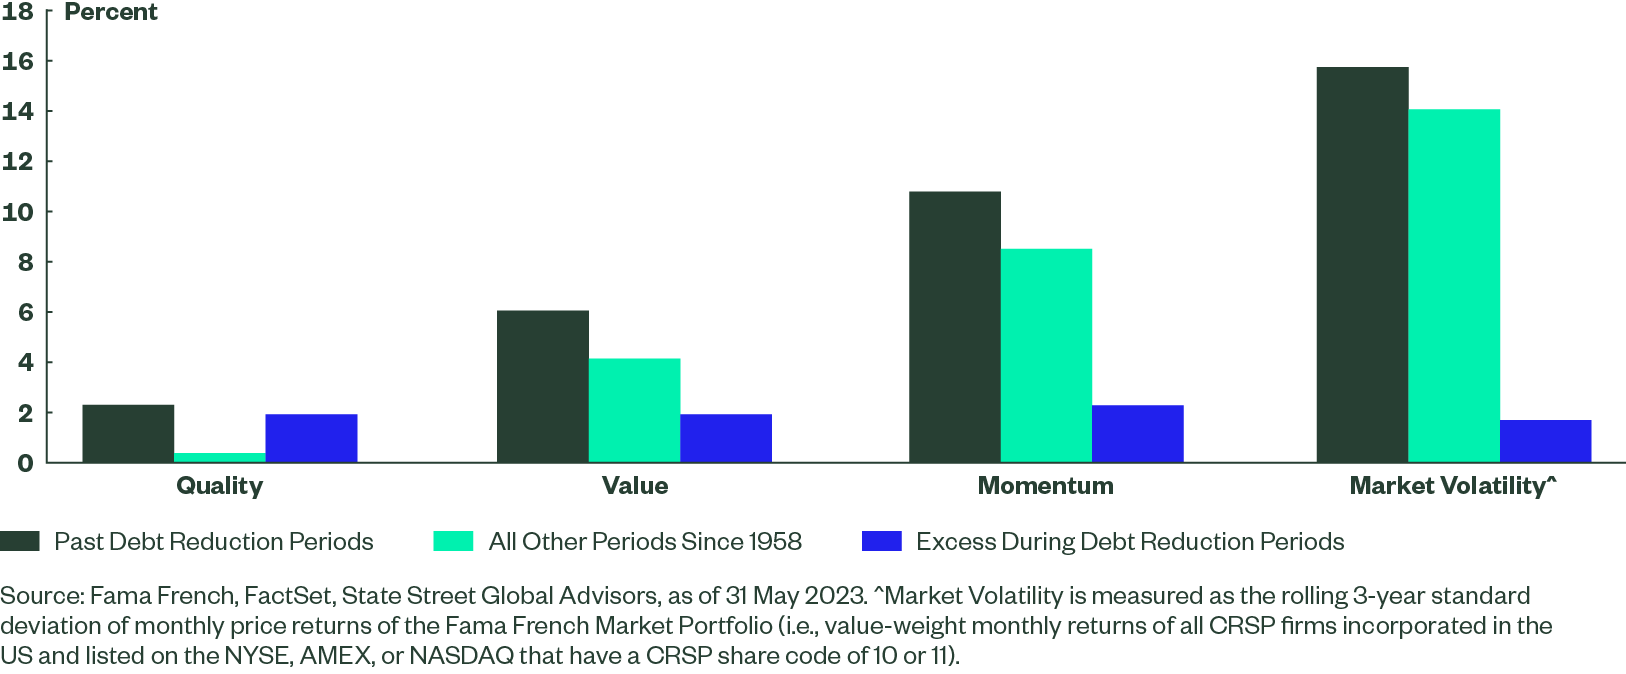
Figure 5 shows that during past periods of secular federal debt reduction,6 the well-known academic drivers of excess returns – Value, Momentum and Quality (defined as operating profitability) have all generated higher excess returns compared to periods where federal debt was in a secular upswing. With less fiscal and monetary support, equity market volatility also moved higher – particularly during the inflationary period of the late 1970s.
The economic rationale for Value’s outperformance is intuitive. During these periods of secular debt reduction, nominal interest rates were higher (though not necessarily higher in real terms), with the average Fed funds rate hovering at ~5.8% (vs. its long-term average of 4.6%) and long-dated bond yields averaging 6.6% (vs. its long-term average of 5.9%). Higher nominal yields meant longer-dated and more speculative cash flows were discounted more heavily – making Value stocks more attractive to hold.
In a world of higher inflation and higher cost of borrowing, more profitable companies, on average, provided stronger pricing power, cash flow generation and lower financial leverage – Quality characteristics that reduced idiosyncratic risks of equity holdings and provided superior returns to investors. Zombie firms that survived on cheap money to generate profits were quickly revealed to be a misallocation of capital, again benefiting Quality factors.
Conclusion
By studying secular debt cycles over the past century and comparing those to the current macroeconomic backdrop, we argue that the path toward normalization will likely be uneven and involve some level of debt monetization in the longer term.
Over a shorter horizon, there will likely be elevated equity market volatility given a combination of high valuations, relatively slow profit growth, still tight financial conditions and reasonably priced alternative assets. The combination of sticky inflation, higher interest rates and peak public debt levels suggests that counter-cyclical fiscal intervention will no longer be as supportive as it has been in the past decade – further fueling economic and market volatility.
In the longer term, history suggests that in order to reduce public debt from its generational peak, we may have to experience a prolonged period of fiat currency devaluation, and a trend shift in steady state inflation, alongside persistently lower real yields. These potential secular changes could benefit active systematic equity investors, as they are associated with higher factor returns and higher market volatility. Strategies with a focus on company fundamentals and reducing portfolio volatility could be well placed to outperform in such an environment.